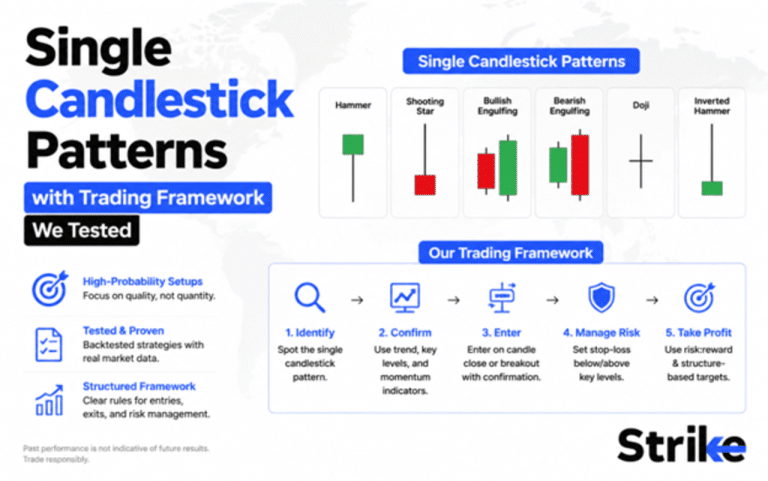
Single candlestick patterns help traders read buyer and seller pressure in one candle. Single candlestick patterns work best when traders use them with trend, volume, and support-resistance.
The brutal truth is single candles are market whispers, not guarantees. A 2019 study by Chen and Tsai found that a model could identify 8 candlestick patterns with 90.7% average accuracy, but pattern recognition is not the same as trade profitability.
This guide explains 13 single candlestick patterns and shows how to confirm them before trading.
What are Single Candlestick Patterns & How to Read Them?
Single candlestick patterns are one-candle formations that show buyer and seller pressure. Each candle shows 4 prices: open, high, low, and close.
 146")
Traders read a single candle through its body, wick, colour, size, and location. The body shows the move between open and close. The wick shows price rejection. A small body shows indecision. A long body shows strong buying or selling pressure.
The location matters most. A Hammer near support can show buying pressure. The same Hammer in the middle of a range may not be useful.
Read single candlestick patterns in 3 steps.
- Check the trend.
- Study the candle body and wick.
- Confirm with volume, support-resistance, or the next candle.
Single candlestick patterns work best as confirmation tools, not standalone trade signals.
1. Doji Candlestick Pattern
Doji is a candlestick where the opening and closing prices are almost the same. Doji shows market indecision because buyers and sellers both participate, but neither side controls the close.
 147")
The body is tiny. The upper and lower shadows may be short or long. The pattern forms when demand and supply stay balanced by the end of the session. A Doji matters more near support, resistance, trendlines, or after a strong move.
Confirmation comes when the next candle closes above the Doji high or below the Doji low. Without confirmation, Doji is only a pause signal.
| Summary of Doji Candlestick Pattern | |
| Pattern Type | Neutral, reversal, or continuation based on location |
| Characteristics | Tiny body, open and close almost equal, shadows vary |
| Preceding Trend | Uptrend, downtrend, or sideways market |
| Expectation | Indecision between buyers and sellers |
| Trade Entry Point | After price breaks the Doji high or low |
| Stop Loss | Opposite side of the Doji candle |
| Price Target | Nearby support, resistance, or planned risk-reward level |
| Result | Upward or downward movement after confirmation |
2. Hammer Candlestick Pattern
Hammer is a bullish reversal candlestick that appears after a decline. Hammer shows that sellers pushed price lower, but buyers recovered the move before the close.
 148")
The body is small and near the top of the candle. The lower shadow is long, usually at least twice the body. The upper shadow is small or absent. This structure shows rejection from lower levels.
Hammer works best near support, demand zones, or after panic selling. Confirmation comes when the next candle closes above the Hammer high.
| Summary of Hammer Candlestick Pattern | |
| Pattern Type | Bullish reversal |
| Characteristics | Small body near top, long lower shadow, little or no upper shadow |
| Preceding Trend | Downtrend |
| Expectation | Buyers reject lower prices |
| Trade Entry Point | Buy above Hammer high after confirmation |
| Stop Loss | Below Hammer low |
| Price Target | Nearby resistance or planned risk-reward level |
| Result | Upward price movement after confirmation |
3. Inverted Hammer Candlestick Pattern
Inverted Hammer is a bullish reversal candlestick that appears after a downtrend. Inverted Hammer shows that buyers are trying to regain control, even though sellers still resist.
Inverted Hammer candle has a small body near the bottom and a long upper shadow. The lower shadow is small or absent. Buyers push price higher during the session, but sellers pull it back before the close.
This pattern needs stronger confirmation than a Hammer because it does not close near the high. Confirmation comes when the next candle closes above the Inverted Hammer high.
| Summary of Inverted Hammer Candlestick Pattern | |
| Pattern Type | Bullish reversal |
| Characteristics | Small body near bottom, long upper shadow, small or no lower shadow |
| Preceding Trend | Downtrend |
| Expectation | Buyers attempt to reverse the fall |
| Trade Entry Point | Buy above pattern high after confirmation |
| Stop Loss | Below pattern low |
| Price Target | Nearby resistance or planned risk-reward level |
| Result | Upward price movement after confirmation |
4. Shooting Star Candlestick Pattern
Shooting Star is a bearish reversal candlestick that appears after an uptrend. Shooting Star shows that buyers pushed price higher, but sellers rejected the move before the close.
 150")
The body is small and near the lower part of the candle. The upper shadow is long, while the lower shadow is small or absent. This structure shows rejection from higher levels.
Shooting Star works best near resistance, supply zones, or after a stretched rally. Confirmation comes when the next candle closes below the Shooting Star low.
| Summary of Shooting Star Candlestick Pattern | |
| Pattern Type | Bearish reversal |
| Characteristics | Small body near bottom, long upper shadow, little or no lower shadow |
| Preceding Trend | Uptrend |
| Expectation | Sellers reject higher prices |
| Trade Entry Point | Sell below Shooting Star low after confirmation |
| Stop Loss | Above Shooting Star high |
| Price Target | Nearby support or planned risk-reward level |
| Result | Downward price movement after confirmation |
5. Hanging Man Candlestick Pattern
Hanging Man is a bearish reversal candlestick that forms after an uptrend. Hanging Man looks like a Hammer, but its location changes the meaning.
 151")
The body is small and near the top. The lower shadow is long. Sellers drag price lower during the session, but buyers recover part of the fall before the close. This shows hidden weakness in the uptrend.
Hanging Man works better near resistance or after a sharp rally. Confirmation comes when the next candle closes below the Hanging Man low.
| Summary of Hanging Man Candlestick Pattern | |
| Pattern Type | Bearish reversal |
| Characteristics | Small body near top, long lower shadow, little or no upper shadow |
| Preceding Trend | Uptrend |
| Expectation | Sellers start testing buyer strength |
| Trade Entry Point | Sell below Hanging Man low after confirmation |
| Stop Loss | Above Hanging Man high |
| Price Target | Nearby support or planned risk-reward level |
| Result | Downward price movement after confirmation |
6. Spinning Top Candlestick Pattern
Spinning Top is a candlestick with a small body and visible shadows on both sides. Spinning Top shows hesitation because buyers and sellers both move price, but neither side controls the close.
 152")
The small body shows that open and close are close to each other. The shadows show two-sided price movement. It becomes more useful after a long trend, near support, near resistance, or during exhaustion.
Confirmation comes from the next candle. A close above the high favours buyers. A close below the low favours sellers.
| Summary of Spinning Top Candlestick Pattern | |
| Pattern Type | Neutral, reversal, or continuation based on location |
| Characteristics | Small body with upper and lower shadows |
| Preceding Trend | Uptrend, downtrend, or range |
| Expectation | Indecision after two-sided movement |
| Trade Entry Point | Enter after price breaks the candle high or low |
| Stop Loss | Opposite side of the candle |
| Price Target | Nearby support, resistance, or range boundary |
| Result | Direction depends on confirmation |
7. Marubozu Candlestick Pattern
Marubozu is a long-body candle with little or no shadows. Marubozu shows strong directional control because one side dominates almost the full session.
 153")
A bullish Marubozu opens near the low and closes near the high. A bearish Marubozu opens near the high and closes near the low. In Japanese candlestick literature, Marubozu means “shaven,” referring to its clean appearance.
The pattern becomes stronger during breakouts, breakdowns, or trend continuation moves. Traders should avoid chasing a very large Marubozu when risk-reward becomes poor.
| Summary of Marubozu Candlestick Pattern | |
| Pattern Type | Bullish or bearish continuation/reversal |
| Characteristics | Long body, little or no upper and lower shadows |
| Preceding Trend | Uptrend, downtrend, or breakout zone |
| Expectation | Strong control by buyers or sellers |
| Trade Entry Point | Enter on continuation breakout or pullback after the candle |
| Stop Loss | Below bullish Marubozu low or above bearish Marubozu high |
| Price Target | Nearby support-resistance or planned risk-reward level |
| Result | Direction usually follows the candle, if confirmation supports it |
8. Belt Hold Candlestick Pattern
Belt Hold is a strong single-candle pattern where price opens near one extreme and moves firmly in one direction. Belt Hold shows early session control.
 154")
A bullish Belt Hold opens near the low and closes much higher. A bearish Belt Hold opens near the high and closes much lower. The candle usually has a long body and little or no shadow on the opening side.
The pattern works best after a clear prior trend. Confirmation improves when the next candle follows through with volume near support or resistance.
| Summary of Belt Hold Candlestick Pattern | |
| Pattern Type | Bullish or bearish reversal |
| Characteristics | Long body, opens near one extreme, closes strongly away from open |
| Preceding Trend | Downtrend for bullish setup; uptrend for bearish setup |
| Expectation | Strong control shift |
| Trade Entry Point | Above bullish Belt Hold high or below bearish Belt Hold low |
| Stop Loss | Opposite end of the Belt Hold candle |
| Price Target | Nearby support-resistance or planned risk-reward level |
| Result | Upward or downward movement based on candle direction |
9. Rickshaw Man Candlestick Pattern
Rickshaw Man is a long-legged Doji where the open and close sit near the middle of the candle. Rickshaw Man shows extreme indecision after wide price movement.
 155")
The candle has a tiny body near the centre and long upper and lower shadows. Buyers and sellers both control the session at different points, but neither side keeps control.
Rickshaw Man matters most after a strong trend. Confirmation comes when price closes above the candle high or below the candle low.
| Summary of Rickshaw Man Candlestick Pattern | |
| Pattern Type | Indecision or possible reversal |
| Characteristics | Tiny body near centre, long upper and lower shadows |
| Preceding Trend | Strong uptrend or downtrend |
| Expectation | Extreme indecision after volatility |
| Trade Entry Point | After breakout above high or breakdown below low |
| Stop Loss | Opposite side of candle range |
| Price Target | Nearby support, resistance, or volatility-based target |
| Result | Direction depends on breakout confirmation |
10. High Wave Candle Candlestick Pattern
High Wave Candle is a volatile indecision pattern with a small body and long shadows on both sides. High Wave Candle shows that buyers and sellers are active, but neither side controls the close.
 156")
The wide high-low range shows strong movement. The small body shows lack of conviction. This candle often appears near turning points, news events, or emotional market phases.
Confirmation comes from a close outside the candle range. A close above the high supports buyers. A close below the low supports sellers.
| Summary of High Wave Candle Candlestick Pattern | |
| Pattern Type | Indecision or possible reversal |
| Characteristics | Small body with long upper and lower shadows |
| Preceding Trend | Uptrend, downtrend, or volatile range |
| Expectation | High volatility and unclear control |
| Trade Entry Point | After confirmed breakout from the candle range |
| Stop Loss | Opposite side of candle range |
| Price Target | Nearby support-resistance or volatility-based level |
| Result | Direction depends on confirmation |
11. Takuri Line Candlestick Pattern
Takuri Line is a bullish reversal candlestick that appears after a downtrend. Takuri Line looks like a Hammer, but the lower shadow is usually much longer.
 157")
The body is small and near the top. The lower shadow is very long. Sellers push price sharply lower, but buyers absorb the fall and pull price back toward the upper range.
The pattern works best near support, demand zones, or after panic selling. Confirmation comes when the next candle closes above the Takuri Line high.
| Summary of Takuri Line Candlestick Pattern | |
| Pattern Type | Bullish reversal |
| Characteristics | Small body near top, very long lower shadow, little or no upper shadow |
| Preceding Trend | Downtrend |
| Expectation | Strong rejection from lower levels |
| Trade Entry Point | Buy above Takuri Line high after confirmation |
| Stop Loss | Below Takuri Line low |
| Price Target | Nearby resistance or planned risk-reward level |
| Result | Upward price movement after confirmation |
12. Shaven Head Candlestick Pattern
Shaven Head is a candlestick with no upper shadow. Shaven Head shows strong closing pressure because price closes at or near the high of the session.
 158")
A bullish Shaven Head shows that buyers stayed active into the close. It can support continuation during an uptrend or reversal near support after a decline.
The pattern becomes stronger when it breaks resistance or appears with rising volume. Confirmation comes when price follows through above the candle high.
| Summary of Shaven Head Candlestick Pattern | |
| Pattern Type | Bullish continuation or reversal |
| Characteristics | No upper shadow, close near high, body direction matters |
| Preceding Trend | Downtrend reversal area or uptrend continuation area |
| Expectation | Strong closing pressure near the high |
| Trade Entry Point | Buy above candle high after confirmation |
| Stop Loss | Below candle low or recent swing low |
| Price Target | Nearby resistance or planned risk-reward level |
| Result | Upward price movement after confirmation |
13. Shaven Bottom Candlestick Pattern
Shaven Bottom is a candlestick with no lower shadow. Shaven Bottom shows strong price action from the low because price does not trade meaningfully below the candle’s lower end.
 159")
The meaning depends on candle colour and location. A bearish Shaven Bottom shows selling pressure when price closes lower. A bullish Shaven Bottom near support shows that buyers defended the low.
Traders should check the prior trend, nearby support-resistance, and the next candle. A close below the low supports bearish continuation. A close above the high supports bullish strength.
| Summary of Shaven Bottom Candlestick Pattern | |
| Pattern Type | Bullish or bearish depending on colour and location |
| Characteristics | No lower shadow, candle direction decides interpretation |
| Preceding Trend | Uptrend, downtrend, or key level |
| Expectation | Strong reaction from the low or strong selling pressure |
| Trade Entry Point | Enter after confirmed break of candle high or low |
| Stop Loss | Opposite side of the candle |
| Price Target | Nearby support-resistance or planned risk-reward level |
| Result | Upward or downward price movement after confirmation |
Download All Single Candlestick Pattens Images PDF
The PDF includes the structure of each candle, its usual market meaning, and whether the pattern is commonly bullish, bearish, or neutral.
Use this PDF as a visual checklist, not as a standalone trading system. A candlestick pattern becomes useful only when traders confirm it with trend direction, support-resistance, volume, and the next candle.
Which Single Candlestick Patterns are Bullish, Bearish or Neutral?
Single candlestick patterns become bullish, bearish, or neutral based on shape, preceding trend, and chart location. The same candle can give a different meaning when it appears at support, resistance, or in the middle of a range.
| Category | Patterns | Usual Meaning |
| Bullish Single Candlestick Patterns | Hammer, Inverted Hammer, Takuri Line, Shaven Head | These patterns usually show buying pressure, rejection from lower levels, or strong closing strength. |
| Bearish Single Candlestick Patterns | Shooting Star, Hanging Man, Shaven Bottom | These patterns usually show selling pressure, rejection from higher levels, or weakness after an uptrend. |
| Neutral Single Candlestick Patterns | Doji, Spinning Top, Rickshaw Man, High Wave Candle, Marubozu, Belt Hold | These patterns need context because their meaning changes based on candle colour, trend, support-resistance, and confirmation. |
Simple rule: Hammer, Inverted Hammer, and Takuri Line usually lean bullish. Shooting Star and Hanging Man usually lean bearish. Doji, Spinning Top, Rickshaw Man, and High Wave Candle stay neutral until the next candle confirms direction.
How to Identify Single Candlestick Patterns Correctly?
Single candlestick patterns are identified correctly by reading the shape, trend, location, and confirmation together. A candle name alone is not enough.
 160")
First, check the candle body. A long body shows strong buying or selling pressure. A small body shows indecision. Next, check the wicks. A long lower wick shows rejection from lower prices. A long upper wick shows rejection from higher prices.
Then, check the preceding trend. A Hammer matters after a downtrend. A Hanging Man matters after an uptrend. A Doji becomes more useful after a strong move than in the middle of a flat range.
Finally, check the location. Patterns near support, resistance, trendlines, moving averages, or demand-supply zones carry more value. A pattern formed in the middle of a noisy chart is usually weaker.
Use this simple identification rule.
- Identify the candle shape.
- Check the trend before the candle.
- Confirm the candle location.
- Wait for the next candle or volume confirmation.
Single candlestick patterns work best when the candle structure and chart context tell the same story.
How to Confirm Single Candlestick Pattern Signals?
Single candlestick pattern signals are confirmed by checking trend, location, volume, and the next candle. A pattern becomes stronger when all four support the same direction.
For bullish patterns, confirmation comes when the next candle closes above the pattern high. For bearish patterns, confirmation comes when the next candle closes below the pattern low.
Volume adds more strength. A Hammer with rising volume near support is stronger than a Hammer in the middle of a range.
Use these confirmation filters.
- Trend filter: Confirm whether the pattern appears after the right preceding trend.
- Location filter: Check support, resistance, trendline, or moving average zone.
- Volume filter: Look for higher volume during breakout or reversal.
- Next-candle filter: Wait for follow-through above or below the pattern range.
- Risk filter: Avoid signals where the stop-loss is too wide for the possible reward.
How to Trade Using Single Candlestick Patterns?
Trade single candlestick patterns by treating them as setup signals, not direct entry signals. First, identify the market trend. Then, wait for the candle to form near an important chart level.
 161")
For example, a Hammer after a downtrend near support can create a bullish setup. A trader can enter only after price moves above the Hammer high. The stop-loss goes below the Hammer low. The first target can be the nearest resistance or a fixed risk-reward level.
Use this simple trading process.
- Find the trend.
- Mark support and resistance.
- Wait for a valid single candlestick pattern.
- Enter after confirmation.
- Place stop-loss beyond the candle range.
- Book profit near the next key level or trail the trade.
Single candlestick patterns work better when the entry, stop-loss, and target are planned before the trade.
Are Single Candlestick Patterns Profitable?
Single candlestick patterns can be profitable, but they are weak as standalone buy or sell signals. Their performance improves when traders use them with trend, support-resistance, volume, confirmation, and risk management.
Academic research supports this cautious view. Marshall, Young, and Rose (2006) tested candlestick strategies on Dow Jones Industrial Average (DJIA) stocks and found that they did not create clear value for investors. Their later study, “Are Candlestick Technical Trading Strategies Profitable in the Japanese Equity Market?” (2008), tested Japanese equities from 1975 to 2004 and found no evidence that candlestick strategies added value across the full 30-year period, three 10-year sub-periods, or bull and bear markets.
Trader-level backtesting gives a similar warning. Thomas Bulkowski found that the Hammer acted as a bullish reversal around 60% of the time, while the Shooting Star acted as a bearish reversal around 59% of the time. These numbers are not strong enough to trade blindly.
How to Backtest Single Candlestick Patterns?
Backtest single candlestick patterns by using fixed rules. Do not change the rules after seeing the result.
- Select one candlestick pattern. Start with one pattern, such as Hammer, Doji, Shooting Star, or Marubozu.
- Define the exact formation rules. Write the body size, wick size, colour, and trend condition clearly. For example, a Hammer must have a small body near the top and a lower wick at least 2 times the body size.
- Choose the market and timeframe. Select the asset group and chart timeframe. For example, test Nifty 50 stocks on daily charts for the last 5 years.
- Add the preceding trend condition. A Hammer should appear after a downtrend. A Shooting Star should appear after an uptrend. This step prevents random pattern testing.
- Set the entry rule. Define when the trade starts. For example, buy when price breaks above the Hammer high or sell when price breaks below the Shooting Star low.
- Set the stop-loss rule. Place the stop-loss beyond the candle range. For example, keep the stop-loss below the Hammer low or above the Shooting Star high.
- Set the exit rule. Decide whether the trade exits at a fixed risk-reward, nearest support-resistance, trailing stop-loss, or after a fixed number of candles.
- Record every trade. Track entry, stop-loss, target, result, profit, loss, holding period, and market condition.
- Measure the performance. Check win rate, average profit, average loss, risk-reward ratio, maximum drawdown, and expectancy.
- Test filters one by one. Add support-resistance, volume, moving average, Relative Strength Index (RSI), or trend filters separately. This shows which filter actually improves the result.
- Compare the pattern with a baseline. Compare the pattern result with simple buy-and-hold or random entry rules. This shows whether the pattern adds real value.
- Validate on fresh data. Test the same rules on a different period, different stocks, or out-of-sample data. A pattern is more useful when it works beyond one selected dataset.
Which Single Candlestick Patterns are Best for Intraday Trading?
The best single candlestick patterns for intraday trading are patterns that show quick rejection, momentum, or indecision near key levels. Intraday traders need faster confirmation because short timeframes create more noise.
Useful intraday single candlestick patterns include:
- Hammer: Useful near intraday support after a quick fall.
- Shooting Star: Useful near resistance after a quick rally.
- Marubozu: Useful during strong breakout or breakdown moves.
- Doji: Useful near support or resistance when the market pauses.
- Spinning Top: Useful when momentum slows after a sharp intraday move.
- High Wave Candle: Useful during volatile sessions, but only after confirmation.
For intraday trading, the pattern should appear near VWAP, previous day high or low, opening range, support, resistance, or a major moving average. A random candle in the middle of the chart has low value.
Which Single Candlestick Patterns are Suitable for Swing Trading?
The best single candlestick patterns for swing trading are patterns that show reversal or continuation on daily and weekly charts. Swing traders need stronger signals because they hold trades for several days or weeks.
Useful swing trading patterns include:
- Hammer: Useful near support after a correction.
- Takuri Line: Useful after a sharp decline near a demand zone.
- Inverted Hammer: Useful after a downtrend, if the next candle confirms strength.
- Shooting Star: Useful near resistance after a strong rally.
- Hanging Man: Useful after an uptrend, if the next candle confirms weakness.
- Marubozu: Useful during breakout, breakdown, or trend continuation.
Swing traders should give more importance to daily and weekly candles. A single pattern on a higher timeframe usually carries more weight than the same pattern on a 5-minute chart.
What are the Common Mistakes to Avoid While Trading Single Candlesticks?
The most common mistake is trading a single candlestick pattern without context. A candle alone does not create a complete trade setup.
Avoid these 7 mistakes.
- Ignoring the preceding trend. A Hammer matters after a downtrend, not randomly anywhere.
- Trading without confirmation. Wait for the next candle, breakout, or volume support.
- Ignoring support and resistance. Patterns near key levels work better than patterns in empty zones.
- Using the same pattern in every market. A pattern can work well in trending markets and fail in choppy markets.
- Entering after a very large candle. Large candles can make stop-loss too wide and risk-reward poor.
- Using no stop-loss. Every pattern can fail, even when it looks perfect.
- Assuming candlesticks predict the future. Candlesticks show current pressure. They do not guarantee the next move.
How Many Single Candlestick Patterns are There?
There is no fixed universal number of single candlestick patterns because different books and trading platforms classify them differently. Most traders commonly use around 10 to 20 popular single candlestick patterns.
This article covers 13 important single candlestick patterns.
- Doji
- Hammer
- Inverted Hammer
- Shooting Star
- Hanging Man
- Spinning Top
- Marubozu
- Belt Hold
- Rickshaw Man
- High Wave Candle
- Takuri Line
- Shaven Head
- Shaven Bottom
Some patterns are independent. Some are variations of broader candle families. For example, Rickshaw Man is a type of long-legged Doji. Takuri Line is similar to a Hammer with a much longer lower shadow.
Single Candlestick Patterns vs Double and Triple Candlestick Patterns
| Comparison Point | Single Candlestick Patterns | Double Candlestick Patterns | Triple Candlestick Patterns |
| Meaning | Patterns formed with 1 candle | Patterns formed with 2 candles | Patterns formed with 3 candles |
| Signal Speed | Fastest signal because only one candle is needed | Slower than single patterns but gives better context | Slowest signal but gives stronger confirmation |
| Market Reading | Shows immediate buyer-seller pressure | Shows shift between two sessions | Shows sustained buying or selling pressure |
| Confirmation Need | Needs stronger confirmation from volume, trend, or next candle | Needs moderate confirmation | Needs less confirmation compared to single candles |
| Best Use | Early clue near support, resistance, or trend exhaustion | Reversal or continuation confirmation | Strong reversal or continuation signal |
| Risk | Higher false signals | Lower false signals than single candles | Lower false signals but late entry risk |
| Popular Bullish Patterns | Hammer, Inverted Hammer, Takuri Line, Bullish Marubozu, Shaven Head | Bullish Engulfing, Piercing Line, Tweezer Bottom, Bullish Harami | Morning Star, Three White Soldiers, Three Inside Up, Three Outside Up |
| Popular Bearish Patterns | Shooting Star, Hanging Man, Bearish Marubozu, Shaven Bottom | Bearish Engulfing, Dark Cloud Cover, Tweezer Top, Bearish Harami | Evening Star, Three Black Crows, Three Inside Down, Three Outside Down |
| Popular Neutral Patterns | Doji, Spinning Top, Rickshaw Man, High Wave Candle | Harami Cross, Matching Low, Separating Lines | Tri-Star Doji, Deliberation Pattern, Advance Block |
| Example | A Hammer near support shows rejection from lower levels. | A Bullish Engulfing shows buyers overpowering the previous bearish candle. | Three White Soldiers show buyers controlling three sessions in a row. |
| Main Limitation | One candle can mislead without context. | Two candles may still fail in choppy markets. | Three candles may confirm the move after a large part is already over. |
Benefits vs Limitations of Single Candlestick Patterns
| Benefits of Single Candlestick Patterns | Limitations of Single Candlestick Patterns |
| Easy to identify because they use only one candle. | Can give false signals because one candle does not show the full market story. |
| Show buyer and seller pressure quickly through body size, wick length, and close position. | Need confirmation from trend, volume, support-resistance, or the next candle. |
| Work across markets such as stocks, indices, forex, commodities, and crypto. | Work poorly in sideways markets where price moves without clear direction. |
| Help spot early reversal clues near support, resistance, demand zones, or supply zones. | Do not guarantee reversal or continuation even when the candle looks perfect. |
| Support intraday and swing trading because they appear on all timeframes. | Create more noise on lower timeframes such as 1-minute or 5-minute charts. |
| Give clear invalidation levels because traders can use the candle high or low for stop-loss planning. | Do not provide fixed targets because target depends on support, resistance, trend, and risk-reward. |
| Combine well with indicators such as Moving Average (MA), Relative Strength Index (RSI), and volume. | Lose reliability without context when traders ignore the preceding trend and chart location. |
| Make price action easier to read for beginners and experienced traders. | Can encourage emotional trading when traders enter immediately without a proper setup. |
Conclusion
Single candlestick patterns are useful because they simplify price action into one clear visual signal. They show buying pressure, selling pressure, rejection, momentum, or indecision in a single candle.
But single candles are not shortcuts to guaranteed trades. They work best when traders read them with trend, support-resistance, volume, confirmation, and risk management. The real edge does not come from memorising pattern names. The real edge comes from knowing where the pattern appears, why it forms, and when the market confirms it.


 Previous Article


![15 Investing.com Alternatives [Free+Paid] You Should Use in 2026](https://www.strike.money/wp-content/uploads/2026/04/Investing.com-Alternatives.jpg "15 Investing.com Alternatives [Free+Paid] You Should Use in 2026 178")
![15 TradeStation Alternatives [Free+Paid] You Should Use in 2026](https://www.strike.money/wp-content/uploads/2026/04/TradeStation-Alternatives.jpg "15 TradeStation Alternatives [Free+Paid] You Should Use in 2026 179")
![15 Chartink Alternatives [Free+Paid] You Should Use in 2026](https://www.strike.money/wp-content/uploads/2026/04/Chartlink-Alternatives.jpg "15 Chartink Alternatives [Free+Paid] You Should Use in 2026 180")
: Overview, 10 Types of Indicators, Settings for Different Markets 182")

 : Definition, Formula, calculation, Uses, Advantages Vs limitations 184")


No Comments Yet.