Long Legged Doji: What Does It Indicate, Trading Playbook, Is it Reliable?


 Author

 Editor
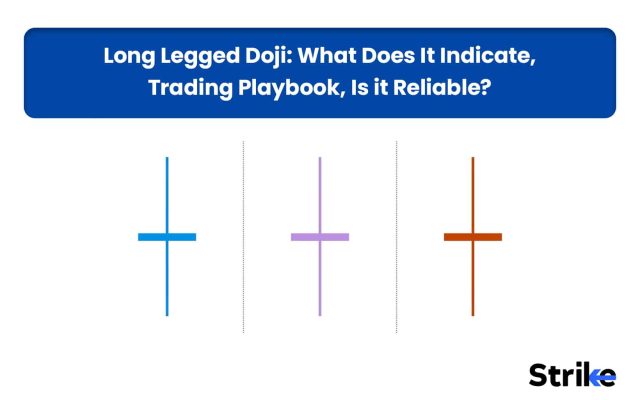
Long Legged Doji is one of the most followed candlestick patterns that reflects intense battle between buying and selling during a trading session, with neither side gaining control by the close. Long Legged Doji forms when the opening and closing prices are nearly the same, while long upper and lower shadows indicate significant price movement in both directions.
Unlike bullish or bearish reversal patterns, the Long Legged Doji is a neutral indecision candle pattern whose significance depends on confirmation from the next candle and the prevailing market trend. Originating from 18th-century Japanese candlestick charting, it remains popular because it helps traders identify uncertainty, potential trend reversals, or continuation opportunities across stocks, forex, commodities, and cryptocurrencies.
What Is a Long Legged Doji?
Long Legged Doji is a single candlestick pattern that signals market indecision. It forms when price moves significantly up and down, but at the end it closes near its opening. This creates a candle with a small real body and long upper and lower shadow, appearing as a cross sign.
However, it is very rare to find a perfect Long Legged Doji where price closes exactly at the level of opening. Therefore a Long Legged Doji with opening and closing within 5–10% of the total candle range can be considered.
How to Identify a Long Legged Doji
There are three important points you should check while identifying a correct Long Legged Doji, because not all the crossed shaped candles are Long Legged Doji.
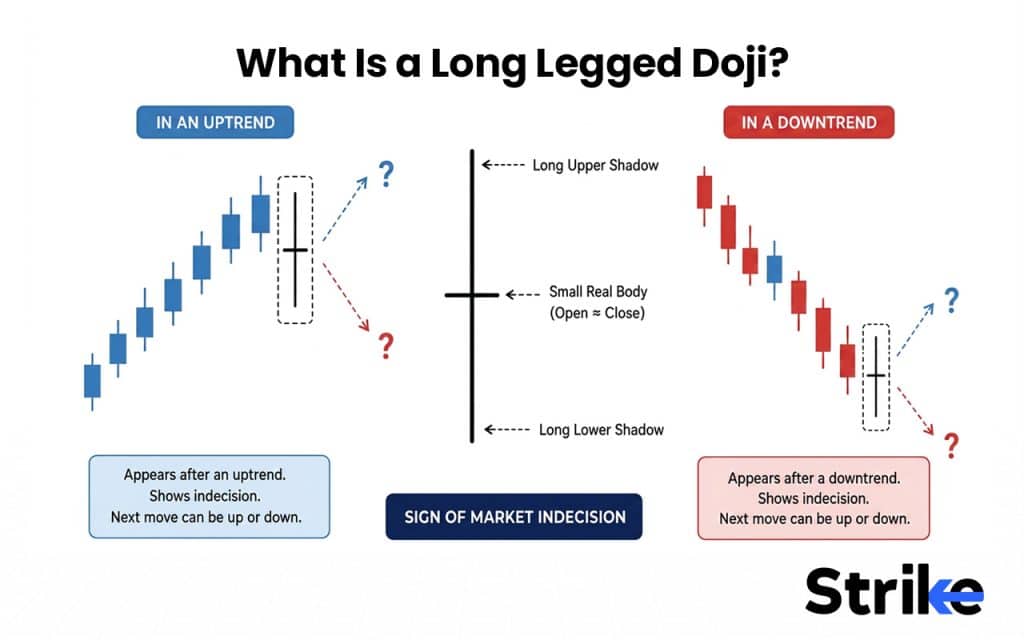
- Very Small or No Real Body: A candle should close near its opening, creating a very small or negligible body. The body should ideally be within 5% of the candle’s total range. If the body is visibly thicker, it will come under the spinning top category.
- Both the Wicks Should Long: Both upper and lower wicks should be long and almost identical, usually 2-3X than the body. If the one side wick is noticeably longer than the other, it can probably be a Dragonfly Doji or Gravestone Doji.
- Location on the chart: The Long Legged Doji is more relevant when it appears after a strong trending move instead of appearing in a sideways market.
I have seen many traders confusing between Long Legged Doji and spinning top candlestick patterns as they both look kind of similar. The differentiating factor is body to candle ratio.
Is a Long Legged Doji Bullish or Bearish?
Long Legged Doji is neither bullish nor bearish on its own, because it is a neutral candlestick pattern and only represents market indecision. Whether it will become bullish or bearish totally depends on where it appears on the chart and what candle forms next after it.
If it appears after a downtrend and the next candle closes above the Long Legged Doji, the Long Legged Doji serves as a bullish signal, whereas when it appears after an uptrend and next candle closes below the Long Legged Doji, the Long Legged Doji serves as a bearish signal.
Is a Long Legged Doji a Buy or Sell Signal?
No, Long Legged Doji is not a direct buy or sell signal. On its own, it is just a visual representation of market indecision, where neither side is clearly dominating. Immediately interpreting Long Legged Doji as a buy or sell signal can lead to a loss more often.
So, whether to buy or sell depends on the next candle. If the next candle forms is bullish and closes above Doji, you can consider it as a buy signal and if the next candle forms is bearish and closes below Doji, you can consider it as a sell signal.
The Market Psychology Behind the Long Legged Doji
Long Legged Doji represents a strong battle between buyers and sellers where both of them try to move price in their favour but neither of them wins, leaving the market indecisive.
Suppose, during the opening session, buyers were dominating and pushed the price higher. These higher prices attract sellers to short at premium prices, pushing the price down. This forms the upper wick.
After a enough price drop, buyers re-enter the market to push price higher once again in their favour, but due to active selling pressure, buyers fail to reclaim previous high and candle closes near its open.
What Does It Mean After an Uptrend vs a Downtrend?
The meaning of Long Legged Doji is market indecision, but where it appears in the trend can add some actionable value to it.
- Long Legged Doji After Downtrend: If the Long Legged Doji appears after a sustained downtrend, it means that buyers have entered the market, but the decision is still unclear whether the momentum will shift to bullish or not. If the next candle forms is bullish and closes above the high of the Doji, it confirms that the buyers have gained control and trend has shifted to bullish.
- Long Legged Doji After Uptrend: If the Long Legged Doji appears after a sustained uptrend, it means that sellers have entered the market, but the decision is still unclear whether the momentum will shift to bearish or not. If the next candle forms is bearish and closes below the low of Doji, it confirms that the sellers have gained control and trend has shifted to bearish.
Hence, Long Legged Doji is just a warning sign and does not reveal which side will win. An actionable decision can be made only after the next candle forms.
4 Doji Look-Alikes We See on Charts
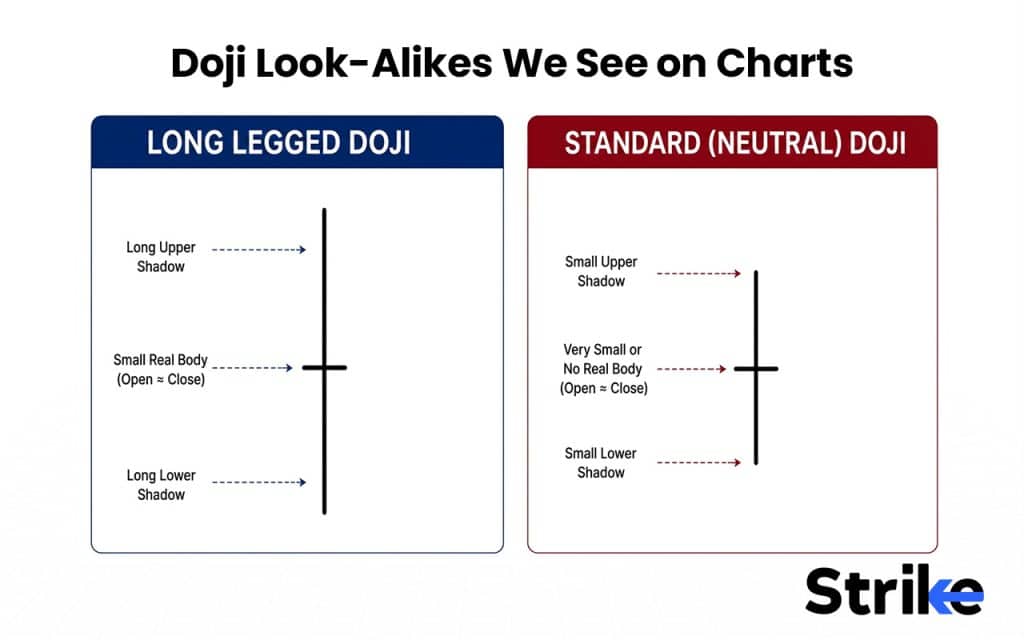
Apart from the Long Legged Doji, the Doji family has four other variants that follow the same core logic of a small real body with upper and lower shadow. The differentiating factor among this variant is length and position of the shadow which gives each pattern a distinct appearance.
1. Standard (Neutral) Doji
Standard Doji also known as Neutral Doji has a very small or no real body with a small upper and lower shadow. Unlike Long Legged Doji, shadow length in standard Doji is smaller and nearly identical on both the sides. Hence, it indicates market indecision but with less volatility. This pattern usually carries less reliability unless it forms near a key price level.
2. Dragonfly & Gravestone Doji
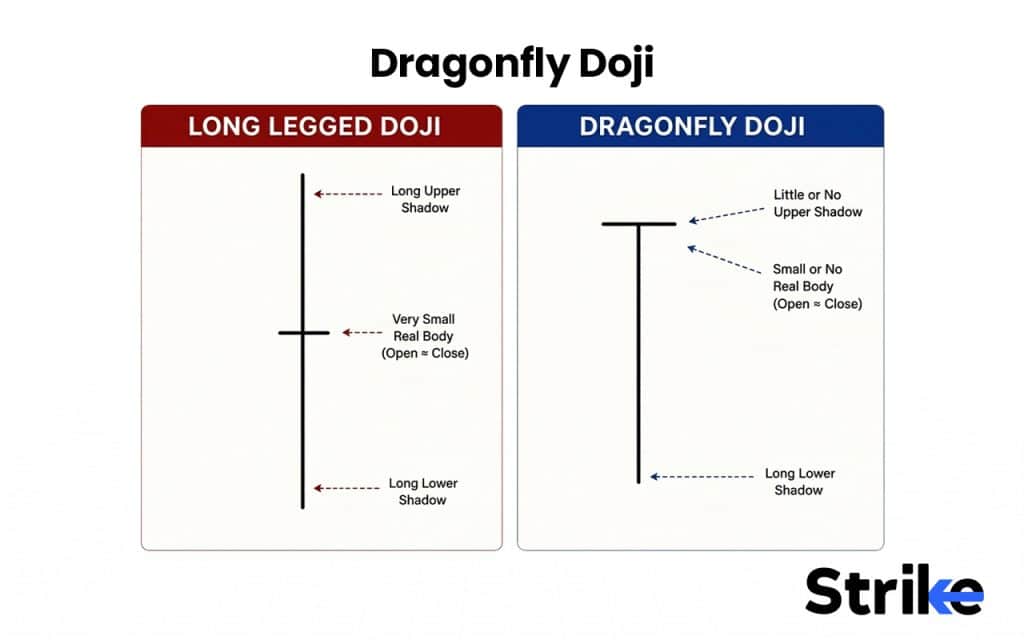
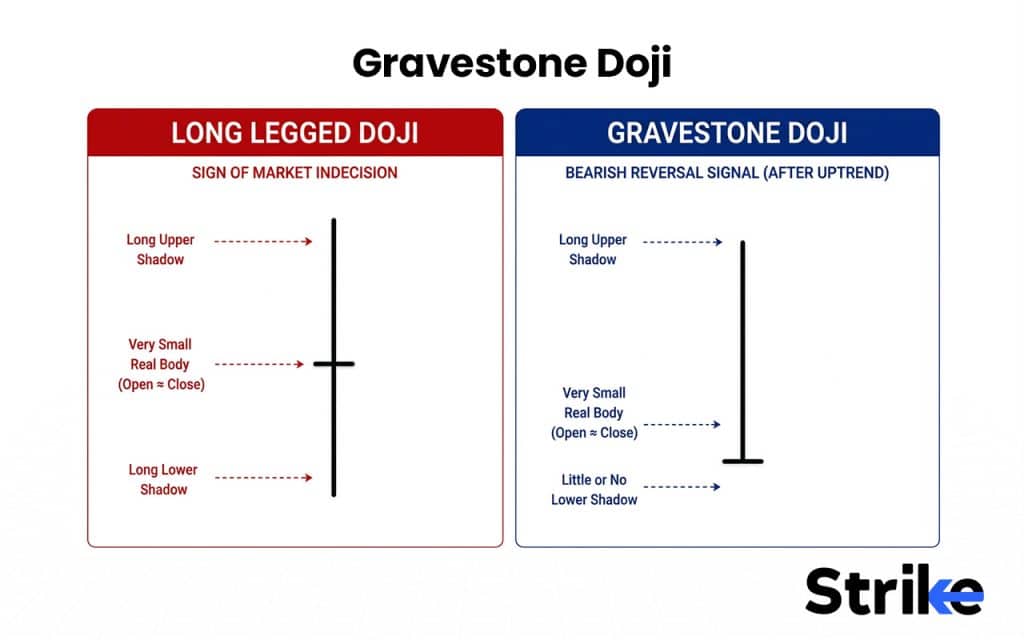
Unlike Long Legged and Neutral Doji, Dragonfly and Gravestone Doji have one side shadow longer than the other side reflecting a trend bias.
- Dragonfly Doji: It has a long lower shadow and little or no upper shadow with a small or no real body. This pattern reflects that the sellers were dominating initially but by the end of the session buyers took control, giving a bullish bias. The Dragonfly Doji indicates that buyers rejected lower prices, so you can consider the Dragonfly Doji as a bullish reversal signal if it forms after a downtrend. This pattern suggests that despite a sell-off during the session, the price returned to its opening level, signaling potential upward momentum.
- Gravestone Doji: It has a long upper shadow and little or no lower shadow with a small or no real body. This pattern reflects that the buyers were dominating initially but by the end of the session sellers took control, giving a bearish bias. Hence, you can consider it as a bearish reversal signal if formed after an uptrend.
Although dragonfly and gravestone Doji give trend bias signals, still you should not trade them in isolation. It is very important to wait for the next candle to close to confirm the pattern reversal.
3. Spinning Top & Rickshaw Man
These two patterns are very much similar to a Long Legged Doji pattern and often creates confusion amongst traders, specially beginners.
- Spinning Top: It has a long upper and lower shadow, just like Long Legged Doji, but instead of a small or no real body, the spinning top has a visibly thick real body. This visible thick real body signals a slight trend bias along with indecision
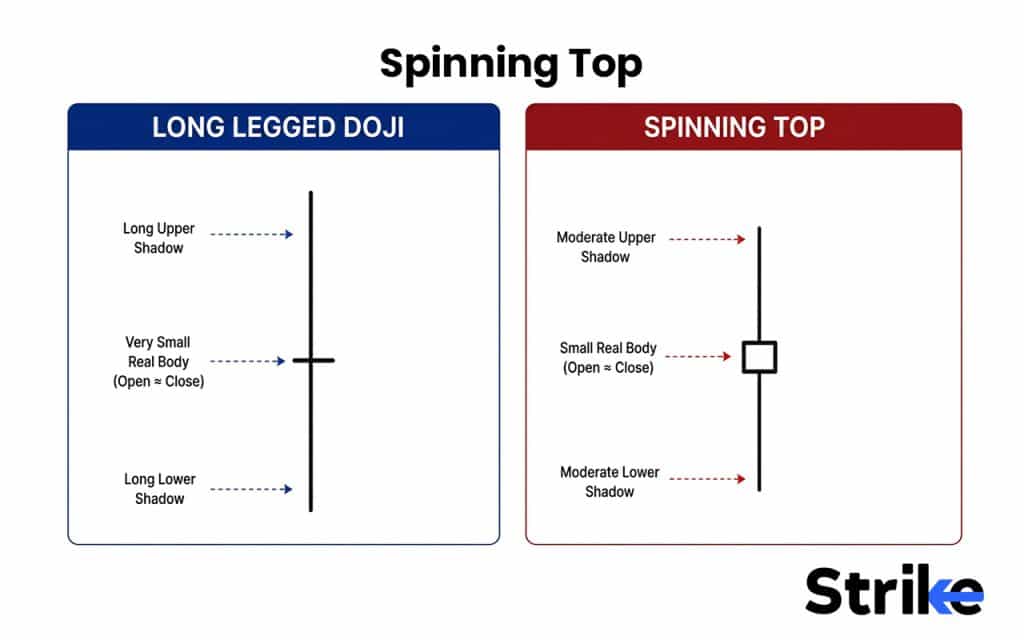
If the spinning top is green, it signals indecision but with a slight lean toward the buyer’s side. Similarly, if the spinning top formed is red, it signals indecision but with a slight lean toward the seller’s side.
Here, the confirmation candle still plays a major role here to confirm the spinning top bias.
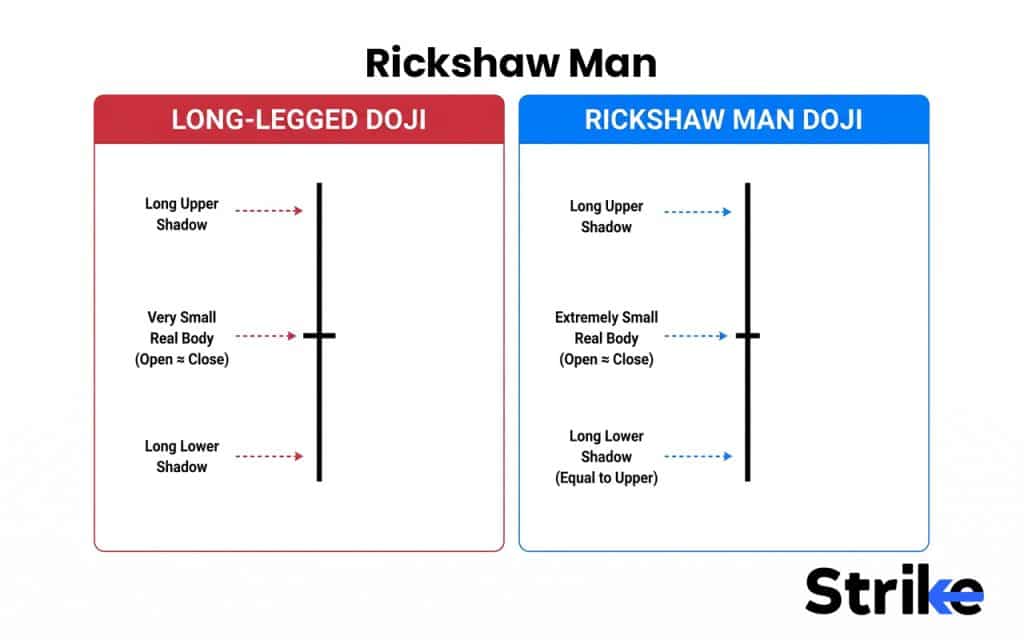
- Rickshaw Man: It is the symmetrical version of Long Legged Doji with identical upper and lower shadow and extremely small body positioned in the center. You can consider it as an even more extreme version of indecision than the standard Long Legged Doji, which often appears at major turning points.
4. Marubozu (The Opposite Candle)
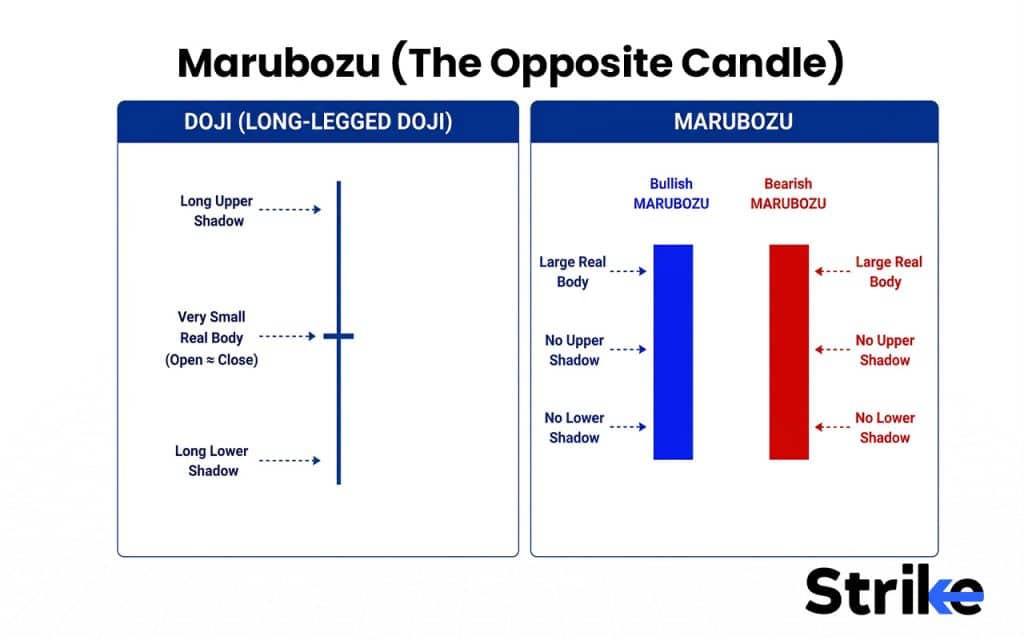
It is exactly the opposite of Doji candles and signals market conviction instead of market indecision. Instead of a small real body and long shadows, a Marubozu has a large real body with no upper or lower shadow. This lack of shadows in a Marubozu indicates that the market moved strongly in one direction from the open to the close.
| Summary table comparing all the above mentioned candlestick patterns | |||
| Pattern | Real Body | Shadows | Market Message |
| Long Legged Doji | Very small | Long on both sides | Strong indecision |
| Standard Doji | Very small | Short and balanced | Mild indecision |
| Dragonfly Doji | Very small | Long lower only | Potential bullish reversal |
| Gravestone Doji | Very small | Long upper only | Potential bearish reversal |
| Spinning Top | Small | Medium to long | Indecision with slight bias |
| Rickshaw Man | Very small | Very long and symmetrical | Extreme indecision |
| Marubozu | Large | Little or none | Strong bullish or bearish conviction |
Don’t identify a Long Legged Doji based only on its small body. The length and position of the shadows are equally important. A true Long Legged Doji has long upper and lower shadows, reflecting intense intraday volatility and a balanced struggle between buyers and sellers.
How to Trade the Long Legged Doji? [With Real Chart Example]
Long Legged Doji can be traded as a bullish signal or a bearish signal based on where it appears on the chart. There are five simple steps to trade Long Legged Doji which are briefly discussed below.
- Identify the Trend: The Long Legged Doji is only meaningful when it appears after a strong trending move. Therefore, first check whether the trend is bullish with consecutive green candles or bearish with a consecutive red candle.
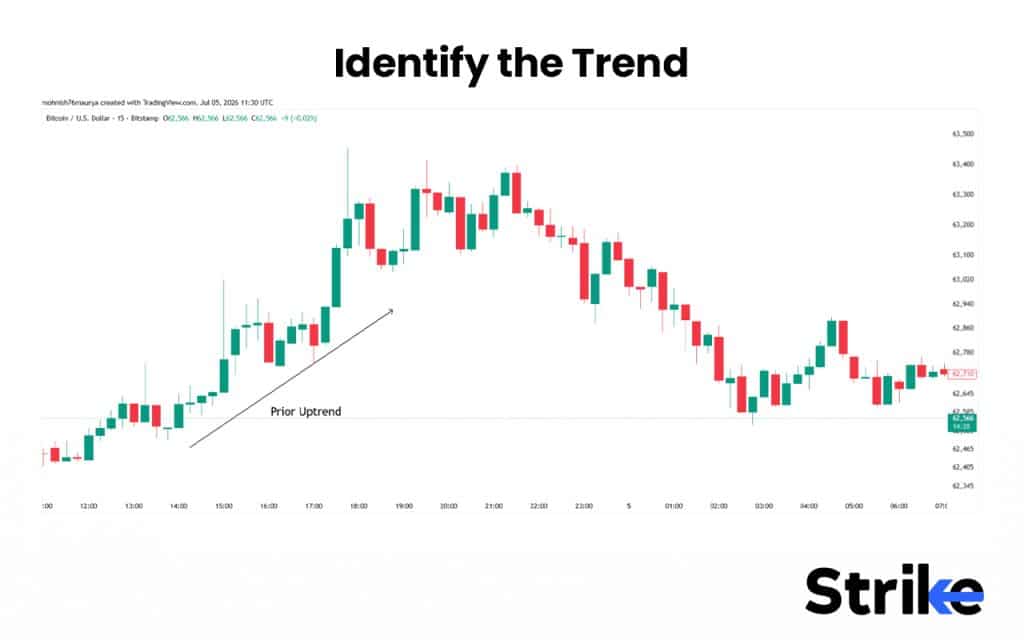
The above chart is a Bitcoinchart moving in an upward direction by making higher highs and higher lows.
- Identify the Long Legged Doji: Spot the Long Legged Doji with a small to no real body and long upper and lower shadow.
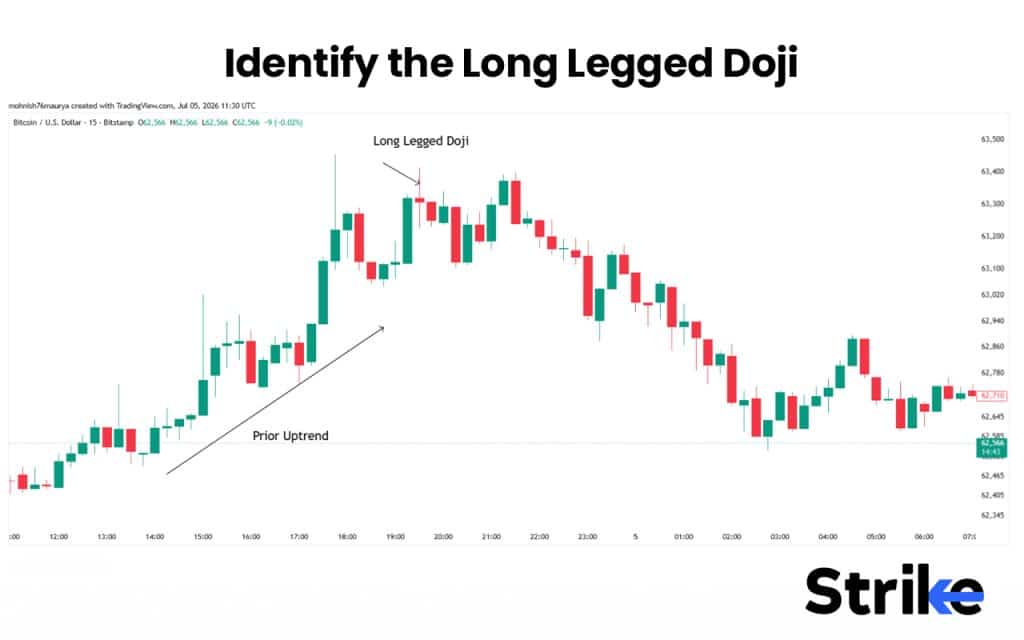
After a sustained upward move, price formed a Long Legged Doji near 63400 level, giving an sign of trend exhaustion, but we will only enter a trade when the confirmation candle closes below Long Legged Doji.
- Wait for Confirmation Candle: As Long Legged Doji is not a direct buy and signal, wait for the next candle to confirm the trend direction. If the Long Legged Doji appears at the end of the uptrend and the next candle (confirmation candle) closes below the low of the Doji, it confirms a bearish signal. Similarly, if the Long-Legged Doji appears after a downtrend and the next candle closes above the high of the Doji candle, it confirms the bullish signal.
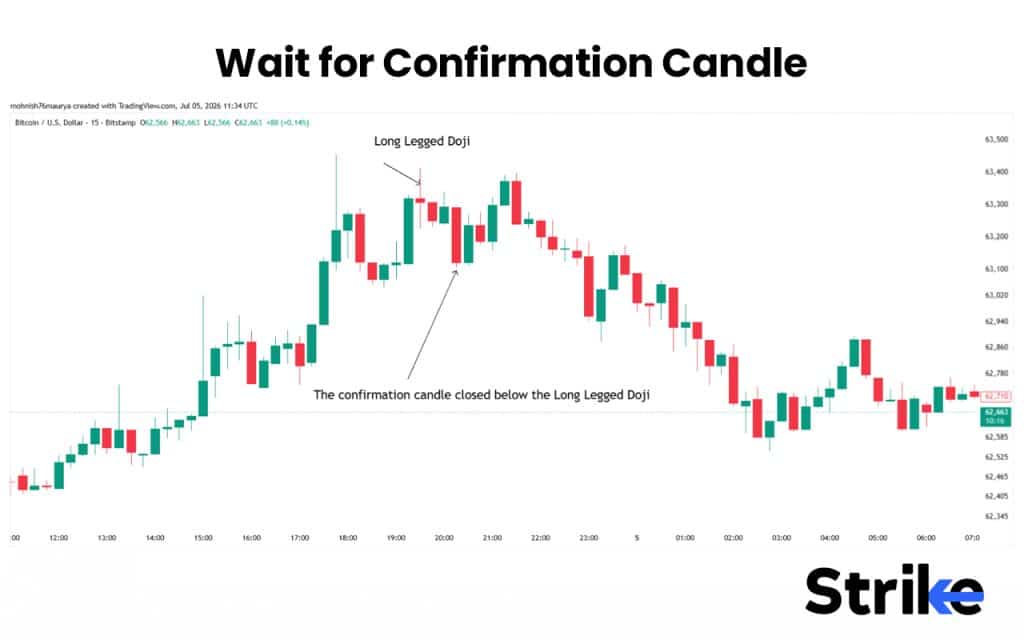
We entered a short position on Bitcoinafter a confirmation candle closed below Long Legged Doji.
- Execute the Trade: Enter long or short trade based on the confirmed signal with stop-loss above or below the Doji. Target for the next key level, prior swing point, or a fixed risk-reward multiple like 1:2 or 1:3.
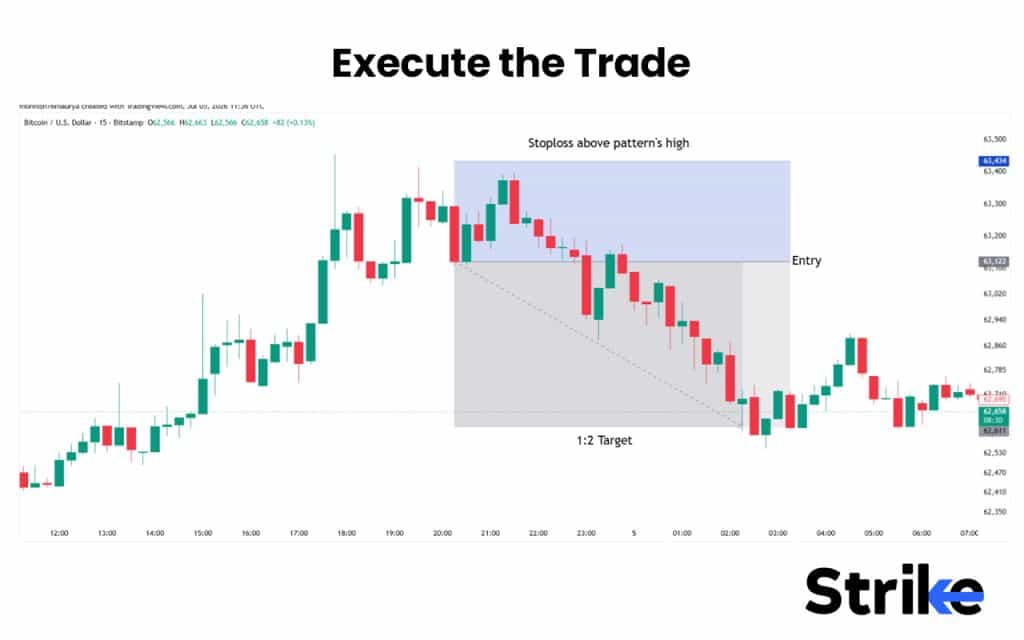
By following the above steps, you can also trade highly reliable long-legged Doji. Personally I like to trade long-legged Doji during market overbought or oversold conditions, like RSI above 70 or below 30. This increases the patterns reliability even further.
How to Confirm a Long Legged Doji Trading Setup?
You can confirm the Long Legged Doji using confirmation candle, volume, support/resistance, using technical indicators, and market structure. The more the confirmation signal aligns, the stronger and reliable the pattern gets.
- Confirmation Candle: If the next candle after Long Legged Doji closes above the high of the Doji, it confirms bullish momentum, whereas if the next candle closes below the low of the Long Legged Doji, it confirms the bearish momentum.
- Volume Confirmation: If both the candles, Long Legged Doji and confirmation candle forms with a good volume, it shows real conviction and strong participation. If the pattern confirmation is not supported by above average volume, the pattern might not be reliable to trade.
- Support and Resistance: If the Long Legged Doji appears at the key support or resistance level, the pattern becomes more reliable.
- Technical Indicator Confirmation: When technical indicator and pattern both point in the same direction, the setup confirmation increases. Technical indicators like RSI divergence or overbought/oversold condition and MACD bullish/bearish crossover increases the pattern reliability.
A Long Legged Doji is only the first step in a trading setup. The highest-probability trades occur when the pattern is followed by a confirmed breakout or breakdown, supported by volume, key price levels, and the overall market trend. The more confirmation signals that align, the stronger the setup.
How to Scan for Long Legged Doji Patterns?
You can scan for a Long Legged Doji pattern by using different software like strike money, charting, screener, Tradingview etc. This software automatically scans the Long Legged Doji based on predefined filters or custom conditions.
| Condition | Rule |
| Prior trend | Stock should preferably be in a strong uptrend or downtrend over the last 10–20 candles |
| Real body | Real body should be ≤ 5–10% of the candle’s total range (High − Low) |
| Upper shadow | Upper shadow should be ≥ 40–45% of the total candle range |
| Lower shadow | Lower shadow should be ≥ 40–45% of the total candle range |
| Body position | Open and Close should be nearly equal (difference ≤ 0.1–0.2% of the price or ≤10% of the candle range) |
| Total range | Total candle range should be greater than the 10- or 20-period average range (ATR or High-Low range) to indicate high volatility |
| Confirmation | Wait for the next candle to break above the High (bullish) or below the Low (bearish) of the Long-Legged Doji |
If a Long Legged Doji misses to match even the slightest rules, it will not get scanned in such software even though the pattern is genuine.
Can a Long Legged Doji Setup Fail?
Yes, a Long Legged Doji setup can fail because this pattern is just like other candlestick patterns and on top of that it only signals market indecision not a clear directional signal. Therefore if traded in isolation, it can give many false setups. To reduce the Long Legged Doji failure, avoid trading in range bound markets. Avoid trading without confirmation, low volume, trading against higher time frames and major news events.
However, trading Long Legged Doji with confirmation does not mean setup will perform 100%, it will just improve the likelihood of your winning. For instance, a bearish long-legged Doji in a strong uptrend might fail.
How Reliable is the Long Legged Doji Pattern?
Long Legged Doji is a moderately reliable pattern that to be when it is traded with a right market context, because Long Legged Doji is just a warning sign and has actionable meaning only when it aligns with right market context.
Although there aren’t many large-scale, universally agreed-upon backtests on this exact pattern, the data that does exist points the same direction. Thomas Bulkowski’s well-known candlestick research found it acts as a bullish continuation only 51% of the time, essentially a coin flip. Other studies on Doji patterns report similar numbers, around 48-52% on their own.
Our Backtesting Results with Long Legged Doji Pattern
At Strike Money, we manually backtested 100 Long Legged Doji patterns on NSE-listed large- and mid-cap stocks to evaluate how consistently the pattern identifies high-probability reversal opportunities. Since a Long Legged Doji is a neutral candlestick that reflects market indecision rather than a directional signal, we first tested the pattern using only a confirmed breakout or breakdown. The standard Long Legged Doji setup delivered a 56% win rate.
We then applied an additional filter by selecting only those setups where the confirmation candle was supported by above-average trading volume and the pattern formed near a major support or resistance level. During the Backtesting phase, although this reduced the number of qualifying trades, it significantly improved the quality of the setups. Further Backtesting confirmed that this approach increased the win rate to 68% by focusing only on the highest-probability signals.
Backtest Setup
| Backtest Parameter | Details |
| Pattern Tested | Standard Long Legged Doji Pattern |
| Market | NSE-listed large- and mid-cap stocks |
| Timeframe | Daily chart |
| Trade Direction | Bullish & Bearish |
| Bullish Entry Rule | Buy after the price closes above the Long Legged Doji high |
| Bearish Entry Rule | Sell after the price closes below the Long Legged Doji low |
| Alternative Entry | Enter on a pullback after the confirmed breakout or breakdown |
| Stop-Loss Rule | Opposite side of the Long Legged Doji |
| Target Rule | Minimum 1:2 risk-reward ratio or the next major support/resistance level |
| Risk Rule | Minimum 1:1.5 risk-reward ratio |
| Confirmation Used | Prior trend, confirmation candle, above-average volume, and nearby support/resistance |
| Avoided Setups | Sideways markets, low-volume patterns, and major news-driven candles |
Backtest Logic: The backtest followed the eight rules below:
- Identify a strong prior uptrend or downtrend.
- Confirm a valid Long Legged Doji with a very small real body and long upper and lower shadows.
- Prefer setups forming near a major support or resistance level.
- Wait for a confirmed breakout above the high or breakdown below the low of the Doji.
- Prefer confirmation candles supported by above-average trading volume.
- Place the stop-loss on the opposite side of the Long Legged Doji.
- Target the next key support/resistance level or maintain a minimum 1:2 risk-reward ratio.
- Exit early if a strong reversal signal forms against the trade.
Backtest Result Summary
| Metric | Standard Long Legged Doji | Long Legged Doji + Volume & S/R Filter |
| Total Patterns Tested | 100 | 53 |
| Winning Trades | 56 | 36 |
| Losing Trades | 44 | 17 |
| Win Rate | 56% | 68% |
| Average Risk-Reward | 1:1.8 | 1:2.2 |
| Average Winning Trade | 5.7% | 6.9% |
| Average Losing Trade | 3.3% | 3.1% |
Key Findings
- The standard Long Legged Doji pattern delivered a 56% win rate when traded only after a confirmed breakout or breakdown.
- Filtering setups using above-average volume and major support/resistance levels improved the win rate to 68%, while reducing the total number of trades from 100 to 53.
- Pullback entries after the breakout or breakdown generally produced a better reward-to-risk ratio than entering immediately on the confirmation candle.
- Long Legged Doji patterns that appeared after extended trends generated more reliable reversal signals than those forming during weak or choppy markets.
- The pattern produced the highest-quality trades when multiple confirmation factors aligned, whereas Doji candles forming inside sideways markets or on low volume frequently resulted in false breakouts.
What are the Best Timeframes & Markets to Trade Long Legged Doji?
Higher timeframes like daily or weekly are generally better to trade Long Legged Doji, because they produce less market noise and represent buying and selling activity over a broader time-period. On the other hand, Long Legged Doji also appears on lower time frames like 1-min, 3-min, or 5-min, but most of them are just random noise and therefore less reliable to trade.
| Timeframe | Reliability | Best Use |
| Weekly | Highest | Rare but high-conviction reversals; ideal for positional traders |
| Daily | Strong | Best overall timeframe for most traders |
| 4-Hour | Moderate to High | Good balance between quality and trade frequency |
| 1-Hour | Moderate | Usable with strong confirmation and volume filters |
| 15-Min & Below | Weak | Mostly market noise; avoid trading the pattern alone |
If you are a beginner, a daily time frame will be best for you to trade Long Legged Doji, because it filters out most of the noise and gives you enough time to plan your trade.
Does Candle Colour Matter in a Long Legged Doji?
Candle colour in Long Legged Doji does not really matter, what matters the most is the shadow length and the size of the real body. If the Long Legged Doji has a small green body, it means that the buyers gained control by the end of the session, but the decision is still unclear. Similarly, If the Long Legged Doji has a small red body, it means that the sellers gained control by the end of the session, but the decision is still unclear.
Where Is a Long Legged Doji Strongest – and Where Is It Invalid?
The Long Legged Doji becomes strongest when it appears after a strong uptrend or downtrend, near major support or resistance, and near trendlines or key moving averages. However, when it appears inside a sideways market, stocks with low volume and liquidity, no confirmation, or during high impact news, the pattern is then more likely to get invalid and fail.
I have noticed, the long-legged Doji performs best and has a high win rate when it appears after 5-6 consecutive green or red candles.
Common Mistakes to Avoid While Trading Long Legged Doji
There are five common mistakes a trader should avoid while trading a Long Legged Doji. The mistakes are discussed below.
- Trading Without Confirmation: Avoid entering a trade immediately after the Long Legged Doji forms. Even if it forms near key levels, wait for a confirmation candle to confirm the actual shift in power.
- Ignoring the Prevailing Trend: A reliable Long Legged Doji pattern only appears after a strong trend. Hence always look for prior trends first.
- Trading in Sideways Markets: Long Legged Doji formed in the sideways market is nothing more than a noise, because the pattern itself is non decisive, and when it appears in a non decisive market, it makes no sense to trade them.
- Overlooking Volume: If volume does not support the pattern, even if it is a conformed one, it shows lack of conviction. Whenever possible, look for increased trading volume on the confirmation candle.
- Using a Tight Stop-Loss: Give 0.4% – 0.5% of buffer zone while placing the stoploss to avoid getting stopped out by normal market fluctuations.
One major mistake I used to make is entering immediately after Long Legged Doji pattern forms along with RSI overbought and oversold condition. I used to think the price would definitely reverse because it’s a Long Legged Doji formation that to be with RSI overbought or oversold condition. But most of the time I was getting stopped out. That’s why never trade with anticipation, trade with confirmation.
Long Legged Doji Inside Bigger Patterns (Star, Tri-Star, Harami Cross)
Long Legged Doji is primarily a single candlestick pattern, but it also contributes as a key building block for popular complex reversal candlestick patterns like Doji Star, Tri Star, and Harami Star. Once Long Legged Doji becomes a part of these three-candlestick reversal patterns its significance increases.
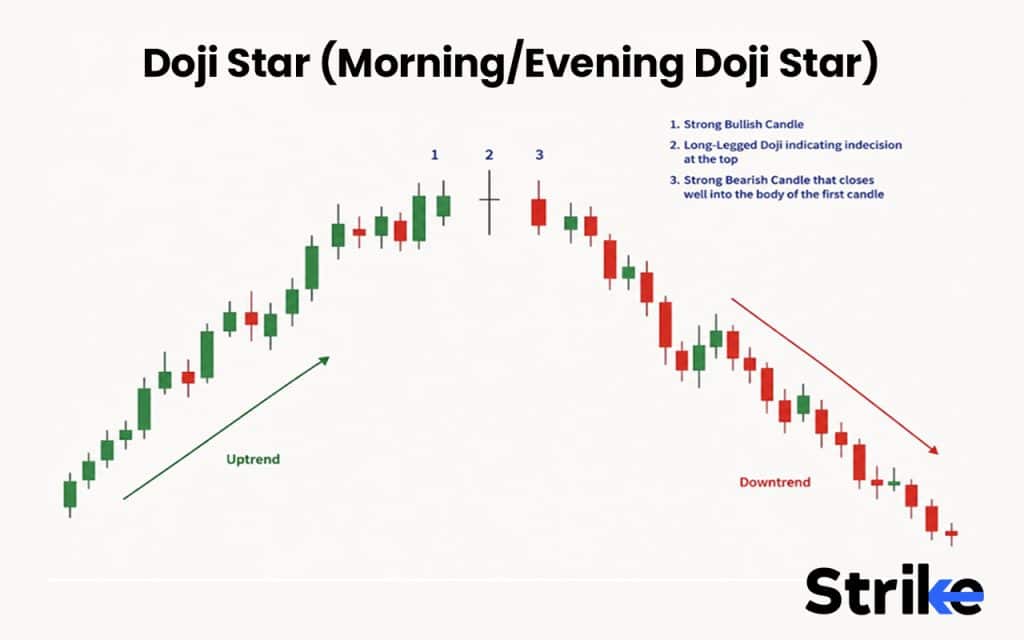
- Doji Star (Morning/Evening Doji Star): In Doji star, Long Legged Doji candle forming as a middle candle showing the transition of sentiment. In a Morning Doji Star, the presence of a Long Legged Doji signals a shift in sentiment from bearish to bullish. Similarly, in an Evening Doji Star, the Long Legged Doji indicates a shift in momentum from bullish to bearish, highlighting a period of intense market indecision.
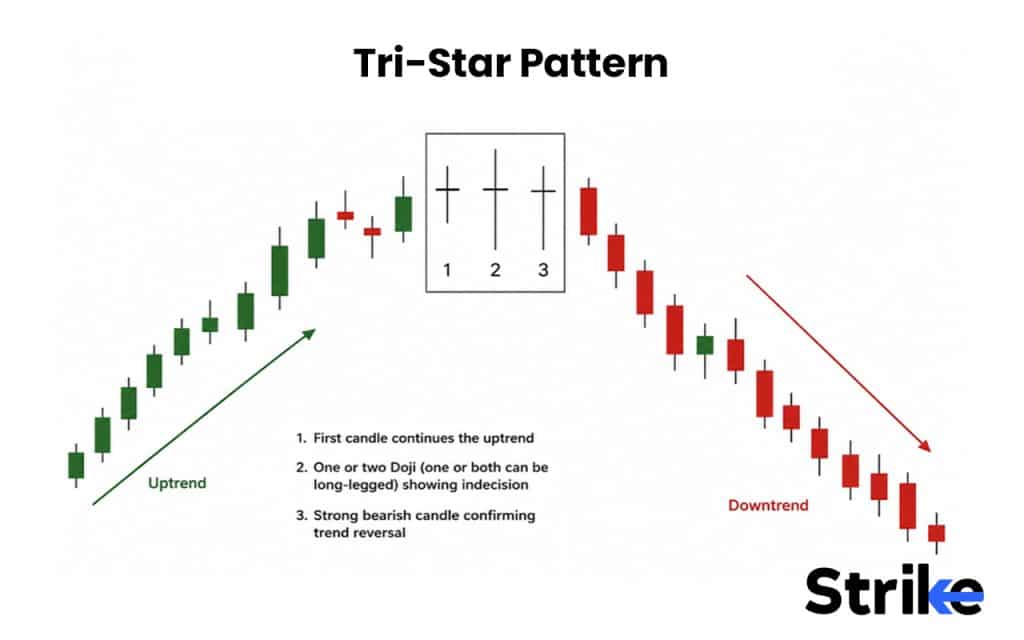
- Tri-Star Pattern: It is one of the rarest reversal patterns where three consecutive Doji candles appear. If one or more Long Legged Doji appears in a Tri star pattern, it signals prolonged indecision between buyers and sellers. The presence of these indecisive candles within the Tri star formation suggests that a major trend reversal may be imminent as market participants struggle for control.
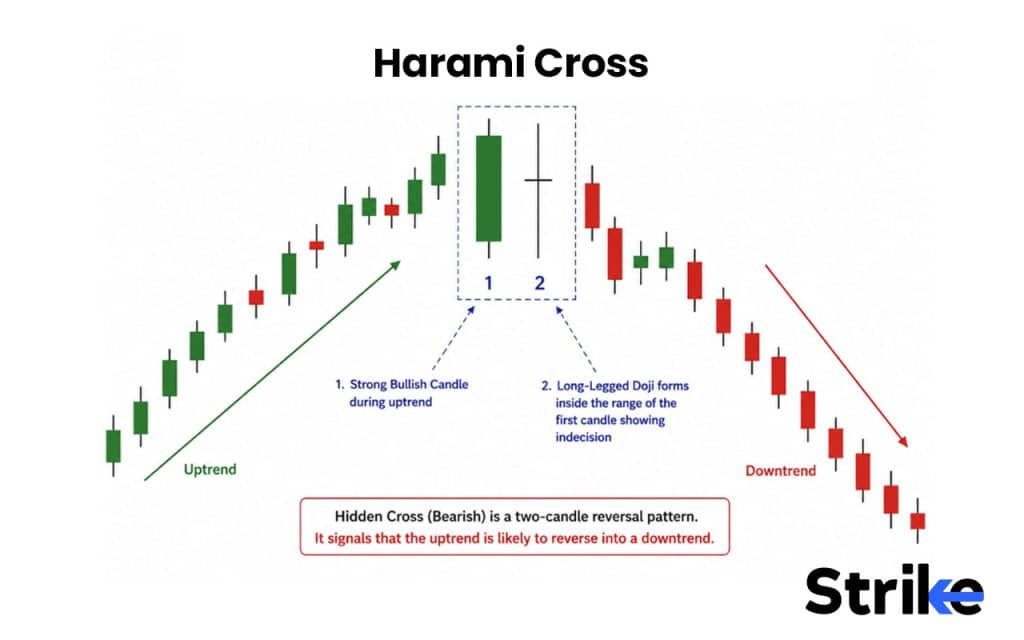
- Harami Cross: Long Legged Doji appears inside the range of the mother candle. If Appears after downtrend, it signals fading selling momentum and if appears after an uptrend, it signals fading buying momentum.

 5 mins