A Doji star is one of the most important candlestick signals in technical analysis. The doji star highlights strong indecision in the market and often acts as a turning point when supported by context.
Traders watch for doji stars because they reflect a balance between buyers and sellers. Unlike directional candles, a doji closes almost at the same price where it opened, showing hesitation.
What is a Doji star?
A Doji star is a candlestick with almost equal open and close prices, forming a small or no real body. A Doji star usually has long upper or lower shadows, indicating both buying and selling activity within the session.

The word “Doji” originates from Japanese, meaning “blunder,” referring to the rare case where open and close prices match. A doji star forms when market forces cancel each other, leaving a candle with no clear winner.
Traders interpret doji stars as pause points. They alone do not indicate a buy or sell signal but become powerful when appearing near resistance, support, or after strong trends.
For instance, a doji at the top of an uptrend signals fading buying power, while one at the bottom of a downtrend shows sellers losing control.
How does Doji star Candlestick Pattern Formed?
A Doji star forms when the market’s opening and closing prices are nearly identical, leaving behind a candle with a very small or no body. The shadows or wicks on either side represent attempts by buyers and sellers to dominate, but neither group secures control. The result is a balance between opposing forces, and the candle reflects uncertainty in market direction.
The psychology behind the Doji star is indecision. During the trading session, buyers try to push price higher, and sellers attempt to push it lower. Neither side succeeds, and the market closes around the same level it opened. This neutrality highlights hesitation, where traders are unwilling to commit fully in either direction.
Different Doji variations reflect different types of rejection. In a bullish context, a Dragonfly Doji forms when sellers manage to drag prices lower, but buyers step in with strength and push the close back to the open. This shows buyers are willing to absorb supply and defend the level. In a bearish context, a Gravestone Doji appears when buyers push the market up, but sellers overpower them and return the close to the opening level, signalling resistance at higher prices.
The significance of a Doji increases with its location on the chart. A Doji at the top of an extended rally often points to exhaustion of buying pressure and potential reversal. When a Doji forms at the bottom of a decline, it suggests that sellers are losing steam and that selling pressure is weakening. In sideways markets, a Doji often reinforces ongoing indecision.
Volume plays an important role in confirming the weight of a Doji star. A Doji with high volume suggests a serious battle between buyers and sellers, which strengthens its signal. A Doji with very low volume carries less meaning and often signals quiet trading.
When do Doji star Candlestick Patterns occur?
Doji stars occur most effectively after extended trends or at key support and resistance levels. Their appearance signals a pause and often precedes reversals or consolidations.
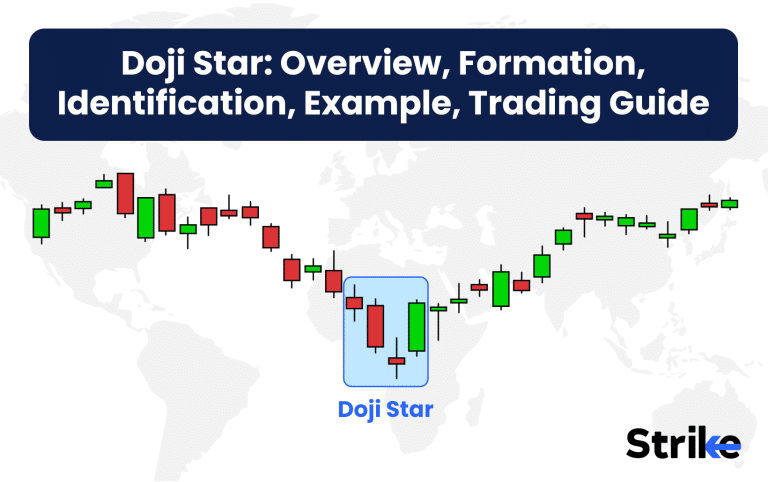
Below is an example chart showing a Doji Star after an extended uptrend at resistance, which signals hesitation and often precedes a reversal or consolidation

On higher timeframes like daily and weekly charts, doji stars are more reliable. A research note from Nison Candlestick Forum found that reversal doji setups on weekly charts had a 60% higher success rate compared to intraday timeframes.
Doji stars often appear after sharp rallies where buyers start to lose momentum. In this case, the doji signals exhaustion of the trend. Similarly, at the end of a sell-off, the doji shows that sellers are unable to push prices lower.
Intraday traders also see doji stars during low-volume consolidations, but those signals are less reliable due to noise. Long-term traders rely on daily and weekly candlestick pattern formations for strong signals.
For example, during corporate earnings releases or global events, doji stars often form as investors weigh new information. These moments of hesitation reflect collective indecision before the next directional move.
How to Identify a Doji Star
A Doji star is identified by its tiny or non-existent body and wicks extending from both sides. The open and close prices remain almost equal, which makes the Doji different from most other types of candlesticks. Unlike a bullish or bearish candle with a noticeable body, the Doji shows balance between buyers and sellers within that session.
The first step to identify a Doji star is to check the previous trend. A Doji that appears after a strong uptrend or downtrend carries greater importance than one that forms in sideways action. After an extended rally, a Doji signals hesitation among buyers. After a prolonged decline, it suggests that sellers are losing conviction. This context decides whether the Doji is likely to mark reversal or continuation.

The next step is to observe the candle structure. The real body of the Doji should be extremely small, ideally less than 5% of the total candle range. The wicks on either side carry the message of market rejection. A long upper wick shows rejection of higher prices, while a long lower wick shows rejection of lower prices. A Doji with long wicks on both ends signals strong indecision.
Confirmation is the deciding factor when reading a Doji star. Without follow-up price action, a Doji remains a candle of hesitation. Traders confirm the signal using support and resistance levels, RSI divergence, or moving averages. A bullish confirmation occurs when the Doji is followed by a strong green candle, while a bearish confirmation occurs when a red candle appears after the Doji.
What Does a Doji Star Pattern Indicate?
A Doji star pattern indicates indecision in the market and often signals a possible reversal or pause in the existing trend. Since the open and close prices are nearly identical, the candle shows that buyers and sellers battled during the session but neither side gained control.
In an uptrend, a Doji star signals buyer hesitation. When price rallies strongly and then forms a Doji, it means that buyers are no longer pushing price higher with conviction. This hesitation often precedes a reversal, where sellers step in, or a consolidation phase where the market pauses before deciding the next move.
In a downtrend, a Doji star signals that selling pressure is weakening. When prices drop for several sessions but then print a Doji, it shows that sellers are unable to keep momentum. This increases the chance of reversal upward if buyers confirm strength in the following sessions.
Confirmation is critical. A Doji alone is not enough for trade entry. Traders wait for the next candle: a strong bullish candle confirms reversal to the upside, while a bearish candle confirms downside continuation. Indicators like RSI, volume spikes, and moving averages are also used to validate the signal.
Example of Doji star
A real example of a Doji star appeared in Infosys stock in April 2023. After a strong rally, Infosys touched resistance near Rs. 1,500 and formed a gravestone doji. The candle opened at Rs. 1,495, went as high as Rs. 1,520, but closed back near Rs. 1,496. This rejection of higher prices showed selling pressure emerging at resistance.

The gravestone doji at this crucial resistance level highlighted a market hesitation point. Traders observing the pattern interpreted it as the first sign of fading buying strength. The fact that the close remained near the session’s low reinforced the bearish sentiment. As a result, informed traders anticipated a short-term pullback and prepared their strategies accordingly.
Following this doji, Infosys stock dropped nearly 5% over the next 10 sessions. This decline confirmed the signal’s reliability and demonstrated how a doji star, when combined with market context, offers an actionable trading edge. Traders who also checked momentum indicators such as the RSI noticed further weakness. The RSI had already begun trending lower, confirming exhaustion in the bullish move.
This case study underscores the importance of interpreting candlestick signals within the larger structure. The gravestone doji at Rs. 1,500 did not act as a standalone trigger but became powerful once aligned with resistance levels and momentum indicators. For short-term traders, this setup offered an excellent opportunity to enter a high-probability trade with clear entry, stop loss, and target zones.
How Reliable are Doji star Candlestick Patterns?
Doji stars are moderately reliable, with success rates improving when combined with confirmation signals. Alone, they reflect indecision, but context gives them trading value.
Thomas Bulkowski’s research shows that doji stars in reversal setups succeed about 51%–55% of the time. Reliability increases to nearly 60% when they occur on weekly charts at support or resistance zones.
Doji stars are less reliable in sideways or choppy markets. In such environments, frequent indecision candles create false alarms. However, in trending conditions, their appearance often signals strong turning points.
Reliability also depends on volume. A doji star with high trading volume is stronger than one on low volume. Similarly, confirmation from subsequent candles boosts credibility.
For example, a dragonfly doji at NIFTY 18,000 support, confirmed by a bullish engulfing candle, offers much higher probability than the doji alone.
Thus, while doji stars are not perfect, their reliability improves significantly with context, timeframe, and additional confirmations.
How to Trade Using the Doji star Pattern
Trading a Doji star involves six steps: identification, confirmation, entry, stop loss, target, and risk management. This structured method helps reduce emotional trading.
Identification is the first step when trading a Doji star. A true doji star occurs when the opening and closing prices are nearly equal, leaving the candle with a very small body. The wicks can be long, indicating both buying and selling activity during the session. Confirmation is the second step. A doji star on its own reflects hesitation, but the direction becomes clearer once the next candle closes strongly in one direction.
For example, Infosys stock at Rs. 1,500 formed a gravestone doji in April 2023. The next day, the candle closed bearish, confirming the weakness suggested by the doji. This sequence gave traders confidence that the price was likely to decline after failing to break resistance.

Entry is the third step. Traders entered short positions near Rs. 1,490 after the confirmation candle closed lower. Stop loss is the fourth step. It was placed just above the doji wick high at Rs. 1,520. Target is the fifth step. A realistic level at Rs. 1,420 was chosen, creating a reward of 70 points against a risk of 30 points. This setup offered a risk–reward ratio close to 1:2, which is favorable in professional trading.

Risk management is the sixth and final step. Exposure was limited to less than 2% of account size to ensure survival even if the trade failed. As the trade moved in favor, traders trailed their stops to lock profits. Partial exits at interim support levels allowed them to capture gains while still leaving a portion of the position active.
Following this structured approach allows traders to avoid emotional decisions and rely on a rules-based plan. The Infosys gravestone doji example proves how step-by-step trading transforms a simple candlestick into a complete strategy.
How to Combine Doji star with other Technical Indicators?
Doji stars work better when combined with volume, RSI, moving averages, and support/resistance. These tools validate the signal and filter noise.
| Indicator | Condition with Doji Star | Interpretation | Trading Implication |
| Volume | High-volume Doji vs. Low-volume Doji | High volume shows an intense fight between buyers and sellers, giving the signal weight. Low volume indicates lack of participation, making the signal weaker. | Stronger conviction in reversal or pause when Doji forms on high volume. Avoid weak, low-volume Dojis. |
| RSI (Relative Strength Index) | Overbought RSI + Gravestone Doji; Oversold RSI + Dragonfly Doji | Overbought RSI near 70 with Gravestone Doji shows exhaustion of buyers and reversal potential. Oversold RSI near 30 with Dragonfly Doji shows sellers weakening and buyers stepping in. | Align Doji with RSI extremes to filter strong setups. Take reversal trades with confirmation. |
| Moving Averages (MA) | Doji near 50-day or 200-day MA | Pinpoints institutional levels. Dojis forming near these averages suggest strong defense or rejection by large players. | Use the MA as dynamic support/resistance. Trade in alignment with trend bias shown by the MA. |
| Support & Resistance | Doji forming at a horizontal support/resistance zone | Location is key. A Doji at a critical level indicates hesitation where supply and demand pressure meet. | Strong reversal potential when Doji aligns with established support or resistance. Skip mid-trend Dojis. |
By combining doji stars with these confirmations, traders reduce false signals and increase accuracy of entries.
What are the Pros vs Cons of Using Doji star?
Doji stars offer clarity in spotting market hesitation, but they require confirmation to be useful. Their neutrality makes them powerful warning signs, yet risky if traded blindly.
| Pros | Explanation | Cons | Explanation |
| Simple to recognize visually | The Doji star has a distinct look with a very small body and clear wicks, making it easy to spot even for beginner traders. | On their own, they lack directional bias | A Doji shows indecision, not direction. Without confirmation, it is unclear whether the market will reverse upward or downward. |
| Work across all asset classes | Doji stars appear in stocks, forex, commodities, cryptocurrencies, and indices, making them a universal candlestick tool. | High frequency leads to false signals | Because Dojis occur often, many of them are random noise and not meaningful. Filtering is required to avoid false trades. |
| Indicate critical turning points | When placed after a strong rally or decline, a Doji star signals exhaustion of momentum and potential reversal at key levels. | Less reliable in sideways markets | In consolidating or choppy markets, Dojis are common but rarely lead to major moves, reducing their reliability. |
| Pair well with RSI, MA, and volume | Combining Dojis with indicators like Relative Strength Index, Moving Averages, or volume strengthens the accuracy of signals. | Require confirmation from next candle | The Doji itself only shows hesitation. Traders must wait for the following candle to confirm direction before acting. |
| Provide early alert to potential reversals | A Doji star acts as an advance warning that the current trend is losing strength, giving traders time to prepare setups. | Moderate standalone success rate (≈55%) | Studies show Dojis alone succeed slightly more than half the time, which is not enough for consistent profitability without context. |
Traders who treat doji stars as alerts rather than direct buy/sell signals benefit most. They work best as part of a multi-tool trading system.


 Previous Article


![15 Investing.com Alternatives [Free+Paid] You Should Use in 2026](https://www.strike.money/wp-content/uploads/2026/04/Investing.com-Alternatives.jpg "15 Investing.com Alternatives [Free+Paid] You Should Use in 2026 28")
![15 TradeStation Alternatives [Free+Paid] You Should Use in 2026](https://www.strike.money/wp-content/uploads/2026/04/TradeStation-Alternatives.jpg "15 TradeStation Alternatives [Free+Paid] You Should Use in 2026 29")
![15 Chartink Alternatives [Free+Paid] You Should Use in 2026](https://www.strike.money/wp-content/uploads/2026/04/Chartlink-Alternatives.jpg "15 Chartink Alternatives [Free+Paid] You Should Use in 2026 30")
: Overview, 10 Types of Indicators, Settings for Different Markets 32")

 : Definition, Formula, calculation, Uses, Advantages Vs limitations 34")


No Comments Yet.