Backtest Your Trading Strategy: How to Set Up, Tools, Biases & When to Believe It


 Author

 Editor
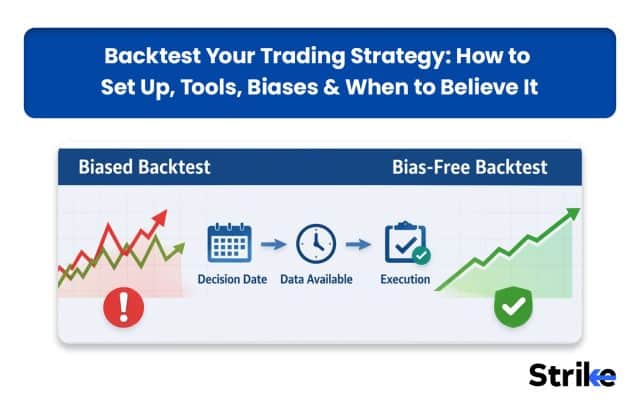
Backtesting is one of the crucial steps in trading irrespective of your trading style. Backtesting helps you to distinguish between a good trading setup and a bad trading setup, eventually saving you from unnecessary losses. It does so by revealing a win rate, average profit and loss, drawdown, losing streaks and performance of a given strategy across different market conditions.
However, a profitable backtest is not guaranteed to work in the market. Poor-quality data, overfitting, look-ahead bias, unrealistic trade execution, and ignoring trading costs are few major reasons for it. In this blog, you will learn about how to backtest a trading strategy through the right tools and data, how to improve your strategy and how to move forward to deploy it in a market.
What Is Backtesting?
Backtesting is the process of testing a trading strategy on historical price data to understand the performance of the strategy before running it in real time. However, many beginners misunderstand what backtesting actually means. They think “I found 100 same chart patterns, and 60 worked. My strategy has a 60% win rate.”But that is only a small part of backtesting.
Apart from this, you should also know how much you win, how much you lose when you are wrong, your drawdowns, and whether the strategy is still profitable after costs and slippage.
Why You Should Start Backtesting Your Trading Strategies?
There are five main reasons why you should start backtesting your strategies. These reasons are briefly discussed below.
- Measure the edge: To check whether the strategy is actually profitable over a meaningful sample?
- Understand risk: To check the maximum loss or drawdown you can face using your strategy.
- Estimate realistic returns: You can calculate the actual return after brokerage, STT and slippage.
- Test different markets: Backtest will tell you where your strategy performs best. Is it a bull market, bear market, or sideways market?
- Improve the rules: Once you understand your strategy working through backtesting, you can make changes to improve it.
Suppose you have a strategy that delivers a 55% win rate, which is impressive. However, after you did a backtesting, you realized that even though the win rate is 55%, the average loss is twice the size of profit.
How to Setup a Backtesting Environment for Trading Strategies?
A backtesting environment is a pipeline, not a single tool. To backtest a trading strategy, define your rules, collect historical data, choose a testing method, run the strategy on historical data, include trading costs and slippage, check for biases, and validate the results on unseen data.
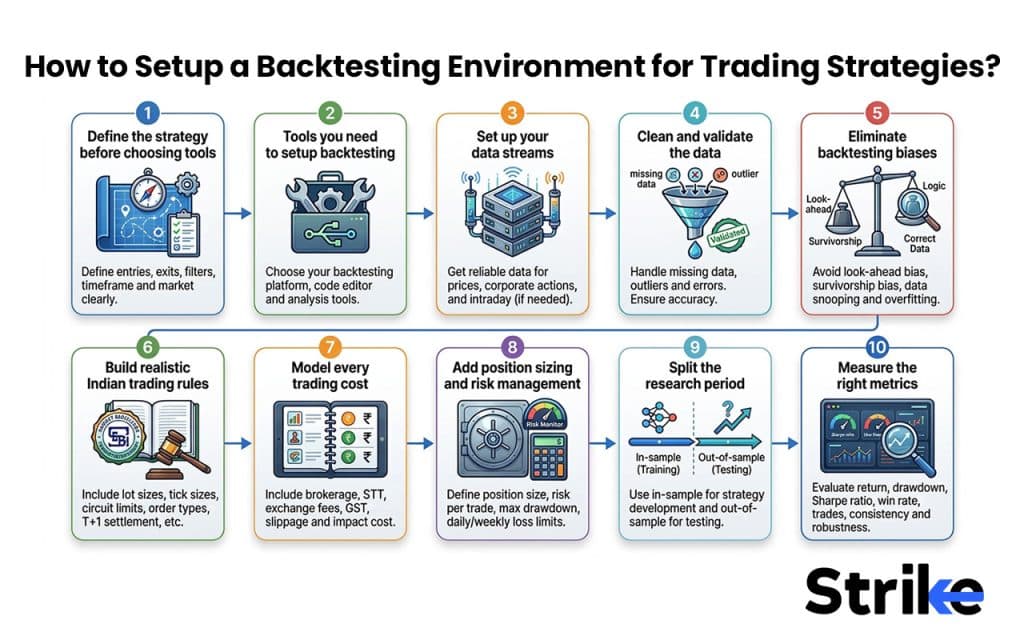
1. Define the strategy before choosing tools
Start by writing down exactly what you want to test. Following are the points that you should decide before opening any software for backtesting.
- Entry condition: Exact indicator values, price action, or option Greek thresholds based on which you are planning to enter a trade.
- Exit condition: Your target , stop-loss, time-based exit, or trailing rule.
- Universe: The exact stocks/index, which expiry (weekly/monthly), which strikes (ATM, OTM by how many points, delta-based selection)
- Timeframe and holding period: 5-Minute, Hourly, Daily, etc. The timeframe determines how frequently your strategy looks for signals.
- Position size and max concurrent positions: How many lots/shares per trade, and a cap on simultaneous open positions
If you can not write your strategy rules clearly. It means your setup is not precise enough for other people to code and backtest it. Given below is a template for your reference.
| Rule | Example |
| Market | Nifty 50 stocks |
| Timeframe | Daily |
| Entry | RSI crosses above 50 |
| Stop-loss | Previous candle low |
| Target | 2:1 risk-reward |
| Position size | 10% capital per trade |
| Exit | Target, stop-loss or time exit |
2. Choose the Right Tools
Since you have now decided your entry and exit criteria, it’s time to select the method or a tool for backtesting. There are three broader methods to backtest for strategy backtesting which are briefly discussed below.
| Backtesting Approach | Recommended Tools | Best For | Key Limitation |
| Manual Backtesting | TradingView, Excel, Google Sheets | Testing discretionary, price-action, and simple rule-based strategies | Slow and time-consuming for large datasets |
| Semi-Automated Backtesting | TradingView with Pine Script, AmiBroker, MetaTrader | Rule-based strategies that can be partially or fully automated | Requires platform and scripting knowledge |
| Fully Automated / Quantitative | Python (pandas, backtrader, vectorbt) | Large datasets, complex logic, portfolio-level testing, and advanced analysis | Requires coding and technical knowledge |
As you have three methods to backtest, but which one to pick?
- Pick manual backtesting if you are a beginner or your strategy is based on price action where rules are partly discretionary.
- Pick a non-coding platform if your rules are clearly defined, you don’t know python but want a fast result.
- Pick python when need customization, need to test thousands of trades.
Python could be the best option for backtesting if you eventually plan to make your strategy live in the market, because it will directly connect with brokers API and will reduce your time to repeat the logic again.
3. Set Up Reliable Data Streams
The data requirement totally depends on what strategy you are testing. Whether its technical, derivatives, fundamental or macro/quantitative trading strategy.
| Strategy Category | Data Required | Data Sources |
| Technical | Historical OHLCV price and volume data | Exchange data feeds (NSE/BSE), broker APIs, data vendors (e.g., Global Datafeeds, Truedata) |
| Derivatives | Underlying price, futures/options prices, open interest (OI), implied volatility (IV), option Greeks, expiry and strike data | NSE historical F&O data, broker/vendor options-chain archives |
| Fundamental | Financial statements (P&L, balance sheet, cash flow), earnings results, valuation ratios, corporate actions | Company filings/exchange disclosures, Screener.in, Ace Equity, Capitaline |
| Macro / Quantitative | Interest rates, inflation, currency (USD-INR), commodity prices, cross-asset correlations, multi-market datasets | RBI, MOSPI, exchange data, Bloomberg/Refinitiv (if accessible) |
However, you can not use this data directly. You need to clean and validate the data before you start any action. Pay attention to how far back the data goes and whether it covers multiple market regimes (bull, bear, sideways) a dataset covering only a strong uptrend will not reveal how a strategy behaves in a correction.
5. Clean and Validate the Data
Before you use the data for backtesting, make sure to adjust the stock price for incorrect stock split, corporate actions, or any duplicate entries.
- Missing prices: Gaps caused by holidays, halts, or data provider errors can distort the return calculation if not adjusted.
- Duplicate entries: Repeated rows that artificially inflate volume or skew averages.
- Incorrect stock split/bonus adjustments: An unadjusted stock split or bonus can show extreme price gap and can trigger false signals.
- Corporate actions: Dividends, mergers, and delisting breaks or alters the historical continuity in stock price.
If possible, manually check a small portion of data with another data source or spot chart itself to reduce the chance of error.
6. Eliminate Backtesting Biases
Make sure your strategy does not accidentally use information that would not have been available at the time of the trade.
- Survivorship bias: Only testing the stocks that are available in the index and ignoring companies that were delisted, merged, or removed.
- Overfitting: Tuning strategies parameter too much just to improve win rate. However, this setup usually fails in live market because you forcibly fitted the strategy in past price data.
These biases rarely show up as an obvious red flag in the results; a backtest riddled with look-ahead bias can still appear smooth and consistently profitable, which is exactly what makes it dangerous.
7. Build Realistic Indian Market Rules
Encode the operational constraints of Indian markets directly into the backtest logic:
- Market timings: 9:15 AM to 3:30 PM for equities; ensure intraday strategies cannot enter or exit outside this window.
- Settlement rules: T+1 settlement cycles for equities, and how this affects strategies holding positions across days.
- Lot sizes: F&O contracts trade in fixed lot sizes, not arbitrary share quantities — position sizing must respect this.
- Margin requirements: SPAN and exposure margins for F&O positions, which affect how much capital a trade genuinely ties up.
- Circuit limits: Upper/Lower price bands that can prevent an order from being filled at the intended stop-loss or target level.
- Order execution rules: Whether the strategy assumes market orders, limit orders, or stop orders, each of which fills differently in fast-moving conditions.
Skipping these constraints tends to produce a backtest that performs well on paper but does not correspond to a trade sequence that was actually executable in real market conditions.
8. Model Every Trading Cost
Apply all applicable costs to every simulated trade, not just an average estimate
| Cost | Equity Delivery | Equity Intraday | Futures | Options |
| Brokerage | Depends on broker | Depends on broker | Depends on broker | Depends on broker |
| STT | 0.1% buy + 0.1% sell | 0.025% on sell | 0.05% on sell | 0.15% on sell premium |
| Exchange transaction charges (NSE) | ~0.00307% | ~0.00307% | ~0.00183% | ~0.03552% of premium |
| GST | 18% on brokerage + exchange charges + SEBI charges | Same | Same | Same |
| Stamp duty | 0.015% on buy | 0.003% on buy | 0.002% on buy | 0.003% on buy |
| SEBI turnover fee | ₹10/crore | ₹10/crore | ₹10/crore | ₹10/crore |
| Slippage | Depends on liquidity | Depends on liquidity | Depends on liquidity | Depends on liquidity |
Run the backtest once without costs and once with them, and compare the two equity curves. It’s common for a strategy with a high trade frequency to look attractive on a gross basis and become marginal or loss-making once realistic costs are layered in.
9. Apply Position Sizing and Risk Management
Before entering trade, define position sizing and risk management as it directly affects your strategy’s drawdown, survival, and overall returns.
- Capital per trade: Use a fixed amount or percentage of capital per trade based on risk, means if you are ready to lose 1% of your capital so plan the position plan the position accordingly.
- Maximum risk per trade: 1-2% of risk on total capital is a standard risk.
- Maximum exposure: Define how much of total capital you want to deploy in multiple open trades at the same time.
These rules should be backtested with the same rigor as the entry/exit logic, since two identical strategies with different position-sizing rules can produce dramatically different drawdowns and long-term outcomes.
10. Split the Research Period (In-Sample vs. Out-of-Sample Testing)
Split the research period into two parts, typically 70/30 or 75/25 (in-sample/out-of-sample). Suppose you have 10 years of historical data to backtest.
| Period | Purpose |
| First 7 years (in-sample) | Create and improve your strategy |
| Remaining 3 years (out-of-sample) | Test whether the final strategy actually works |
- In-sample Testing: Create and test multiple strategies on these 7 years of data. Once found a good strategy finalize it for out of sample backtesting.
- Out-of-sample Testing: Now run the same strategy for the remaining 3 years, which you have not used before.
Once you test the strategy on out-of-sample data, do not change the strategy based on those results and test it again on the same data. If strategy performs well during out-of-sample testing without changing any rules, you have stronger evidence that the strategy may have a genuine edge.
11. Measure the right metrics
The metrics to measure in backtesting are briefly discussed below in the table.
| Metric | What It Means | What Is Generally Better? |
| Net Return / CAGR | Total or annualized return generated by the strategy | Higher, but only when risk is acceptable |
| Win Rate | Percentage of profitable trades | No universal “best” level; must be viewed with average win/loss |
| Average Win / Average Loss | How much you make on winning trades compared with losing trades | Ideally, average wins should be equal to or larger than average losses |
| Profit Factor | Gross profit ÷ gross loss | Above 1 is profitable; above 1.5 is generally stronger |
| Expectancy | Average amount the strategy is expected to make or lose per trade | Should be positive |
| Maximum Drawdown | Largest peak-to-trough fall in capital | Lower is generally better |
| Sharpe Ratio | Return generated relative to overall volatility/risk | Above 1 is generally considered good; above 2 is strong |
| Sortino Ratio | Return generated relative to downside risk only | Higher is better; above 1 is generally good |
| Calmar Ratio | CAGR compared with maximum drawdown | Higher is better; above 1 is generally considered good |
| Trade Count | Number of trades used in the test | More trades generally provide more confidence |
| Longest Losing Streak | Maximum consecutive losing trades | Lower is easier to manage, but it must be realistic for the strategy |
| Drawdown Duration | How long the strategy took to recover from a drawdown | Shorter is generally preferable |
However, you do not need every metric to be perfect for your backtest to be useful. Only the essential metric should be perfect like Net P&L / Net Return, Win rate, Average win and average loss, Maximum drawdown, Trade count, and Trading costs and slippage. Sharpe Ratio, Sortino Ratio, and Calmar Ratio are some advanced metrics, if fine if it does not fall in perfect reading.
What Is Overfitting, and How Do You Know You Have Done It?
Overfitting means tuning your strategy’s criteria so much that it starts showing high profitability in backtested results, but as soon as you deploy it in the live market, it fails.
For example, you kept changing RSI levels, stop-losses, targets and entry conditions during your backrest until the result showed a 90% win rate. Here, you forcefully adjusted your original criteria to simply fit past data rather than finding a genuine market edge.
There are five important signs that tell you have done an overfitting.
- Excellent backtest, poor live results: The strategy performs much better historically than in forward testing.
- Too many rules: Adding many indicators and conditions just to improve the backtest can be a warning sign.
- Very specific settings: A strategy works with RSI 13 but fails with RSI 12 or 14.
- Small sample size: A very high return based on only 30–40 trades may be mostly luck.
- Performance collapses out-of-sample: The strategy works on the data used to build it but fails on completely new data.
During backtesting, if changing a small criteria is significantly increasing the win rate, don’t trust that strategy immediately. During our backtest of EMA based strategy, we saw a win rate jump from 55% to 68% just by changing the EMA setting from 20 to 21. We tested nearby EMA values such as 18, 19, 22, 23, and 24, only EMA 21 was showing increased profitability, meaning it was just fitting a historical noise.
Which Biases Silently Invalidate a Backtest?
There are five biases that can make a backtest look profitable even when the strategy may not work in live trading. These five biases are briefly discussed below.
- Look-ahead bias: Using future information to make a past trading decision.For instance, using the day’s closing price to decide a trade supposedly happened at the day’s open.
- Survivorship bias: Testing only companies that have survived and are successful today. For instance, you analyse today’s Nifty 50 stocks for the last 15 years, but what about the stocks that are removed from the Nifty 50?
- Selection bias: Choosing only those trades or timeframe where your strategy performed best and ignoring the losing trade just because they were “unusual”.
- Overfitting: Forcefully changing your strategy again and again until it gives excellent historical results, but fails in the real market.
- Execution bias: Assuming you can always enter and exit at the exact price shown on the chart. In real life, you instead get a worse price due to slippage, liquidity and order delays.
Each of these can independently turn a losing strategy into an apparently winning one on paper. Combined, they compound — which is why deflated or adjusted Sharpe ratios (correcting explicitly for the number of trials and selection effects) are increasingly used in serious quant research instead of the raw Sharpe ratio.
Why Do Indian Options Backtests Break Faster Than Others?
Indian options backtests break faster than others because of frequent rule changes, increasing trading cost, liquidity difference and rapid changes in option prices.
- Change in weekly expiry: Before November 2024, NSE used to have four expiries across four indices (Nifty 50, Nifty Bank, Financial Services, Midcap Select). SEBI then reduced the number of expiry to one index per exchange (Nifty 50 for NSE and Sensex for BSE.
- Lot sizes kept moving: Nifty moved its lot size 50 to 25 and then to 75. This frequent change in lot size directly affects overall backtested strategy due to change in capital requirement, margin and P&L per trade.
- Change in Trading Cost: Over the time STT on option selling has increased from 0.05% before 2023 to 0.0625% in 2023 then 0.10% in October 2024 and 0.15% from April 2026. This is a roughly 3 time increase in STT from the pre-2023 rate. A strategy that made a small profit after costs in an old backtest can become unprofitable today.
- Change in Expiry Day: FRom September 2025, NSE shifted its expiry from Thursday to Tuesday, while BSE moved to Thursday. So your backtested results on Thursday expiry are no longer valid.
- Change in Liquidity: Number of individual traders have increased from 45 lakh in FY22 to more than 1 crore in FY24, directly affecting the liquidity and execution.
The reason for the above discussed changes is the loss of individual F&O traders. Individual traders’ F&O losses reached ₹1,05,603 crore in FY25, up 41% from ₹74,812 crore in FY24, with more than 91% of traders losing money.
How Much Do Costs and Slippage Eat From Your Backtest?
There is no fixed percentage for how much a cost and slippage eats into your backtest. The impact mainly depends on your profit per trade, turnover, trading frequency, brokerage, taxes, and slippage. If your profit percentage is less, costs and slippage will eat up most of the profit and visa versa.
The table below demonstrates how profit percentage and trading costs are related.
| Gross Return | Assumed Cost + Slippage | Profit Left | Profit Eaten |
| 0.25% | 0.20% | 0.05% | 80% |
| 0.50% | 0.20% | 0.30% | 40% |
| 1.00% | 0.20% | 0.80% | 20% |
| 2.00% | 0.20% | 1.80% | 10% |
| 5.00% | 0.20% | 4.80% | 4% |
The smaller the profit percentage, the more dangerous the trading cost becomes. This also means that you need to have a good edge in your trading strategy if your profit percentage per trade is less, because trading costs will eat up your profits fast and without a good edge, you can’t make good returns.
How Do You Validate a Backtest Out of Sample?
Validating backtest out of sample means running and backtesting your strategy on historical data that you did not use while creating the strategy.
- Split Data: Collect the data and split it into two parts, typically 70/30 or 75/25 (in-sample/out-of-sample). Suppose you have 10 years of historical data to backtest.
| Period | Purpose |
| First 7 years (in-sample) | Create and improve your strategy |
| Remaining 3 years (out-of-sample) | Test whether the final strategy actually works |
- In-sample Testing: Create and test multiple strategies on these 7 years of data. Once found a good strategy finalize it for out of sample backtesting.
- Out-of-sample Testing: Now run the same strategy for the remaining 3 years, which you have not used before.
Once you test the strategy on out-of-sample data, do not change the strategy. Many beginners start changing strategy rules after poor out-of-sample results. If strategy performs well during out-of-sample testing without changing any rules, you have stronger evidence that the strategy may have a genuine edge.
How Do You Know the Result Is Not Just Luck?
There are four simple points you should check to know whether your backtested results are genuine or lucky.
- Make sure your backtested results are based on a large number of trades, not just 30-40 trades.
- Check whether the strategy works in bull, bear, sideways, and volatile markets.
- Validate the strategy using out-of-sample data.
- Check whether a small change in strategy is changing the overall results of backtest dramatically. If yes, your backtested result was luck.
The more consistently a strategy performs across different data periods, market conditions, and reasonable parameter changes, the less likely its results are due to luck.
How Do You Backtest Without Coding?
There are two main approaches to backtesting a trading strategy without coding. These approaches are manual backtesting and using a no-code backtesting platform.
Manual Backtesting
It is the simplest way to backtest your trading strategy where you use historical charts and record every trade in Excel or Google Sheets.
Suppose I want to backtest a trading strategy where I will enter long once RSI closes above 50 with a candle low as a stoploss and 1:2 target. I will manually check the historical charts to identify such conditions on the chart. I will then create an excel sheet to note down the date it happened, entry price, exit price, and net profit or loss.
The table below is the example of an excel sheet needed for doing chart base manual backtesting.
| Date | Entry | Exit | Profit/Loss |
| 10 Jan | ₹21,000 | ₹21,150 | +₹150 |
| 18 Jan | ₹21,200 | ₹21,100 | -₹100 |
Once enough historical data is collected, analyse for the required metrics such as sharp ratio, draw down, win-rate etc. However, this method is slow, but it works well for beginners and discretionary strategies.
Use a No-Code Backtesting Platform
Nowadays, softwares like Streak, uTrade Algos, Opstra DefineEdge, AlgoTest, or Tradetron are available in a market that does not require coding and manual backtesting. You just have to give strategy criteria and these backtesting platforms automatically test those rules on historical data.
How Do You Backtest an Options Strategy in India?
Backtesting option strategy is comparatively complicated because unlike normal stock trading strategy, where you need OHLC data, in options strategy backtesting, you need to know which option contract existed at that time, its strike, expiry, premium, liquidity, and how the option price moved during the trade.
You can backtest the options strategy by following 6 simple steps.
- Define the Strategy: Decide underlying, when you will enter, option type (call or put) what strike and expiry you will choose, how many lots, and your exit. Buy the nearest weekly Nifty ATM Call when RSI crosses above 50. Exit at 30% profit or 15% loss.
- Choose How You Want to Backtest: The different methods to backtest options strategy is briefly discussed below.
| Method | Best for | Platform Examples | Main Limitation |
| Excel/Google Sheets | Recording and analysing 50–500 trades | Excel, Google Sheets | Manual data collection and entry |
| Backtesting Platform | Faster testing without coding | Streak, uTrade Algos, Opstra* | Limited customization and strategy support |
| Python | Serious or custom strategies | backtrader, vectorbt, backtesting.py | Requires coding and reliable options data |
Get the Right Historical Data: As we know we strike price, call/put, expiry, volume, and open interest apart from OHLC data. These data points can be collected from sources mentioned below in the table.
| Source | Best For | Limitation |
| NSE | Official historical data | Raw data; may need calculations |
| AlgoTest / Opstra / StockMock | Quick backtesting without coding | Limited customization |
| TrueData / Global Datafeeds | Python and custom backtesting | Paid subscription |
| Bhavcopies / GitHub datasets | Learning and DIY projects | Data may be incomplete |
Add Real-World Costs: Include all the charges in your backtested results, including bid ask spread, liquidity and order delay.
Backtesting, Paper Trading and Forward Testing — In What Order?
The correct order is backtesting, paper trading, and forward testing. Each stage exists to catch a different kind of failure the previous one can’t.
- Backtest: Here you test the strategy on historical data to check the strategy performance. Reject the strategy if it doesn’t work on realistic assumptions.
- Paper Trade: Now run the selected strategy in real time without real money to check how the strategy works under current market conditions.
- Forward Testing: If strategy runs fine in the live market, deploy a small real capital to compare live results with the backtest, check actual slippage and execution, and to see whether the strategy survives current market conditions. Once you build confidence around that particular strategy, you can increase the capital.
Skipping paper trading and going straight from backtest to full-size live capital is one of the most common ways a statistically sound backtest still produces a losing live account — because paper trading and small-cap forward testing are the only stages that expose real slippage and real behavioral deviation from the plan.
Why Does Your Backtest Not Match Your Live Results?
The gap between your backtested results and live results appears because of six main reasons.These reasons are briefly discussed below.
- Ignoring Trading Cost: You might have missed to calculate trading cost and slippage while backtesting. According to SEBI data, your transaction cost itself eats your 22–27% of gross P&L for F&O based trading.
- Overfitting: Your strategy might be overfitted to a specific historical data, where your strategy performed in backtest but failed in live market.
- Execution Difference: Delayed entry due to manual execution, partial order fill due to less liquidity, or a latency with the brokers API makes a difference in end result.
- Change in Position Sizing: If you change your position size out of confidence or revenge, your results will differ from the result you got from backtesting.
- Small Sample Size: If you have backtested a strategy on a small sample (only 40-50 trades), that data is not enough to judge a strategy. You need a much larger sample to know whether the results are consistent or just luck.
The honest fix isn’t a better indicator, it’s treating the backtest as a hypothesis, walk-forward and out-of-sample testing it rigorously, costing it realistically for the Indian market’s specific tax and liquidity structure, and then forward testing with small capital before scaling up.

 11 mins