![15 Screener Alternatives [Free+Paid] You Should Use in 2026](https://www.strike.money/wp-content/uploads/2026/04/Screener-Alternatives-768x482.jpg)
Screener alternatives are searched for when users find their existing platform lacking the features they like to try. With Screener alternatives, they get a chance to look at various options that can be tried and tested to check how well those work as a substitute for Screener.
In this alternatives article, we are not just going to mention the names of the alternatives to Screener, but also discuss their features in detail. This will help you explore the strengths and weaknesses of each and finally decide which option to choose as the most suitable Screener alternative.
Our Experience with Screener Alternatives

- Strike Money – Best For Options Analysis And Strategies
- Tickertape – Best For User-Friendly Stock Screening Tools
- Trendlyne – Best For Advanced Stock Market Insights
- Finology Ticker – Best For Simplified Indian Stock Research
- Moneycontrol – Best For Market News And Portfolio Tracking
- Tijori Finance – Best For Beginner-Friendly Investment Guidance
- Chartink – Best For Technical Charting And Screening
- StockEdge – Best For Fundamental And Technical Analysis
- Stock Rover – Best For Global Stock Research Tools
- NSEIndia – Best For Official Indian Stock Exchange Data
- EquitySet – Best For Consolidated Indian And Global Analytics
- TIKR – Best For Deep Fundamental Company Data
- Koyfin – Best For Comprehensive Global Market Analytics
- GuruFocus – Best For Value Investing And Financials
- Trade Brains – Best For Investment Learning And Screening
Best Screener Alternatives with Detailed Comparison
| Platform Name | Features Missing in Screener | Pricing | Review (Market Perception) |
| Strike Money | Real‑time technical, F&O tools | ₹649 per month (India-focused plans) | Strong for traders and derivatives tools |
| Tickertape | 200+ filters, themes, forecasts | Pro₹299/month₹699/three months₹2399/year | Clean UI, great screening depth |
| Trendlyne | Backtesting & visual analytics | GURUQ – ₹2090/year STRATQ – ₹5900/yearPRO (Global) – ₹8900/yearPRO Plus (Global) – ₹11,900/year | Good deep stock data & scores |
| Finology Ticker | Aggregate news, gainers/losers | Finology ONE – ₹299/monthFinology 30 – 11,999/year | Beginner‑friendly research tool |
| Moneycontrol | Integrated news + compare tools | Pro₹99/month₹499/year₹1299/3 yearsSuperPro₹499/month₹2999/year₹6999/3 years | Trusted and widely used portal |
| Tijori Finance | Sector/peer analysis tools | FreeMonthly – ₹330/monthYearly – ₹3,500/year | Solid fundamentals focus |
| Chartink | Advanced technical screens | Monthly – ₹780 Yearly – ₹8,500 | Favoured by technical traders |
| StockEdge | AI pattern recognition | Premium – ₹250 per month (when billed annually)Pro – ₹999 per month (when billed annually)Club – ₹1999 per month (when billed annually) | Strong chart & pattern analytics |
| Stock Rover | Deep global research | Essentials – $7.99/monthPremium – $17.99/monthPremium Plus – $27.99/month | Highly rated by analysts |
| NSEIndia | Official market data/filings | Free | Authoritative stock exchange data |
| EquitySet | Fair values & gamified analytics | Starter – FreePremium – $240/year Professional – $720/year | Good for early‑stage stock research |
| TIKR | Global historical valuations | Free – $0/monthPlus – $17.95/month Pro – $37.95/month | Institutional‑quality data, global focus |
| Koyfin | 500+ metrics global analytics | Free – $0 per month (limited feature access)Plus – $39 per monthPremium – $79 per monthAdvisor Core – $209 per monthAdvisor Pro – $299 per month | Very strong global and historical data |
| GuruFocus | Expert screens & alerts | 7-day free trialPremium – $549/yearPremium Plus – $1398/yearProfessional – $2448/year | Deep value investing tools |
| Trade Brains | Easy fundamental screener | Starter – $25Professional – $50Enterprise – $75 | Good for beginners/intermediate |
Now that we have mentioned the names of the Screener alternatives, it’s time to get details on the features of each so that you know which is the best per your trading objectives.
Strike Money
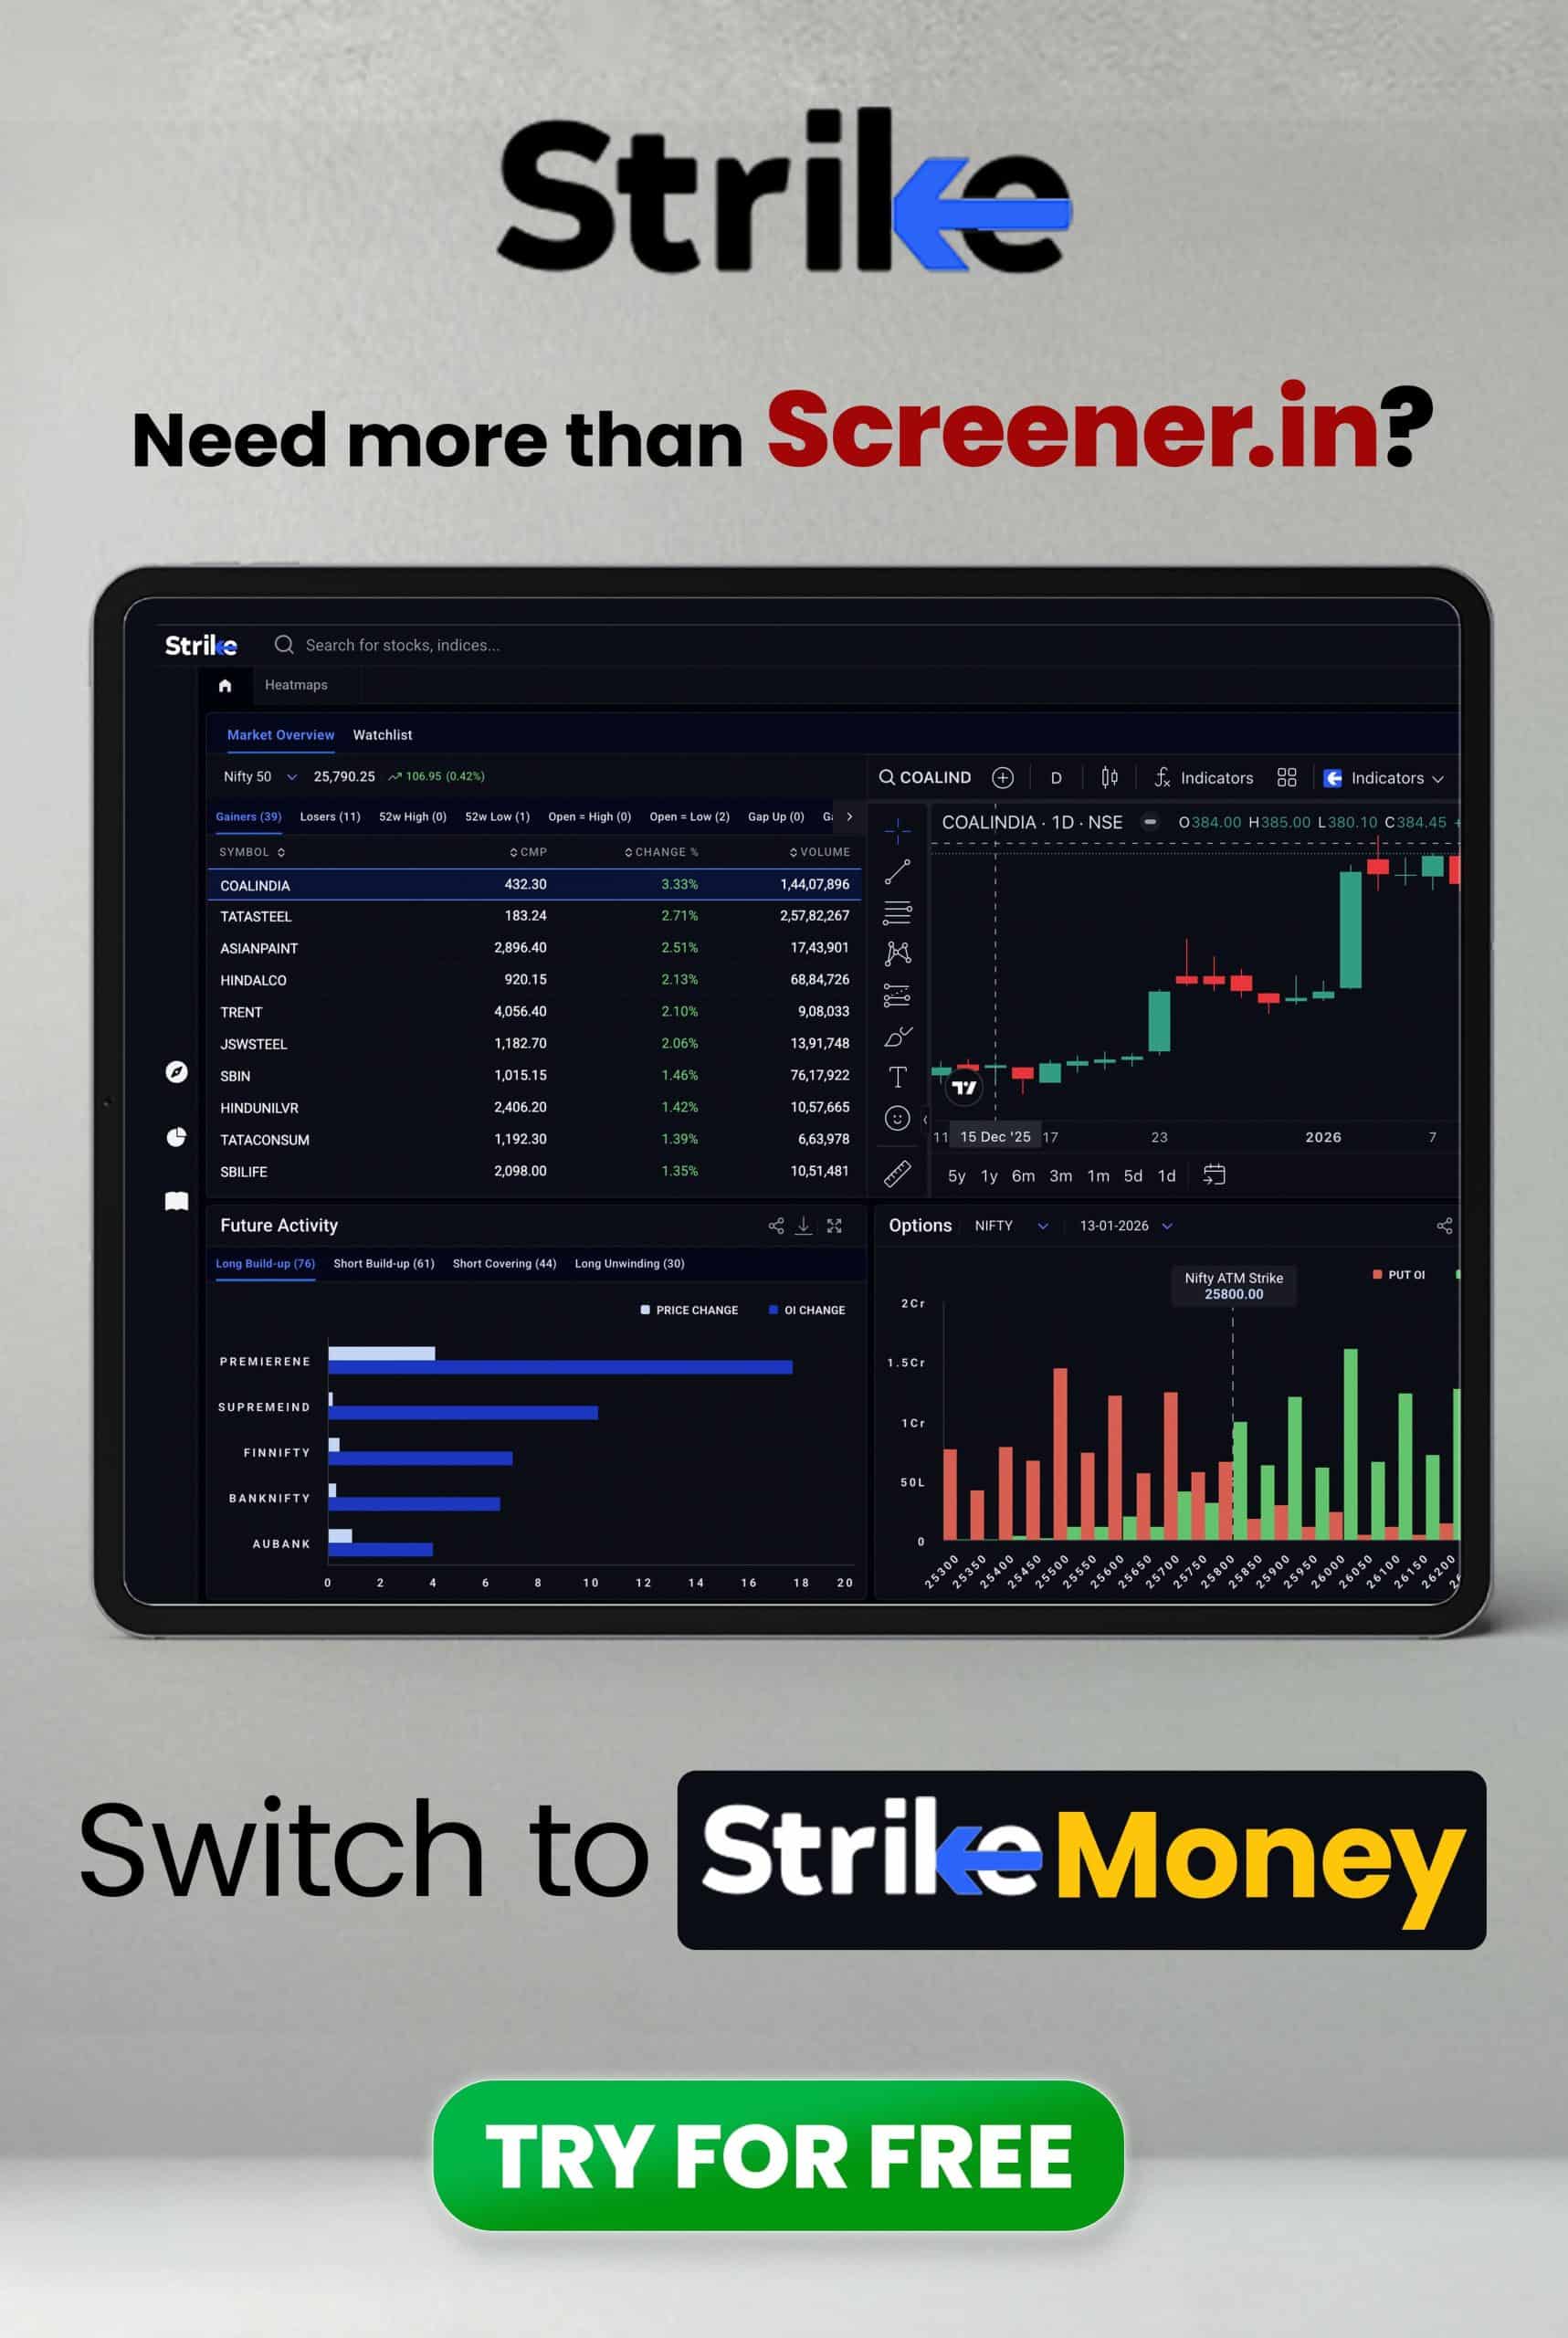
Strike Money is an all-in-one real-time stock market analysis tool that helps investors find high-potential stocks, analyze trends, and make data-backed decisions. It includes intelligent scanners, heatmaps, sentiment indicators, Relative Rotation Graphs (RRG), futures & options analysis, ratio charts, diffusion indicators, and stock/indices data to simplify market analysis for both traders and investors.
Strike was founded on 15 June 2023 in Mumbai, India, with the aim of becoming a leading analytics platform for stock market analysis, backed by experienced market strategists and proprietary technology. Strike offers an intuitive interface with advanced charting, actionable insights, and a freemium model with basic free tools and premium features behind subscription.

Let us now compare the features of Strike Money and Screener to see in what areas or aspects they are better than each other.
| Aspect / Feature | Strike Money | Screener.in |
| Primary Focus | Real-time analytics: scanners, heatmaps, sentiment, options & futures tools for traders. | Fundamental stock screening & deep company financials for investors. |
| Stock Screening | Multiple real-time technical and price/volume screeners. | Custom financial screens with query language on 10+ years of data. |
| Charts & Technical Tools | Technical screeners, RRG, heatmaps, diffusion & sentiment indicators. | Basic charts; focused more on fundamentals than technicals. |
| Fundamental Data | Provides fundamentals and ratios but blended with technical tools. | Extensive financial data, export, peer comparison, segment results. |
| Futures & Options Tools | Advanced options & futures analytics included. | Not focused on F&O analytics. |
| Alerts & Watchlists | Alerts tied to price/momentum and market events. | Screen alerts, company announcements, and customizable alerts. |
| Export/Automation | Data views and dashboards; export exists but secondary. | Excel export, automation and custom uploads supported. |
| AI / Research Assistance | Market insights and analytics features. | Screener AI for insights from company filings. |
| Best For | Active traders / intraday & F&O enthusiasts. | Long-term investors & fundamental analysts. |
Switch to Strike Money if you:
- Need real-time technical scanners
- Use live sector heatmaps
- Actively trade Futures & Options
- Aim to track OI, trends, strategies
- Use Relative Rotation Graphs
- Prefer momentum-based setups
Stick to Screener.in if you:
- Focus on long-term fundamentals
- Need 10+ years financial data
- Wish to build custom screening queries
- Want deep peer comparisons
- Want to export financial data to Excel
- Prefer valuation-driven research
Strike Money is appreciated for its intuitive interface, proprietary scanners, and actionable real-time market insights that help traders identify trends quickly. Users find its technical indicator tools and structured dashboards useful for active trading. However, publicly available user feedback is limited, with relatively few detailed customer reviews shared on the platform.
Tickertape
Tickertape is a comprehensive Indian stock market analysis and research platform that provides data and insights for stocks, mutual funds, ETFs, and indices. It offers powerful stock and mutual fund screeners with hundreds of filters, interactive financial data, portfolio tracking, market sentiment tools, curated screens, and event-driven alerts. Users can analyse fundamentals, compare peers, monitor deals and market mood, and learn through educational content, all in one place via web or mobile.
Founded in 2019 and based in Bengaluru, India, Tickertape was incubated within smallcase and later spun off as a separate entity backed by seed funding. It has since evolved into a freemium analytics platform serving millions of Indian investors with tools for screening, research, and investment decision-making.

Before we conclude Tickertape can be our alternative, it is important to quickly compare the features of both the platforms against each other.
| Feature / Aspect | Tickertape | Screener.in |
| Primary Strength | Multi-asset research & portfolio tracking | Deep fundamental stock analysis |
| Stock Screener | 200+ filters, curated screens | Custom query builder, custom ratios |
| Mutual Fund Screener | Available | Not focused on mutual funds |
| ETF Analysis | Available | Not available |
| Market Sentiment | Market Mood Index | Not available |
| Portfolio Tracking | Built-in portfolio analysis tools | Basic watchlist |
| Peer Comparison | Available on stock pages | Detailed peer comparison |
| Financial Data Depth | Strong fundamental + overview insights | 10+ years detailed financials |
| Export Options | CSV export (Pro) | Excel export & custom uploads |
| Alerts | Asset alerts available | Screen & company alerts |
Switch to Tickertape if you:
- Want multi-asset research (stocks, mutual funds, ETFs)
- Use 200+ filter screeners with pre-built themes
- Track portfolio performance and diversification
- Monitor market sentiment (Market Mood Index)
- Analyze mutual funds and ETFs alongside stocks
- Prefer visual dashboards and scorecards
Stick to Screener.in if you:
- Focus on deep, detailed fundamental analysis
- Need 10+ years of financial data
- Wish to build custom screening queries & ratios
- Want to perform comprehensive peer comparisons
- Require exporting and analyzing data via Excel
- Prefer valuation-centric research for investing decisions
Users often praise Tickertape for its clean UI, ease of screening, and helpful fundamental summaries that aid novice investors, but some note that suggested valuations lack transparent methodology and data can differ from other sources. Others feel premium features may not justify the cost, and deeper analysis still requires independent research.
Trendlyne
Trendlyne is an Indian stock market analytics and research platform that helps investors and traders with data-driven decision-making. It offers advanced stock screeners with hundreds of parameters, fundamental and technical analysis, DVM stock scores (Durability, Valuation, Momentum), real-time alerts, portfolio tools, SWOT analysis, consensus earnings estimates, and customizable watchlists. The platform also includes features like backtesting, analyst calls, and insights across NSE & BSE stocks.
Trendlyne was founded in 2017 and is headquartered in Bengaluru, India, with a mission to simplify investing using structured financial analytics for retail investors, research analysts, and advisors. Its tools have expanded over time to include advanced screeners, alerts, and portfolio solutions.

Now that the features of Trendlyne are known to us, let us compare them with those offered by Screener.
| Feature / Aspect | Trendlyne | Screener.in |
| Stock Screener | Custom stock screener with 1000+ parameters, easy & advanced modes, technical & fundamental filters, AI-powered screen creation. | Custom screening with financial filters & custom ratios, focused on fundamentals. |
| Analyst Insights | Analyst forecasts, price targets, recommendations beyond basic data. | Not offered. |
| Backtesting | Backtesting for screens and strategies included. | No built-in backtest feature. |
| Options & Derivatives Tools | Offers options & derivatives analytics within platform. | Not available. |
| Global Data | Provides some global stocks & indices dashboards. | Focus on Indian stocks only. |
| Financial Data Depth | Includes financials but enhanced with scorecards and forecasts. | 10+ years of detailed financials from filings. |
| Custom Ratios & Queries | Screener supports multiple parameters but Trendlyne focuses more on preset and AI mapping. | Strong custom query language & ratio creation. |
| Export / Data Download | Exports available and integrates with spreadsheets. | Excel export & automation available. |
| Alerts & Watchlist | Offers alerts and watchlists on screens and scores. | Provides alerts and watchlists with thresholds. |
Switch to Trendlyne if you:
- Want stock screeners with 1000+ parameters and AI-assisted query creation.
- Use backtesting tools for strategies and screens.
- Prefer DVM scoring (Durability, Valuation, Momentum).
- Track options & derivatives analytics like SmartOptions.
- Enjoy broad dashboards (ETF, global indices, F&O).
Stick to Screener.in if you:
- Need powerful custom queries and ratio creation.
- Focus on deep fundamental data from filings.
- Want detailed peer comparisons with flexible columns.
- Prefer reliable financial screening for long-term investing.
Users generally view Trendlyne as a capable platform for analysing both fundamental and technical stock details, including news and corporate actions, with positive comments on its daily market insights and valuation tools. Some reviewers mention the paid version feels expensive and chart visuals could improve, but overall feedback reflects satisfaction with its analysis capabilities.
Finology Ticker
Finology Ticker is an online equity research and stock analysis tool designed to help investors pick smarter stocks. It offers a stock screener with 1200+ ratios and criteria, detailed company financials, IPO watchlists (upcoming & listed), market snapshots (gainers/losers, indices), peer comparison, curated news, and educational insights, all accessible through its web interface. The platform also provides insights, articles, and analysis to help users understand market trends and stock fundamentals.
Ticker was launched by Finology Ventures Pvt. Ltd. as part of its suite of investor tools to simplify Indian stock research, empowering users with structured fundamental and market analysis. With time, it has expanded features like screener tools and IPO data to support informed investing.

Now that we have explored the features of Finology Ticker, let us compare them with those offered by Screener.in.
| Feature / Aspect | Finology Ticker | Screener.in |
| Stock Screener | Screener with filters and 1200+ ratios/criteria across NSE/BSE stocks. | Highly customizable screening using query language & custom ratios. |
| IPO Listings | Dedicated IPO section (upcoming & listed). | IPO info not a core focus. |
| Market Overview | Market summaries, gainers/losers, sectors & indices. | Provides fundamentals, alerts and corporate disclosures. |
| Peer Comparison | Peer comparison included in screener. | Peer comparison is available as part of company data view. |
| Portfolio Tools | Portfolio tracking & watchlists are available (web). | Watchlists with alerts and threshold features. |
| Alerts & Updates | Offers curated news and market updates. | Email alerts for quarterly results and customized price/financial alerts. |
| Financial Data | Provides company financials and core ratios via screener & stock pages. | In-depth financials with customizable export options (CSV/Excel). |
| Export Options | Export & data downloads depend on features offered. | CSV & Excel export for screens and detailed reports. |
Switch to Finology Ticker if you:
- Want a dedicated IPO section (upcoming & listed)
- Use 1200+ ready financial ratios
- Prefer built-in market snapshots (gainers/losers, sectors)
- Like curated stock insights & articles
- Need simple peer comparison views
- Prefer beginner-friendly stock pages
Stick to Screener.in if you:
- Build advanced custom screening queries
- Create your own financial ratios
- Analyse 10+ years financial statements
- Perform deep peer comparison
- Export data to Excel/CSV
- Focus on valuation-driven investing
Customer feedback on Finology’s platform is generally positive, with many users praising clear investing insights, helpful stock recommendations, and responsive support that aids beginners. However, some users report technical issues, subscription access problems, or expectations not met, leading to occasional frustration alongside strong endorsements of its educational value.
Moneycontrol
Moneycontrol is one of India’s oldest and most widely used financial news and markets platforms, offering comprehensive business news, live market data, stock prices, mutual fund tracking, portfolio tools, expert analysis, charts, and financial insights. Users can follow indices, commodities, currencies, and more, with dedicated sections for personal finance, taxes, and investment tools. Recent updates include interactive tools, customizable watchlists, market movers, and real-time alerts to help investors stay informed and act quickly.
Moneycontrol was launched in 1999 as an online financial portal providing stock prices and market data. Since then it has evolved into India’s largest digital finance and investment information platform, attracting over 100 million monthly visitors and expanding its tools, content, and services across web and mobile.

Now let us check how Moneycontrol and Screener.in are better than each other in certain aspects.
| Feature / Aspect | Moneycontrol | Screener.in |
| Core Focus | Financial news, markets data, portfolio & watchlists | Deep fundamental stock screening & analysis |
| Market Data & News | Live markets, corporate news, IPOs, indices, commodities, currencies | Real-time price data with corporate updates (focus on fundamentals) |
| Stock Screener | Basic stock filters integrated with news & updates | Advanced custom screen creation & filters with query language |
| Fundamentals | Financial numbers available but more news-oriented | 10+ years historical financials & custom ratios |
| Alerts & Watchlist | Watchlist + news alerts & portfolio tracking | Watchlists, email alerts based on screens & quarterly data |
| Comparison Tools | Compare stocks side-by-side across metrics | Peer comparison built into stock pages & screens |
| Research & Insights | Expert analysis, editorial content, premium research | Data-driven insights & community screens |
| Export | Limited export focus | Excel/CSV export & automation (premium) |
Switch to Moneycontrol if you:
- Want real-time market news & breaking updates
- Track commodities, currencies, global markets
- Follow IPO news & corporate developments
- Use integrated portfolio tracking tools
- Prefer expert opinions & editorial research
- Monitor live TV, videos, market commentary
Stick to Screener.in if you:
- Build advanced custom stock screens
- Create your own financial ratios
- Want to analyze 10+ years financial statements
- Wish to perform deep peer comparison
- Export data to Excel/CSV
- Focus on valuation-driven investing
Users generally appreciate Moneycontrol for its comprehensive market data, timely news updates, and easy-to-use portfolio tracking tools. Many find it essential for staying informed on stocks, indices, and finance news. However, some reviewers mention too many ads and occasional technical issues with app performance or notifications.
Tijori Finance
Tijori Finance is a market research and investment analytics platform that helps investors explore stock ideas, track portfolios, and monitor market events. Its Ideas Dashboard highlights themes like promoter buying, whale buying, mergers, capex, fundamentals, and trending stocks. Users can add stocks and mutual funds to their portfolio, receive real-time alerts via WhatsApp, follow results calendars and conference calls, and use a stock screener to filter companies.
Tijori Finance has grown in prominence partly through its integration with major brokers, offering structured insights and alerts tied to exchange filings and corporate actions. Its tools focus on combining fundamental data with event-driven signals to support smarter investment decisions. The dashboard also shows market performance, sector indices, and niche indices for a broad view of market movements. Portfolio data can be automatically fetched and updated from connected brokerage accounts.

Now that we have explored the features of Tijori Finance, let us compare the same with those offered by Screener.in.
| Feature / Aspect | Tijori Finance | Screener.in |
| Curated Idea Streams | Promoter buying, whales buying, mergers, capex, trending stocks | General fundamental screens only |
| Timeline & Updates Feed | Tailored event timeline for filings/news | No dedicated event timeline |
| Alerts & Notifications | Price/volume alerts with Free/Premium | Alerts available, but mainly link to screens |
| Broker Integration | Sync portfolio via Zerodha | No direct broker integration |
| Niche Indices & Market Monitor | Shows sector/niche index performance | Not available |
| Stock Screener | Natural language/boolean filters | Custom financial screening with query builder |
| Historical Financials | Some financial data | 10+ years of financials & custom ratios |
| Export Options | Limited | Excel/CSV export |
| Peer Comparison | Available | Detailed peer comparisons |
Switch to Tijori Finance if you:
- Want curated idea dashboards (promoter/whale buying, capex, M&A)
- Track event-based stock timelines
- Receive WhatsApp price & event alerts
- Sync portfolio with broker accounts
- Monitor niche & sector indices
- Prefer theme-based investing insights
Stick to Screener.in if you:
- Build advanced custom screening queries
- Create your own financial ratios
- Analyse 10+ years financial statements
- Perform deep peer comparison
- Export data to Excel/CSV
- Focus on valuation-driven investing
Users appreciate its user-friendly interface and comprehensive data insights, while some note that subscription changes and certain UX elements could be better, indicating mixed feedback from investors exploring the platform.
Chartink
Chartink is a web-based Indian stock market scanner and analysis platform that lets users filter and scan stocks using custom technical and fundamental criteria like price action, RSI, MACD, P/E, volume, breakouts and more, all without requiring coding. The platform offers pre-built and user-defined screeners, real-time alerts, customizable dashboards and watchlists, along with basic charting tools to monitor market activity and patterns on NSE listed stocks.
Chartink has been a prominent stock scanner tool focused on the Indian equities market since at least 2017, evolving into a widely used web-based platform for technical screening and market insights that caters to traders and investors seeking customizable stock scanning without scripting. Its core strength has been simple, powerful filtering of NSE stocks based on both technical and fundamental indicators.

Let us check the comparison between Chartink and Screener to know in what ways they are better than each other.
| Feature / Aspect | Chartink | Screener.in |
| Core Focus | Technical and basic fundamental stock scanning & alerts | Deep fundamental stock screening & analysis |
| Screeners | Powerful technical & price action screeners with multi-condition filters | Advanced custom fundamental queries & ratios |
| Technical Indicators | Broad support (RSI, MACD, EMA, volume patterns, breakouts) | Limited technical filters (focus mainly fundamental) |
| Pre-Built Scans | Large library of ready-made technical scans | Templates focus on financial criteria |
| Custom Logic | Create screens with complex AND/OR conditions without coding | Custom queries with financial expressions |
| Real-Time Alerts | Alerts on scan triggers & price action | Alerts tied to financial events and screen results |
| Charting Tools | Basic charting tools alongside scanners | Fundamental tables & charts (not focused on price charts) |
| Export | Export scan results (limited) | Excel/CSV export of screened data |
| Historical Financial Data | Minimal | 10+ years detailed company financials |
| Watchlists | Track stocks within scans/watchlists | Watchlist with alerts for fundamentals |
Switch to Chartink if you:
- Use technical indicators (RSI, MACD, EMA)
- Scan price action & breakout patterns
- Create multi-condition AND/OR scans
- Use ready-made technical scan templates
- Set real-time price/scan alerts
- Prefer chart-based trade setups
Stick to Screener.in if you:
- Build advanced fundamental queries
- Create custom financial ratios
- Analyse 10+ years financial data
- Perform deep peer comparison
- Export detailed data to Excel/CSV
- Focus on valuation-driven investing
User feedback for Chartink generally highlights its strength as a powerful and flexible stock screener, with many users appreciating its ability to create custom technical scans and receive alerts. Traders value its utility for spotting trade setups without needing coding skills. Some feedback points to ads and data delays in the free plan, and a few users mention occasional quirks with app behavior or interface.
StockEdge
StockEdge is an Indian stock market research and analytics platform that provides traders and investors with fundamental, technical, and derivatives research tools. It offers automated scans, customizable watchlists, portfolio tracking, visual analytics, market dashboards (indices, sector data, trend reports), and predefined trading strategies. Advanced features include AI-based chart pattern recognition, profitability and shareholding scans, technical peer comparisons, and alerts.
StockEdge was founded in 2016 to empower retail investors with comprehensive analytics on NSE and BSE markets. Since then, it has grown into a widely used analytics app with evolving features like AI-driven chart pattern detection, enhanced dashboards, and advanced scans aimed at making market research accessible and efficient for Indian traders and investors.

Let us now check the quick comparison between StockEdge and Screener.in.
| Feature / Aspect | StockEdge | Screener.in |
| Core Focus | All-in-one market analytics: fundamental, technical & derivatives scanning | Deep fundamental stock screening |
| Screeners | Pre-built & customizable scans for fundamentals & technical setups | Advanced custom filters with powerful query builder |
| AI Pattern Recognition | AI-powered chart pattern recognition (premium) | — |
| Technical & Derivative Tools | Technical indicators, Combo scans, sector rotation, derivatives insights | Limited technical tools; mainly fundamentals |
| Fundamental Data | Basic financials, growth & screening | Deep fundamentals with 10+ years of history |
| Peer Comparison | Basic peer views | Detailed peer comparison tools |
| Export Options | Limited export features | Export to Excel/CSV in premium |
| Alerts & Watchlist | Custom watchlists & alerts | Watchlists with alerts for stock & screen events |
| Platform & Data | Mobile & web with visual dashboards | Web + mobile-responsive platform |
Switch to StockEdge if you:
- Use AI-powered chart pattern recognition
- Want combined technical + derivatives scans
- Prefer ready-made scan categories (combo scans)
- Use visual dashboards & market heatmaps
- Track sector rotation & trend analytics
- Need mobile app with integrated alerts
Stick to Screener.in if you:
- Build advanced custom fundamental screens
- Create your own financial ratios
- Analyse 10+ years of financial statements
- Perform detailed peer comparisons
- Export data to Excel/CSV
- Focus on valuation-centric investment research
Users generally find StockEdge useful and comprehensive for stock analysis, scans, and market insights, often praising its tool set and informative data. Many appreciate its beginner-friendly UI and analytics coverage. However, some users report aggressive subscription outreach and occasional performance issues, reflecting mixed but mostly positive feedback.
Stock Rover
Stock Rover is a web-based investment research and portfolio management platform focused on in-depth fundamental analysis of stocks, ETFs, and mutual funds. It provides powerful screening with extensive financial metrics, custom comparison tables, advanced charting, watchlists, alerts, brokerage integration, portfolio analytics, fair value estimates, dividend tracking, research reports, and data export tools. Users can build complex filters, compare multiple securities side-by-side, analyze historical performance, and evaluate portfolio diversification from a single dashboard.
Founded in 2008 by software engineers who were individual investors, Stock Rover was created to streamline equity research by combining data, analytics, and portfolio tools into one platform. Over time, it has expanded its screening depth, visualization capabilities, and premium research features.

Now that you know the features of Stock Rover, it’s time to check how these are better in certain ways than Screener.in.
| Feature / Aspect | Stock Rover | Screener.in |
| Core Focus | Comprehensive investment research & portfolio analytics across global stocks, ETFs & funds with deep screening tools. | Deep fundamental screening & analysis for Indian stocks. |
| Stock & ETF Screener | Powerful screening with hundreds of metrics, ranking, historical and equation-based filters; supports ETFs & global markets. | Custom fundamental screening with many filters and plain-English queries. |
| Historical & Advanced Metrics | Screen on historical data, custom equations, and ranking systems. | Historical fundamentals (10+ years), but no advanced ranking logic or custom equations. |
| Fundamental Depth | Strong fundamental data + portfolio visualization. | Very deep fundamental financials with detailed filings, ratios, peer comparison. |
| Export & Reports | Data export and custom reporting. | Excel/CSV export, downloadable reports. |
| Portfolio Analytics | Extensive portfolio tracking, rebalancing & simulation tools. | Watchlists with alerts. |
| Global Coverage | Global exchanges, ETFs, and mutual funds. | Focus is Indian listed companies. |
Switch to Stock Rover if you:
- Need global stock, ETF & fund coverage
- Want advanced ranking & scoring systems
- Build equation-based custom screens
- Screen using historical financial metrics
- Require portfolio analytics & rebalancing tools
- Prefer brokerage integration
- Analyze dividend projections & simulations
Stick to Screener.in if you:
- Focus only on Indian equities
- Want deep 10+ years financial statements
- Use simple, plain-English custom queries
- Rely on detailed peer comparison tables
- Prefer clean, distraction-free UI
- Need easy Excel/CSV exports
Customer feedback for Stock Rover on that review page is limited and mixed. Some users complain that portfolio tracking data didn’t update correctly and experienced slow performance or data inaccuracies, especially outside North America. Others mention that the platform’s deep screening and valuation tools are useful, but note that responsiveness and global data coverage could improve. Overall, the few published reviews reflect mixed satisfaction with functionality and usability.
NSEIndia
National Stock Exchange of India (NSEIndia) is India’s leading stock exchange and a fully electronic trading platform offering trading in equity, derivatives, debt, currency, and other financial instruments. Its website provides live market data, index information (including Nifty indices), corporate filings, company announcements, IPO details, circulars, settlement data, risk management framework, investor services, and educational resources. It also offers historical data, sectoral indices, regulatory disclosures, and clearing and settlement information for market participants.
Incorporated in 1992, NSE commenced operations in 1994 with screen-based electronic trading, introducing transparency and efficiency to Indian markets. Over time, it has grown into one of the world’s largest exchanges by derivatives trading volume, strengthening India’s capital market infrastructure.

Now that you know the features of NSEIndia, let us compare the same with the features that Screener.in offers.
| Feature / Aspect | NSEIndia | Screener.in |
| Primary Purpose | Official market operator for trading and regulatory information | Fundamental stock screening & research |
| Live Market Data | Real-time prices, indices, volume, market depth | Price data with focus on fundamentals |
| Indices Information | Comprehensive index data (e.g., Nifty 50, Nifty Next 50) | Index exposure via company fundamentals |
| Derivatives Data | Full derivatives series, contracts, expiry, volumes | No dedicated derivatives data |
| Corporate Filings & Announcements | Official company disclosures, circulars, financials | Financials extracted with drill-down details |
| Stock Screening Tools | No proprietary screening tool | Advanced custom screening with query language |
| Historical Financial Data | Basic reference data; not a research tool | Detailed 10+ years financials & ratios |
| Regulatory & Settlement Info | Rules, trading systems, SEBI compliance | Not applicable |
| Educational Resources | Investor education, FAQs, circulars | Community screens & guides |
| Export Capability | Data downloads & reports for market users | Excel/CSV export of screens |
Switch to National Stock Exchange of India (NSEIndia) if you:
- Need official real-time market data
- Track live order book & market depth
- Access derivatives contracts & expiry data
- View official corporate filings & exchange circulars
- Monitor IPO details & listing information
- Check clearing, settlement & compliance rules
- Rely on authentic exchange-issued announcements
Stick to Screener.in if you:
- Build advanced custom fundamental screens
- Analyze 10+ years financial statements
- Create ratio-based investment filters
- Perform detailed peer comparisons
- Use clean, research-focused dashboards
- Export data to Excel/CSV for analysis
Users appreciate it as an official and reliable source for exchange data, corporate filings, and market announcements. However, some report usability challenges, data access restrictions, occasional delays, and technical glitches, indicating room for improvement in user experience and accessibility.
EquitySet
EquitySet is a web-based stock research and analytics platform designed to help investors evaluate Indian equities and ETFs. It provides searchable stock reports, screeners, watchlists, market themes, curated collections, interactive charts, and sector insights. Users can access both free tools,including basic stock reports, screening, and watchlists, and premium features, such as fair value estimates, stock ratings, advanced filters, detailed financials, earnings history, and dividend data.
Founded to empower retail investors, EquitySet emphasizes independent and unbiased stock research. By integrating quantitative models with qualitative insights, it offers a comprehensive view of company valuation, performance trends, and market comparisons, making equity analysis more accessible and actionable.

Let us now quickly compare EquitySet features with those that Screener.in offers.
| Feature / Aspect | EquitySet | Screener.in |
| Stock Research Reports | Provides detailed stock reports with fair value estimates, ratings, earnings & dividends (premium). | Provides company financials and insights but not proprietary rating reports. |
| Fair Value & Ratings | Stock fair value and buy/hold/sell ratings based on proprietary analytics. | Does not provide proprietary fair values or ratings. |
| Screener Filters | Basic stock screener with valuation, P/E, dividend yield, themes and tags. | Advanced screening with 100+ financial parameters & custom queries. |
| Historical Financial Data | Offers financial data but limited compared to deep history. | 10+ years detailed company financials for analysis. |
| Watchlists & Themes | Watchlists, favorites, and investment themes for discovery. | Watchlists with alerts, but less thematic grouping than EquitySet. |
| Export / Data Download | Limited export options | Excel/CSV export available for screening data. |
| Valuation Focus | Strong on valuation signals & fair value comparisons. | Strong on fundamental ratios & customizable screens. |
Switch to EquitySet if you:
- Want proprietary fair value estimates
- Use stock ratings (buy/hold/sell)
- Access curated stock reports
- Explore investment themes & collections
- Track interactive charts & sector insights
- Discover gamified stock-picking opportunities
Stick to Screener.in if you:
- Build advanced custom fundamental screens
- Analyse 10+ years financial statements
- Create ratio-based filters & queries
- Perform detailed peer comparisons
- Export data to Excel/CSV
- Focus on valuation-driven investment research
The reviews highlight features of the platform, including stock reports, fair value estimates, ratings, watchlists, and stock‑picking tools, but there is no proper customer experience or sentiment, leaving actual user satisfaction unreported.
TIKR
TIKR is a global investment research and analysis platform offering institutional‑grade financial data and tools to individual investors. It includes a powerful global stock screener with thousands of filters, detailed fundamental data (income statements, balance sheets, cash flow, ratios), analyst estimates, portfolio tracking, and tools to monitor superinvestor holdings and corporate filings across 100,000+ stocks in 92+ countries. Users can also build custom valuation models and chart financial trends for deeper analysis. The platform aims to democratize access to data traditionally available only to institutions.
Founded to empower retail investors with professional research tools, TIKR was developed as an accessible alternative to expensive institutional terminals, combining global coverage, detailed financials, forward estimates, and valuation analytics into a unified platform.

Let us now check how TIKR and Screener.in can be better than each other in certain areas.
| Feature / Aspect | TIKR | Screener.in |
| Global Coverage | Extensive global stock universe (100,000+ companies across 90+ countries) | India‑focused stocks |
| Stock & ETF Screening | Advanced global screener with industry, geography, financial screens | Advanced Indian screener with custom financial queries |
| Fundamental Data Depth | Institutional‑grade fundamentals, historical financials | Detailed Indian financials, 10+ years data |
| Analyst Estimates | Consensus analyst forecasts & estimates | Not available |
| Portfolio Tracking | Integrated portfolio tracking & dashboards | Watchlists with alerts |
| Valuation Tools | Custom valuation models, multiples comparison | Fundamental ratios & peer comparison |
| Superinvestor Holdings | Tracks holdings of top investors | Not available |
| Corporate Filings | Access to global filings & updates | Focus on Indian disclosures |
| Export / Download | Export data into Excel/CSV | Export screens & reports |
| Visual Charts & Graphs | Advanced financial/valuation charts | Basic financial charts |
Switch to TIKR if you:
- Need global stock coverage (90+ countries)
- Access analyst estimates & forward projections
- Track superinvestor holdings
- Use custom valuation models
- View global corporate filings
- Integrate portfolio tracking with dashboards
- Analyze advanced financial charts and trends
Stick to Screener.in if you:
- Focus on Indian equities
- Build advanced custom fundamental screens
- Analyze 10+ years detailed financials
- Create ratio-based investment filters
- Perform deep peer comparisons
- Export data easily to Excel/CSV
- Conduct valuation-driven research for Indian stocks
Users generally find TIKR valuable for its deep fundamental data, global coverage, and screening tools, noting it’s useful as an affordable alternative to expensive research terminals. Positive comments highlight the breadth of built‑in financials and earnings transcripts. However, some users mention interface quirks, data limits on free tiers, and occasional usability issues with watchlists or data export.
Koyfin
Koyfin is a web-based financial data and analytics platform that provides investors and analysts with a comprehensive view of global markets, including equities, ETFs, indices, fixed income, commodities, and foreign exchange. Its features include interactive charts, customizable dashboards, news feeds, screeners, technical and fundamental metrics, peer comparisons, valuation tools, and performance visualizations. Users can track market trends, analyze company financials, compare assets, and monitor economic indicators.
Founded to democratize high-quality financial data, Koyfin has evolved into a widely adopted platform known for rich global data coverage, intuitive interface, and powerful visualizations, enabling investors to efficiently analyze markets and manage research workflows.

Let us now quickly compare the features of Koyfin against the features of Screener.in.
| Feature / Aspect | Koyfin | Screener.in |
| Market Coverage | Global markets: stocks, ETFs, indices, FX, commodities | Focuses on Indian equities |
| Stock Screening | Powerful global stock screener with 5,900+ filter criteria | Advanced Indian fundamental screening with custom queries |
| Historical Data | 10+ years historical financials & estimates | 10+ years detailed financials |
| Dashboards & Visualization | Customizable dashboards, interactive charts, scatter plots, macro dashboards | Basic dashboards; focused on fundamentals |
| Portfolio Tracking | Integrated portfolio and watchlist with analytics | Watchlist with alerts only |
| Export / Download | Some export options (CSV screens) | Excel/CSV export for screens & reports |
| Multi‑Asset Coverage | Includes ETFs, bonds, FX, commodities | Primarily stocks |
| Mobile Access | Web + mobile app available | Web only |
| Visual Tools | Advanced charting, macro data dashboards | Charting focused on fundamentals |
Switch to Koyfin if you:
- Need global market coverage (stocks, ETFs, FX, commodities)
- Use interactive dashboards and advanced charts
- Track macro-economic indicators and multi-asset trends
- Monitor portfolio with analytics
- Access custom scatter plots and visualizations
- Prefer mobile app support
Stick to Screener.in if you:
- Focus on Indian equities
- Build custom fundamental screens with queries
- Analyze 10+ years of financial data
- Perform peer comparisons and ratio-based analysis
- Export data easily to Excel/CSV
- Conduct valuation-driven research for investment decisions
Users generally praise Koyfin for its intuitive interface, ease of use, and powerful data visualization, allowing efficient market research, customizable dashboards, and portfolio analysis. Many appreciate its cost‑effective access to institutional‑grade financial data. Some users note minor limitations such as feature gaps, occasional learning curve, or specific data constraints, but overall feedback highlights strong usability and comprehensive analytics.
GuruFocus
GuruFocus is a stock research and financial analysis platform that helps investors discover investment ideas, analyse companies, and track market data. Its features include financial statements, valuation tools, growth screens, stock screeners, insider trades, institutional holding data, backtesting tools, portfolio tracking, and proprietary metrics such as GF Value, Buffett‑Margin of Safety, and various valuation models.
GuruFocus was launched to bring long‑term, value‑oriented investment research tools to individual investors by aggregating public filings, guru portfolios, and proprietary analytics into one resource. Over time, it expanded into a comprehensive research suite offering deep historical fundamentals, screening tools, and unique valuation perspectives used by value investors.

Now that the features of GuruFocus are known, let us compare them with Screener features to understand where they surpass or fall short of the other.
| Feature / Aspect | GuruFocus | Screener.in |
| Core Focus | Value‑oriented research, guru portfolios, valuation models | Deep fundamental screening & analysis |
| Guru Portfolios | Shows actual holdings of famous investors | Not available |
| Valuation Tools | Proprietary metrics (e.g., GF Value, Margin of Safety) | Fundamental ratios & custom filters |
| Financial Statements | Detailed historical financials | Detailed historical financials |
| Screeners | Growth, value, and custom screens | Custom query‑based screening |
| Backtesting | Tools to backtest screens/strategies | Not available |
| Insider & Institutional Data | Insider transactions & institutional ownership | Basic shareholding data |
| Alerts | Alerts on screens can be configured | Alerts for screens & fundamentals |
| Portfolio Tracking | Portfolio monitoring & analysis | Watchlists & alerts |
| Export / Download | Export tools available | Excel/CSV export for screens & reports |
| Ease of Use | Built‑in investment frameworks | Flexible query builder |
Switch to GuruFocus if you:
- Track guru portfolios and famous investor holdings
- Use proprietary valuation metrics (GF Value, Margin of Safety)
- Access insider transactions & institutional ownership
- Backtest investment screens and strategies
- Monitor portfolio performance with analytics
- Leverage pre-built value and growth screens
Stick to Screener.in if you:
- Focus on Indian equities
- Build custom fundamental screens with queries
- Analyze 10+ years of financial statements
- Perform peer comparisons and ratio-based analysis
- Export data to Excel/CSV
- Conduct valuation-driven research for investment decisions
Users generally appreciate GuruFocus for its deep value investing tools, guru portfolio tracking, and extensive financial data, saying it adds depth to research. Many find its proprietary metrics useful for long‑term analysis. Some mention the subscription cost and occasional usability quirks as drawbacks, but overall feedback remains largely positive and value‑focused.
Trade Brains
Trade Brains is an Indian investment education and stock research platform that helps investors learn markets and make informed decisions. It offers stock screeners, financial data, curated stock lists, educational blogs, investment calculators, and insights on fundamentals, valuation, and company analysis. The platform also provides sector reports, dividend information, and comparative views on companies, along with tools for evaluating intrinsic value and key financial ratios.
Founded by investors who wanted to empower retail participants with clear, research‑based information, Trade Brains has grown into a comprehensive resource hub focused on education, stock research, and analytical tools for Indian markets, helping users build confidence and skill in long‑term investing.

Let us now quick check how some features of Trade Brains and Screener.in can be better than the others.
| Feature / Aspect | Trade Brains | Screener.in |
| Focus | Stock research + education + thematic tools | Deep fundamental stock screening |
| Stock Screener | Fundamental screener with 130+ filters | Advanced custom screening with query builder |
| Company Comparisons | Compare up to 5 stocks side‑by‑side | Peer comparison with multiple columns and metrics |
| Watchlists | Multiple watchlists & portfolio dashboard | Watchlists with alerts and follow features |
| Research Reports | Curated stock research reports & insights | Not proprietary research — data focused |
| Buckets & Themes | Thematic stock buckets & superstar portfolios | Community screens only |
| Heatmaps & News | Stock heatmaps, daily market news | Alerts on corporate events & fundamentals |
| Historical Financials | Shows financials but shorter range | 10+ years of detailed data for deeper analysis |
| Export / Download | Supports export to Excel/CSV | Excel/CSV export & automation |
Switch to Trade Brains if you:
- Use thematic stock buckets & curated portfolios
- Access educational blogs and guides
- Compare multiple stocks side‑by‑side
- Track heatmaps & daily market news
- Manage multiple watchlists with dashboards
- Benefit from curated research reports & insights
Stick to Screener.in if you:
- Focus on Indian equities
- Build advanced custom fundamental screens with queries
- Analyze 10+ years detailed financials
- Perform peer comparisons and ratio-based analysis
- Export data easily to Excel/CSV
- Conduct valuation-driven research for investment decisions
Users generally value the fundamental data, screener tools, and stock insights offered by the Trade Brains Portal app, finding it useful for research and watchlists. However, many report bugs (watchlist/portfolio issues), slow performance, limited real‑time data, and problems accessing premium features, indicating mixed satisfaction and room for improvement.
What are the Free Alternatives to Screener?
The free alternatives to Screener include Finology Ticker, Chartink, Moneycontrol, NSEIndia, and Tijori Finance.
- Finology Ticker – Lifetime free access to stock screener, financial data, IPO lists, and research insights.
- Chartink — Offers custom stock screeners for NSE stocks at no cost (free builder & public scans).
- Moneycontrol — Free stock research, basic stock screener, market data and watchlists.
- NSEIndia — Official exchange site with free stock/market lists and basic filtering info.
- Tijori Finance — Offers free idea dashboards and basic research portfolio tools.
These fully free alternatives provide accessible tools for stock screening and market research, making it easy for investors to analyze Indian equities without any subscription costs.
What are the Paid Alternatives to Screener?
The paid alternatives to Screener include Strike Money, Tickertape, Trendlyne, StockEdge, Stock Rover, EquitySet, TIKR, Koyfin, GuruFocus, and Trade Brains.
- Strike Money – Premium analytics, advanced scanners and real‑time tools require a subscription.
- Tickertape – Offers paid features for enhanced screening and reports.
- Trendlyne – Premium tier unlocks advanced screeners, analytics and alerts.
- StockEdge – Paid plans for AI pattern scans, advanced tools and insights.
- Stock Rover – Subscription needed for most advanced research and portfolio tools.
- EquitySet – Premium membership for fair value estimates, ratings, and advanced research.
- TIKR – Paid subscription for full access to global financial data, screeners and models.
- Koyfin – Free tier exists, but premium access unlocks significant research and dashboards.
- GuruFocus – Subscription required for deep value metrics, guru portfolios and backtesting.
- Trade Brains – Some premium features and reports are behind paid access.
These paid alternatives deliver deeper analytics, advanced screening, richer data, or special research tools beyond free platforms.
Screener Alternatives with Query-Based Screening
Screener alternatives with query-based screening feature include Strike Money, Tickertape, Trendlyne, Finology Ticker, Chartink, StockEdge, Stock Rover, Koyfin, GuruFocus, and Trade Brains.
- Strike Money – Create custom scans with multiple conditions (price, volume, indicators).
- Tickertape – Custom screener with many filter combinations (fundamentals + technical).
- Trendlyne – Advanced screen builder with user‑defined criteria and many parameters.
- Finology Ticker – Fundamental screener with extensive filter options for valuation/metrics.
- Chartink – Boolean/conditional scans with AND/OR logic (highly customizable).
- StockEdge – Custom scans (combo screens) combining fundamental + technical filters.
- Stock Rover – Equation‑based custom screens with deep metrics and ranking.
- Koyfin – Custom global scanning with multiple filter criteria.
- GuruFocus – Custom growth/value screens with selectable filters and criteria.
- Trade Brains – Fundamental screener with user‑set filters.
These query‑based alternatives offer customizable screening and filtering, making it easier for investors to build tailored stock searches and discover opportunities beyond what standard lists provide.
Screener Alternatives with Backtesting
Screener alternatives with strong backtesting features include Chartink, Trendlyne, StockEdge, Finology Ticker, and Stock Rover.
- Chartink – Backtest your screeners against historical data to validate performance.
- Trendlyne – Run backtests on custom screeners and strategies over historical periods.
- StockEdge – Backtesting available for scans and pattern-based strategies.
- Finology Ticker – Allows historical performance testing of selected screens.
- Stock Rover – Comprehensive backtesting and historical performance analysis for screens and portfolios.
Backtesting helps investors evaluate how a strategy or screen would have performed historically, making these platforms ideal for validating rules-based or long-term approaches.
Screener Alternatives for Stock Traders
Screener alternatives for stock traders are Strike Money, Tickertape, Trendlyne, Chartink, StockEdge, and Finology Ticker.
- Strike Money – Real‑time scanners, technical filters, sentiment & momentum tools.
- Tickertape – Screeners with technical + fundamental filters and market movers.
- Trendlyne – Technical & fundamental screens, options/derivatives tools, signals.
- Chartink – Highly customizable technical scans, pattern filters, backtesting.
- StockEdge – Technical and derivatives scans, AI pattern recognition, sector analytics.
- Finology Ticker – Fundamental and price filters useful for swing trade ideas.
For active traders, tools that emphasize technical scans, patterns, alerts, real‑time feeds, and backtesting are usually more useful than pure fundamental research dashboards.
Screener Alternatives for Forex Traders
Screener alternatives for forex traders are Koyfin, Trendlyne, Tickertape, and StockEdge.
- Koyfin – Provides currency data, FX charts, macro dashboards, and global multi-asset coverage.
- Trendlyne – Shows macro data, indices, and global trends useful for the forex context.
- Tickertape – Offers indices, global market snapshots, and movers linked to FX moves.
- StockEdge – Provides macro insights and trend analytics for forex awareness.
While Koyfin is the best for dedicated forex analysis, others help with context and indirect insights.
Screener Alternatives for Crypto Traders
Screener alternatives for crypto traders are Koyfin, Trendlyne, Tickertape, and StockEdge.
- Koyfin – Offers multi‑asset dashboards, global market data, and customizable charts that crypto traders can use to track market trends and correlation with equities or macro indicators.
- Trendlyne – Has trend tools and broad market screens that can help spot sector momentum relevant to crypto sentiment.
- Tickertape – Provides market movers, trend screens, and heatmaps useful for traders watching risk assets.
- StockEdge – Gives trend analytics and visual screens that can inform broader market sentiment impacting crypto.
These platforms can provide market context and trend insights for crypto traders, though dedicated crypto screening features are limited.
Screener Alternatives for Futures Traders
Screener alternatives for futures traders are Strike Money, Trendlyne, StockEdge, Chartink, and Tickertape.
- Strike Money – Offers Futures & Options analytics, open interest (OI) trends, strategy insights, and derivative‑specific scans.
- Trendlyne – Includes derivatives tools, trend screens, and options data that help with futures strategy decisions.
- StockEdge – Provides technical and derivatives scans, sector trends, and pattern screens relevant to futures.
- Chartink – Strong price/technical scans and patterns, useful for timing futures entries/exits.
- Tickertape – Market movers, screeners, and trend filters can help futures traders gauge momentum.
Futures traders benefit most from derivative metrics, trend filters, OI data, and momentum screens rather than basic fundamental research.
Screener Alternatives for Options Traders
Screener alternatives for options traders are Strike Money, Trendlyne, StockEdge, and Chartink.
- Strike Money – Offers F&O analytics, open interest (OI) trends, strategy tools, volatility insights, and derivatives‑specific scans that help plan option trades.
- Trendlyne – Provides options and derivatives analytics, trend signals, and market filters useful for options setups.
- StockEdge – Includes technical + derivatives scans, pattern recognition, and trend analytics relevant for option timing and setups.
- Chartink – Strong technical screeners and pattern scans that can help identify setups for options entry/exit.
These platforms provide OI data, volatility insights, strategy filters, and derivatives‑oriented analytics rather than purely fundamental research.
Why Should You Look for Screener Alternatives?
You should look for Screener alternatives as the platform might be excellent for fundamental screening, but it lacks certain advanced features that modern investors and traders often need.
Query-Based Screening & Advanced Filters
Screener has limited filtering logic. Platforms like Strike Money, Chartink, Trendlyne, and Stock Rover allow complex conditions, AND/OR rules, and custom metrics for precise stock searches.
Backtesting Strategies
Screener cannot test how screens would have performed historically. Chartink, Trendlyne, StockEdge, Finology Ticker, and Stock Rover provide backtesting to validate strategies over past data.
Technical Analysis & Patterns
Screener focuses on fundamentals, lacking real-time technical patterns. Strike Money, Chartink, StockEdge, and Tickertape offer pattern scans, indicators, and price alerts.
Futures & Options Analytics
Screener doesn’t provide derivatives insights. Strike Money, Trendlyne, StockEdge, and Tickertape track open interest, options data, and derivative trends.
Multi-Asset & Global Market Coverage
Screener is India-focused. Koyfin and TIKR offer global stocks, currencies, and ETFs for diversified research.
Portfolio Tracking & Alerts
Screener has basic watchlists. Strike Money, Tickertape, Stock Rover, and Trade Brains enable portfolio monitoring, alerts, and performance analysis.
These alternatives help investors fill the gaps Screener.in leaves, giving tools for technical, derivative, global, and strategy-focused investing.
What Features Should a Good Screener Alternative Have?
The features that a good Screener alternative should have include what it already offers and also additional features that would improve the trading journey of users.
- Ability to perform comprehensive fundamental screening, covering revenue, profit, ratios, and valuations like Screener.in.
- Support for custom queries and advanced filters, allowing multi-condition screens with AND/OR logic and user-defined metrics.
- Backtesting functionality to test how screens or strategies would have performed historically.
- Technical analysis and pattern recognition, including candlestick patterns, indicators, and trend scans.
- Derivatives and F&O analytics, such as open interest, options data, and futures trends.
- Real-time data, price alerts, and market movers for active monitoring.
- Portfolio tracking, performance monitoring, and notifications.
- Multi-asset and global market coverage, including stocks, ETFs, indices, and currencies.
- Interactive visualization and dashboards, like charts, heatmaps, and scorecards.
- Research tools and reports, providing stock analyses, news, ratings, and insights.
- User-friendly interface with intuitive navigation, customizable layouts, and mobile accessibility for a smooth trading experience.
These features ensure investors and traders can screen, analyze, and act efficiently, combining fundamental research, technical insights, derivatives data, and portfolio management into a single, user-friendly platform.
What is the Best Alternative to Screener?
Strike Money is the best alternative to Screener as it combines comprehensive fundamental screening with advanced technical, derivatives, and backtesting tools in one platform, making it ideal for both investors and traders.
| Feature | Screener.in | Strike Money | Advantages of Strike Money |
| Fundamental Screening | Yes | Yes | Includes more metrics and ratios |
| Technical Analysis | No | Yes | Charts, indicators, pattern scans |
| Custom Query / Advanced Filters | Limited | Yes | Multi-condition, AND/OR logic |
| Backtesting | No | Yes | Test strategies on historical data |
| Derivatives / F&O Analytics | No | Yes | Open interest, options & futures data |
| Real-Time Data & Alerts | Limited | Yes | Live price alerts, market movers |
| Portfolio Tracking | Basic | Yes | Performance tracking, notifications |
| Multi-Asset Coverage | India Stocks | Stocks + ETFs + Global | Global market and multi-asset data |
| Visualization & Dashboards | Limited | Yes | Interactive charts, heatmaps, scorecards |
| Research & Reports | Basic | Yes | Detailed insights, stock reports |
| User-Friendly Interface | Moderate | Yes | Customizable layout, mobile support |


 Previous Article


![15 Investing.com Alternatives [Free+Paid] You Should Use in 2026](https://www.strike.money/wp-content/uploads/2026/04/Investing.com-Alternatives.jpg "15 Investing.com Alternatives [Free+Paid] You Should Use in 2026 196")
![15 TradeStation Alternatives [Free+Paid] You Should Use in 2026](https://www.strike.money/wp-content/uploads/2026/04/TradeStation-Alternatives.jpg "15 TradeStation Alternatives [Free+Paid] You Should Use in 2026 197")
![15 Chartink Alternatives [Free+Paid] You Should Use in 2026](https://www.strike.money/wp-content/uploads/2026/04/Chartlink-Alternatives.jpg "15 Chartink Alternatives [Free+Paid] You Should Use in 2026 198")
: Overview, 10 Types of Indicators, Settings for Different Markets 200")

 : Definition, Formula, calculation, Uses, Advantages Vs limitations 202")


No Comments Yet.