The iCharts review aims to guide traders and investors looking for an analytics platform in choosing or skipping the platform based on the benefits or challenges it has to offer. In this iCharts review, you will come across the features, benefits, challenges, and the pricing structure of the platform.
The iCharts review has not been framed based on the reviews of random users, but on my personal experiences that I gathered while exploring it. Here, I will also bring to you some use cases that will give you a practical understanding of how this platform works.
What is iCharts?
iCharts is a data analytics platform that has a user-friendly interface and real-time data updates to offer to traders and investors, who are its ultimate users. ICharts provides a list of assets, including stocks, commodities, and forex, and reflects real-time market data for all of them. According to Semrush, iCharts’ website recorded around 124.37K visitors in October 2025, a significant figure that demonstrates the platform’s data is reliable.
While many analytics platforms enable traders/investors to have data for both fundamental and technical analyses, iCharts mainly encourages the latter. I have been into swing trading and long-term investing, both, and the iCharts datasets have been useful in both instances for me.
 2026: Features, Pros vs Cons, Pricing, Reviews, Is It Worth It? 81")
As a swing trader, I keep an update of every movement in the stock prices, which somehow allows me to be aware of the company’s performance, thereby helping me decide whether to be involved in a long-term investment with it. For me, it has worked like that.
If you are more comfortable using its chart types and analysis tools for technical analysis, you can always do so. iCharts allows its users to trade directly from the option chain through broker integration, along with giving access to ultra-paced API and helping leverage advanced options analysis tools.
The major challenge that you might face as an iCharts user is its restricted features. If you are not a premium user on the platform, you will not be able to access the advanced tools and features the platform has. Plus, the real-time data updates also get delayed as a standard plan user, which is something I personally observed before going premium.
Verdict
Overall rating – 3/5
As a swing trader, I’ve been able to book profits more consistently thanks to the real-time data provided by iCharts.
With iCharts, traders and investors can access technical analysis tools and features to perform advanced stock analysis before investing. The real-time insights and business tool integration allow users to analyze company data thoroughly so that they know the pros and cons of investing in or trading them.
 2026: Features, Pros vs Cons, Pricing, Reviews, Is It Worth It? 82")
The specialized charting tools help traders to generate options, futures, and spread charts to identify the gaps and opportunities that can be easily encashed. iCharts has even more advanced features, like WordPress plugins, for traders/investors who are technically sound. This plugin enables them to create interactive charts using shortcodes.
While the technical tools make the platform suitable for all your trading and investment needs, the challenge is their accessibility. Yes, if you are a basic plan holder, you will hardly have access to iCharts’s advanced features. In short, you have to be a premium user to leverage the platform.
Key Features
The six quick key features to consider before deciding whether to sign up for iCharts range from chart creation to advanced technical tools.
- Chart creation and customization: The platform helps traders/investors create charts and generate customized ones based on their chosen designs and elements.
- Chart visualization: As iCharts users, you can view charts the way you want to visualize data in a better way. The platform supports pie, bar, line, and radar charts.
- Chart sharing: There are plugin features that allow chart sharing.
- Real-time data updates: The platform is known for sharing instant updates whenever new movements in trends and patterns are observed in the market. Though the updates have been reportedly delayed for basic product plan users, the same has been accurate and reliable for iCharts premium users.
- Alerts and notifications: Not exactly like alerts when custom criteria for a stock are met, but this alert works whenever a phrase matches what the users have been searching for or looking for.
- Advanced technical tools: iCharts comes with advanced tools to enable users to carry out technical analysis. Some such tools include Straddles/Strangle charts, iron condor/iron fly, butterfly, spreads, etc.
By now, you might have obtained an idea about where you can leverage iCharts and what it is not meant for. But before you conclude anything, I have a lot more details to share. Let’s check.
iCharts Advantages
The seven advantages that will make you choose iCharts every time you decide to invest include everything from the specialized tools to the third-party integrations that it offers.
- The platform comes with specialized tools and features specifically designed for the Indian market.
- It provides integration with third-party platforms to ensure proper trade execution.
- iCharts keeps coming up with attractive offers for users.
- It allows traders/investors to convert complex data into interactive charts. You can also include animations for a better view or readability.
- iCharts allows users to collaborate and use created and shared dashboards and reports across the platform.
- iCharts make charts compatible across different browsers and platforms by generating them using HTML5/SVG.
- Charts can be customized using various colors and animations available on the platform, making them more easily readable and interpretable.
Besides advantages, iCharts also have some disadvantages that traders/investors must know about before they decide to select or deselect iCharts as an option.
iCharts Disadvantages
The three disadvantages that might make you rethink choosing iCharts include restricted streaming of charts, no drawing tools, and the absence of line replication tools.
- Charts don’t stream in real time during market hours, limiting timely trading decisions.
- Lacks essential drawing tools, making technical analysis and chart marking difficult.
- Drawn lines don’t replicate across timeframes, hindering multi-timeframe pattern analysis.
Now that I have shared the features, advantages, and disadvantages of using iCharts, isn’t making a decision easier? To some extent, right? Let’s check out more details next.
Overall Summary
Overall Rating: 3/5
iCharts delivers solid technical analysis tools and real-time charting capabilities, but the delayed data for non-premium users and the limited drawing tools reduce its efficiency for serious traders. Its value increases significantly only when you upgrade to a premium plan.
| Feature | Rating (out of 5) | Notes |
| Real-Time Data Accuracy | 3/5 | Accurate for premium users; delayed for basic plan (~1.5 min price, ~4.5 min OI). |
| Analytics & Charting Tools | 4/5 | Strong options analytics, straddle/strangle charts, spreads, IV/Greek tools; lacks advanced drawing tools. |
| User Interface & Ease of Use | 3/5 | Simple and functional; limited drawing tools add to the learning curve. |
| Customization Options | 3/5 | Indicator templates can be saved; colors & parameters customizable, but no line replication across timeframes. |
| Pricing & Value for Money | 3/5 | Affordable, but no free trial; delayed-data plans limit effectiveness for active traders. |
| Broker Integration | 4/5 | Smooth execution with TRADEJINI, Upstox, Angel One, FYERS; zero API charges. |
| Customer Support | 3/5 | Reliable but limited, mostly Telegram-based support and email phrase alerts. |
| Platform Reliability | 2/5 | Mixed reviews with some reports of crashes and lag during high volatility. |
| Suitability for Beginners | 3/5 | Beginners can use it, but require time to adapt; documentation helps. |
iCharts Pricing Structure
iCharts offers subscription plans for its delayed (non-live) tools, with data updating every ~1.5 minutes. All plans provide access to the same set of features: straddle/strangle charts, spread charts, option chains, futures/options charts, IV (implied volatility) metrics, and futures OI buildup. The only difference between plans is the subscription duration, with more extended plans offering cost savings.
| Plan | Price (₹) | Included Features |
| 7-Day Trial | 199 | Straddle/Strangle Charts; Spread Charts; Option Chain; Futures/Option Charts; IV, IV-HV, IVP, IVR Charts; Futures OI buildup |
| Monthly | 599 | Same as above |
| Quarterly | 1,600 | Same tools + ~10% savings compared to the monthly |
| Half-Yearly | 3,000 | Same tools + ~15% savings |
| Yearly | 5,700 | Same tools + ~20% savings |
Who is iCharts for?
iCharts is designed for options traders, swing traders, individual investors, and financial analysts.
- Options traders: iCharts helps options traders with detailed option chains, IV charts, and OI analytics to plan and refine their trading strategies.
- Swing traders: As a swing trader myself, I know how well it enables us to identify medium-term market trends and price patterns through clear, data-driven charting tools.
- Individual investors: The platform supports individual investors by simplifying market data and offering easy-to-understand charts for more intelligent investment decisions.
- Financial analysts: iCharts provides financial analysts with structured market insights and analytical tools to support deeper research and informed market evaluations.
If you are below 18 or someone who is not ready to take accountability for the trade losses, iCharts is not for you.
iCharts Customer Support Concerns
When it comes to iCharts customer support concerns, there are no significant complaints from users. However, one restriction that the platform poses on traders/investors is the limited communication channel.
- For technical issues, iCharts relies on a Telegram channel instead of more common support methods like phone or live chat.
- The phrase alerts that iCharts generates go to email Inboxes, which users are more likely to miss.
I personally have no complaints from the customer support team. However, if you want to check it for yourself, you can connect with the team through the iCharts Help page.
What are iCharts’s Review Ratings from Review Sites?
| Platform | Rating | Review Summary |
| ScamAdviser | — (Trust score) | Deems icharts.in “relatively high score” for legitimacy; uses SSL and has been around long. |
| Five.Reviews | 3.54 / 5.00 | Mostly negative remarks: issues with chart accuracy, crashes, and poor UX. |
ZeroBrokerageClub | No rating disclosed | Appreciates ease-of-use, but criticizes charting as “not as user-friendly and intuitive” compared to other platforms. |
What are the Core Features of iCharts?
The core features of iCharts can be broadly classified under two categories: Data analytics and data visualization.
Data analytics
Data analytics in iCharts focuses on helping users interpret raw information to uncover trends, insights, and patterns. The platform simplifies data exploration through interactive tools and automated elements that make analysis faster and more intuitive.
 2026: Features, Pros vs Cons, Pricing, Reviews, Is It Worth It? 83")
- Interactive interface: iCharts makes it easy for users to explore and work with data without needing any technical skills.
- Real-time insights: It provides instant, continuously updated data for timely decision-making.
- Inbuilt templates: The platform offers pre-designed layouts to speed up analysis and reduce manual work.
- Drag-and-drop elements: It allows seamless report and chart building with simple drag-and-drop actions.
Data visualization
iCharts’ data visualization enables users to transform complex data into easy-to-understand charts and reports. The focus is on clarity, simplicity, and visual depth so users can interpret information quickly and accurately.
 2026: Features, Pros vs Cons, Pricing, Reviews, Is It Worth It? 84")
- Chart interface: The platform supports different chart types to present data in visually meaningful formats.
- Report creation: It helps users compile visuals, insights, and metrics into structured, presentation-ready reports.
The features mentioned above is what iCharts is known for. Now that you know these, you also know if iCharts is for you.
Supported Markets and Assets on iCharts
Supported Markets
- Focused on Indian markets, primarily using data from NSE.
- Offers tools built for NSE equity F&O and NSE currency F&O.
Supported Assets
- Equities (F&O): Provides charts for equity futures and options.
- Currency Derivatives: Supports NSE currency futures and options.
Broker Integration and Trading Execution of iCharts
The supported brokers provide similar access to TradingView charts, real-time tools, and option-chain trading. All integrations come with zero API charges and guided setup.
- TRADEJINI: Completing 50 trades in a month gives users a free next-month iCharts subscription.
- AC Agarwal: Traders completing 200 trades monthly receive a free iCharts subscription for the next month.
- Upstox: Due to API restrictions, only two live tools work at a time. For Upstox Plus users, however, five tools work at a time.
- Angel One & FYERS: Integration is simple through the step-by-step guide provided by iCharts.
The trade execution framework is simple if you follow the guide correctly. You can execute trades by syncing your brokerage account with your iCharts login. You can check updates and initiate trades from the platform itself, utilizing the integrations offered.
iCharts’s User Interface & Learning Curve
The iCharts interface is web-based and mobile-compatible, making it accessible without needing a dedicated app.
- Its charting tools are powerful and flexible. Users can add technical indicators from a toolbar, customize their settings, and save templates for repeated use.
 2026: Features, Pros vs Cons, Pricing, Reviews, Is It Worth It? 85")
- Customizing and managing indicator templates is straightforward, but drawing tools are limited.
 2026: Features, Pros vs Cons, Pricing, Reviews, Is It Worth It? 86")
- Overall, the interface strikes a balance between simplicity and functionality. It is relatively easy to pick up, but mastering all tools, like indicator settings and template saving, may take some time.
 2026: Features, Pros vs Cons, Pricing, Reviews, Is It Worth It? 87")
Complex features, like the limited drawing tools, add to the learning curve for users who rely heavily on drawing trend lines. But the support that comes from the iCharts team in the form of tutorials and documentation makes the journey easier for traders and investors.
iCharts Company Details
- Company Type: Private
- Headquarters: Hyderabad, India
- Year Founded: 2007
- Owner: Srikanth Bhagavat
- Number of Employees: 9-50
- Number of Users: Not publicly disclosed
- Company Description: iCharts, which started as a business intelligence firm, turned into a financial data analytics company, helping traders and investors refer to it for advanced stock analysis. iCharts also offers extensive market-depth data, derivatives analytics, and customizable screeners that cater to both beginner and advanced market participants. In addition, it also enables institutions to check the displayed features to assess their own as well as their competitors’ current status and performance. Starting from charting tools to having support for various financial models and strategies that help users make wise trading and investment decisions, iCharts has it all.
Top iCharts Alternatives
Are you looking for more versatile data visualization or advanced charting flexibility than what iCharts provides? These platforms offer more robust analytical tools and intuitive design features to help you transform complex market data into clear, actionable insights.
| Platform | What It Offers Beyond iCharts | Ideal For |
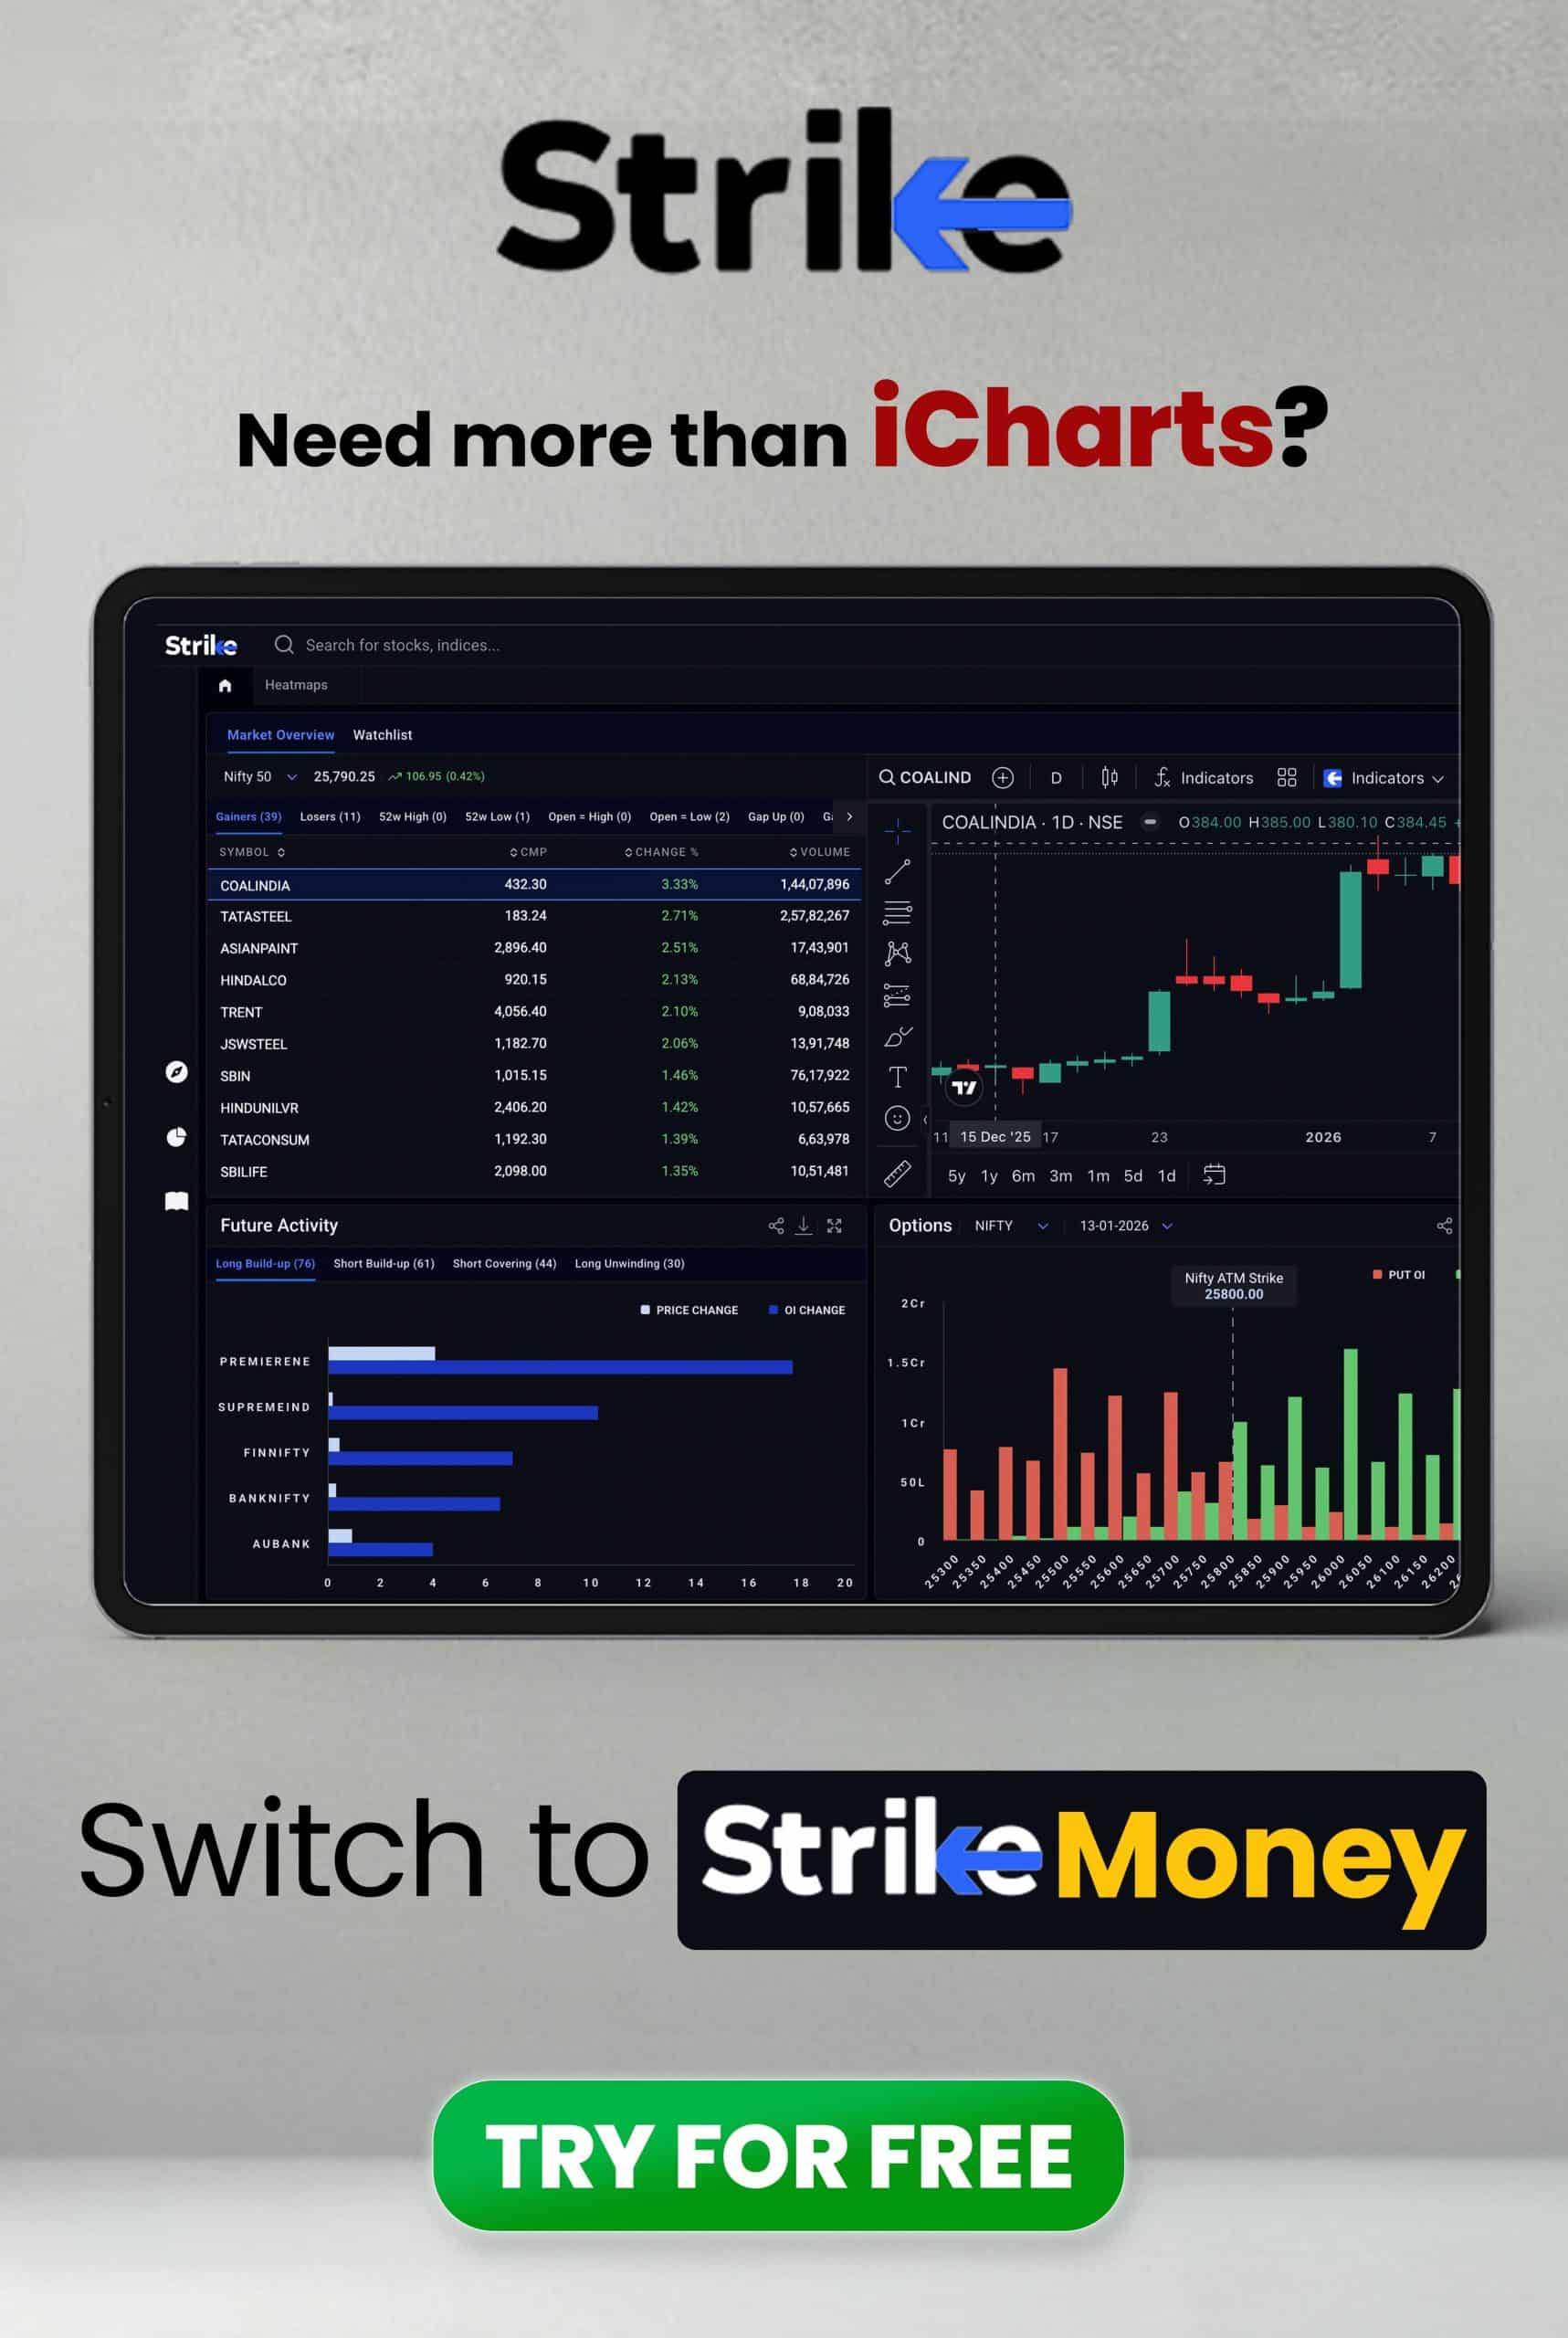
| Strike Money | Deep analytics with real-time option chain, IV charts, Greeks, backtesting, strategy builder, and payoff graphs. | Traders who rely heavily on quantitative insight and want a full strategy-analysis ecosystem. |
| Sensibull | Strategy builder, virtual (paper) trading, multi-leg payoff diagrams, OI & IV charts, and broker integration, as highlighted in our Sensibull review. | Beginners to intermediate options traders wanting strong visualization plus practice before real trades. |
| QuantsApp | Extensive analytics (100+ tools), real-time order-book view, strategy optimiser, backtesting, Greeks & volatility surface, as detailed in our QuantsApp review. | Quant traders and serious options traders looking for deep, data-driven analysis. |
| Opstra (Definedge) | Strategy builder, payoff calculator, backtesting, volatility surface, detailed analytics, and support for simulations, as highlighted in our Opstra (Definedge) review. | Traders who want an advanced analytics platform specifically for options strategy design and historical testing. |
| OptionX | Ultra-fast execution (X-Trader), single-screen interface, one-click strategy execution, strategy backtesting, and positional adjustments. | High-frequency traders, scalpers, and professional options traders who prioritise speed and precision. |
| Stolo | 25+ analysis charts (OI, IV, Greeks), multi-strike OI analysis, real-time option chain, strategy builder, and community-driven tools. | Traders who want a powerful all-in-one analysis + execution platform built around open interest and market sentiment. |
Is Strike Money the Best Alternative to iCharts?
Yes, Strike Money is the best alternative to iCharts for options traders who want more depth while analyzing data before making trading/investment decisions.
| Feature / Parameter | Strike Money | iCharts |
| Data Latency | Real-time/live analytics | Delayed: ~1 min 30 sec for price/volume, ~4 min 30 sec for OI |
| Option Chain & Greeks | Full real-time option chain + Greeks (Delta, Gamma, Theta, Vega, Rho) | Option chain + IV analytics, but limited Greeks coverage |
| Strategy Tools | Strategy builder, backtesting, payoff visualization, simulation | Charts (straddle/strangle, spread), but a less advanced strategy simulation |
| Scanners & Indicators | Scanners, heatmaps, sentiment, RRG, diffusion indicators, etc. | Standard chart indicators; focused more on charts than sentiment scanning |
| Pricing (Monthly) | ₹650 / month for Pro plan | ₹599 / month for the delayed-data plan |
| Best For | Traders focused on deep analysis, backtesting, and strategy design | Traders who need charting, IV / OI insights, but can work with a higher data delay |
Is iCharts Worth It?
iCharts can be worth it, but to what extent will depend on what you need from it.
If you are someone looking for a basic plan to try the features first and then upgrade to the premium version, let me tell you, there is no free trial available. Plus, whatever you pay will be non-refundable.
When I used it as a swing trader by paying the minimum amount required, I observed the data updates, which were promised to be real-time time were delayed. This hampered my trades to a significant extent initially. However, once I knew the time taken for updates to get reflected, I started working accordingly.
 2026: Features, Pros vs Cons, Pricing, Reviews, Is It Worth It? 88")
Hence, if you are ready to give time to adjust to how the platform works, you can go for it. If you are intolerant of delayed updates, you can look for other options too.
However, before coming to any conclusion, try it for once by paying ₹199. Explore it for seven days. Check if it works. The tools are worth every penny – this is something I can assure you.
FAQs about iCharts
Is iCharts Free to Use?
No, iCharts is not entirely free to use. You can sign up for a 7-day paid trial by paying ₹ 199 for its delayed-data tools.
Is iCharts Safe and Secure?
Yes, iCharts is relatively safe and secure as it uses a valid SSL certificate to encrypt data coming in and out. ScamAdviser gives the domain a “relatively high” trust score, indicating it’s very likely legitimate.
Can a Beginner Use iCharts?
Yes, a beginner can use iCharts, but there will be a learning curve. The platform is web-based and offers a dedicated FAQ section for functionality and usage. While its suite of analytics tools is robust, new users may need some time to get comfortable navigating the charts, customizing indicators, and understanding delayed data.
Is There a Mobile App for iCharts?
No, there is no mobile app for iCharts, but the website is mobile-friendly.
Is the iCharts Interface Customizable?
Yes, iCharts’ interface is customizable. You can add technical indicators and tweak their settings using different colors and parameters via the chart toolbar. You can then save your indicator setup as a template through the Save Studies & Prefs” button so that it can be reused across charts.


 Previous Article


![15 Investing.com Alternatives [Free+Paid] You Should Use in 2026](https://www.strike.money/wp-content/uploads/2026/04/Investing.com-Alternatives.jpg "15 Investing.com Alternatives [Free+Paid] You Should Use in 2026 100")
![15 TradeStation Alternatives [Free+Paid] You Should Use in 2026](https://www.strike.money/wp-content/uploads/2026/04/TradeStation-Alternatives.jpg "15 TradeStation Alternatives [Free+Paid] You Should Use in 2026 101")
![15 Chartink Alternatives [Free+Paid] You Should Use in 2026](https://www.strike.money/wp-content/uploads/2026/04/Chartlink-Alternatives.jpg "15 Chartink Alternatives [Free+Paid] You Should Use in 2026 102")
: Overview, 10 Types of Indicators, Settings for Different Markets 104")

 : Definition, Formula, calculation, Uses, Advantages Vs limitations 106")


: How We Used This 70/30 Indicator in 6 High Win-rate Strategies 111")


No Comments Yet.