The moving average crossover is one of the most popular technical signals that simplifies the complex price action into clear and actionable signals. Moving average crossover helps traders to determine the direction of the trend, filter noise, and remain in line with the momentum without complicating their analysis.
It is popular due to its versatile nature, i.e., it can be used in intraday, swing, and long-term trading, and it can be adjusted to fit various markets such as equities, forex, and crypto. Along with this, it offers both structure and discipline, eliminating emotional decision-making and making traders stay within good trends.
What is a Moving Average Crossover?
A moving average crossover is a technical analysis signal that occurs when the two moving averages of different period lengths cross each other on a price chart. This signal is used by trend-following traders to identify shifts in market momentum.

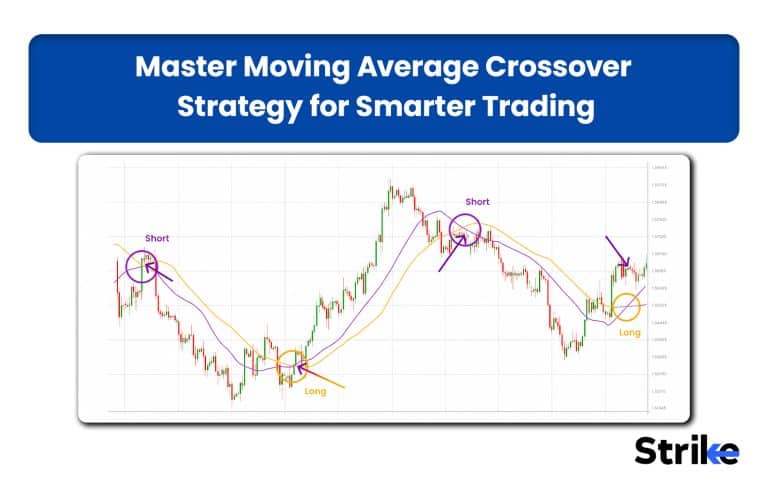
- Bullish Crossover: When the short-term period moving average crosses above the long-term period moving average, it signals a shift in market momentum from bearish to bullish.
- Bearish Crossover: When the short-term period moving average crosses below the long-term period moving average, it signals a shift in market momentum from bullish to bearish.
Not every crossover led to a strong trending move. In sideways markets, crossovers can generate frequent false signals (whipsaws), making market context crucial before acting on them.
How Does the Moving Average Crossover Work?
A moving average works by smoothing out the price movements and giving a clear signal of the trend and shift in the market trend. A short-term moving average (like 9 EMA or 20 EMA) reacts quickly to price changes compared to a long-term moving average.
When the short-term moving average starts increasing, it suggests that the recent price is increasing faster than the historical average. This indicates the gaining of control by buyers. Conversely, when the short-term moving average starts falling, it indicates that the recent price is falling faster than the historical average, suggesting seller control.
What are the Types of Moving Averages Used in Crossovers?
There are four main types of moving averages used in crossovers. These moving averages are SMA, EMA, and WMA.
- SMA (Simple Moving Averages): It calculates the average closing price of the asset over the fixed period. It gives equal weight to all the closing prices.
- EMA (Exponential Moving Average): Exponential Moving Average calculates the average closing price of the asset by giving more weight to the recent closing price over the fixed period. It responds to the price change fast compared to SMA.
- WMA (Weighted Moving Average): It calculates the average by assigning linearly increasing weights to recent prices, meaning the latest price has the highest weight, but in a more balanced way than EMA.
The types of moving average used directly affect the crossover signal because of their different responsiveness. SMA reacts slower to price movement, while EMA and WMA react faster but are also more sensitive to noise.
What are the Most Popular Crossovers?
There are different crossovers used by traders depending on their trading style, but few of them are very popular and commonly used by traders and institutions. These popular crossovers are the golden cross, death cross, 3 moving average cross, and 20, 50, & 200-day crossover.
1.Golden Cross
The golden cross is the most commonly used bullish crossover signal in technical analysis, which uses the 50-day moving average as a short-term moving average and the 200-day moving average as a long-term moving average.

When the 50-day moving average crosses above the 200-day moving average, it results in a Golden Cross, suggesting a long-term shift in a market phase from bearish to bullish. This Golden Cross is widely tracked by institutions and large investors as a major trend confirmation signal.
2.Death Cross
A death cross is a well-known bearish signal of the potential start of a longer downtrend. A death cross occurs when the 50-day moving average crosses below the 200-day moving average.

The Death Cross is also of a lagging nature; by the time it appears, the market has often already fallen significantly. Interestingly, many stocks recover relatively fast after a Death Cross, giving long-term traders an investing opportunity despite the initial bearish signal. Even though you may want to short the market, avoid doing so immediately after the cross; instead, wait for the price to pull back to its 50-day moving average.
3. Moving Crossover
A three-moving-average crossover is an advanced version of a normal moving-average crossover that combines three moving averages instead of two. Three moving average crossovers improve the accuracy and reduce the false signals.
It combines a short-term, a medium-term, and a long-term moving average. 10, 20, and 50 are commonly used combinations.

- Bullish Trend: When the short-term moving average crosses above the medium-term moving average and both moving averages stay above the longer-period moving average, it suggests a bullish trend.
- Bearish Trend: When the short-term moving average crosses below the medium-term moving average and both moving averages stay below the longer-period moving average, it suggests a bearish trend.
It gives a clean trend structure and filters out sideways market noise. However, it gives late signals compared to two moving average crossovers, leading to fewer traders.
4. 20, 50 & 200-Day Crossover
It is also a triple moving average crossover strategy that uses 20, 50 & 200-day crossovers. It’s widely used to identify strong, sustained trends while avoiding noise.

It’s comparatively more lagging than the 10, 20, and 50 crossovers but works best for swing and positional trades.
How to Trade Using Moving Average Crossover Strategy
There are seven major steps to trading moving average crossovers. These steps are briefly discussed below.
- Identify the Market Condition: The moving average crossover strategy works best in a trending market. Look for a trending market by marking clear higher highs/lows or lower highs/lows. Avoid choppy markets or lower timeframes to reduce false signals.
- Select the moving average pair: Based on the style of trading, the periods of the short-term and long-term moving averages differ.
| Trading Style | Fast MA | Slow MA | Type |
| Scalping | 5-period | 20-period | EMA |
| Swing Trading | 10-period | 50-period | EMA/SMA |
| Position Trading | 50-period | 200-period | SMA |
| Classic Long-term | 50-day | 200-day | SMA |
- Identify the crossover signal: A bullish signal appears when the short-term moving average crosses above the long-term moving average. A bearish signal appears when the short-term moving average crosses below the long-term moving average. Avoid entering trade immediately after the crossover.

- Confirm the Signal: Check whether the price is breaking the recent high or recent low after the crossover. Also use indicators like volume or RSI (above 50 for bullish crossover and below 50 for bearish crossover) to further strengthen the confirmation.

- Entry: There are two common ways to enter crossover trades: aggressive entry and conservative entry. Aggressive traders can enter trade immediately after a crossover, whereas conservative traders can enter after a small pullback to the moving averages.

- Stop-loss: Place the stop-loss below or above the recent swing high or low or below the slow moving average.

- Exit: Aim for the next important support or resistance for the target. Trail the stop-loss along with the short-term moving average.
Hence, a moving average crossover is more for momentum shift identification rather than a buy and sell trigger, particularly when Volume and RSI are not yet in alignment. To truly validate a move, traders look for confirmation in Volume and a trend-supporting signal from the RSI before executing a trade.
Best Moving Average Crossover Settings
The moving average crossover settings vary based on the period of holding the position. The settings for different market trends are briefly discussed below.
Short-term Trading
In short-term trading, fast moving averages are best since they react with the price, helping give early signals. The most commonly used EMAs by traders are the 9 and 21 EMAs or the 5 and 20 EMAs, as they respond quickly to price change and help capture short momentum bursts. In Intraday Trading and Scalping, these setups produce more false signals, so it is crucial to combine them with momentum filters such as RSI. Successful execution in Intraday Trading or high-speed Scalping requires this extra layer of confirmation to filter out market noise and improve the win rate.
Swing Trading
In the case of swing trading, the aim is to ride the medium-term trend without noise. The most popular settings are 20 & 50 EMA/SMA, as they offer a moderate pace of speed and reliability. These environments assist traders in Swing Trading to remain in a trend for a few days to weeks whilst minimizing unwarranted whipsaws. By focusing on these setups, those engaged in Swing Trading can capture broader market moves without being shaken out by short-term volatility.
Long-Term Investing
For long-term investing, slower moving averages, which are used to determine the major trends in the market, are preferred. The 50 & 200 SMA crossover (Golden Cross / Death Cross) is widely used by investors. It removes short-term volatility and concentrates on big trend changes, which makes it ideally suited to positional trading and choices related to a portfolio.
Equity Market
The price movements are relatively smoother in the equity market than in other markets. Swing trading involves the use of 20 and 50 EMAs. Long-term trends are usually determined using 50 and 200 SMA. These environments are consistent with institutional activity and market cycles in general.
Forex Market
The forex market is a very liquid, volatile, and fast-moving market; hence, a faster moving average suits the forex market more. The 9 and 21 EMA or 20 and 50 EMA are commonly used as traders can react to price fluctuations with great speed and capture short- to medium-term trends of currency pairs.
Crypto Market
The crypto markets are highly volatile and need highly reactive indicators. 9 and 21 EMA or 13 and 50 EMA are the most effective settings, as they help to capture the rapid shifts in trends. However, due to high noise, apply supplementary filters to prevent false signals.
Indices (Nifty, Bank Nifty, etc.)
The indices have regular patterns that are controlled by macro factors. Swing trades are commonly done on 20 & 50 EMAs, and longer-term trends are usually done on 50 and 200 SMAs. These settings are effective since indices usually reflect long-term directional changes once a trend sets in.
Best Stock Screener for Moving Average Crossover Signals
Strike Money, Chartink, Screener, TradingView, and Finviz. They are some of the most popular stock screeners for moving average crossover signals. These screens pick out hundreds or thousands of stocks and find where the shorter periods’ moving average, such as 9, 20, or 50, has just crossed the longer periods’ moving average, such as 21, 50, 100, or 200, thus providing traders with an indication of whether it was a buy or sell.
Benefits vs Risks of Moving Average Crossover Strategy
The benefits and risks of the moving average crossover strategy are discussed below in the table.
| Aspect | Benefits of Moving Average Crossover Strategy | Risks of Moving Average Crossover Strategy |
| Trend Identification | Helps traders easily identify bullish and bearish trend changes. | Can give false trend signals during sideways markets. |
| Simplicity | Easy to understand and suitable for beginners. | Oversimplicity may ignore market context and price action. |
| Entry & Exit Signals | Provides clear buy and sell signals through crossovers. | Signals often come late because moving averages are lagging indicators. |
| Noise Reduction | Filters short-term market fluctuations and smooths price movement. | Excessive smoothing may delay reactions to sharp reversals. |
| Works in Trending Markets | Performs well during strong directional trends. | Performs poorly in choppy or range-bound conditions. |
| Emotional Discipline | Reduces emotional trading by following rule-based signals. | Blindly following signals can lead to overtrading. |
| Versatility | Can be applied across stocks, indices, forex, and commodities. | Different assets require different MA settings, increasing optimization risk. |
| Multi-Timeframe Usage | Useful for swing trading, positional trading, and investing. | Shorter timeframes produce frequent whipsaws and fake crossovers. |
| Dynamic Support & Resistance | Moving averages often act as support or resistance zones. | Price may temporarily break MA levels and trap traders. |
| Combination with Indicators | Works effectively with RSI, MACD, volume, and price action. | Using crossover alone without confirmation lowers accuracy. |
A moving average crossover strategy is powerful not because it predicts the market first, but because it helps traders stay aligned with the market trend longer than emotions usually allow.
How to Avoid False Signals from Moving Average Crossovers?
Trade Only in Trending Markets: Avoid trading moving average crossovers in sideways or low-momentum markets. Price should form a clear trending structure by making higher highs/lows or lower highs/lows.
- Confirm with Higher Timeframe: Always align the crossover with a higher timeframe. If a price is forming a bullish crossover on the hourly chart, but the daily timeframe is in a downtrend, the crossover is most probably weak.
- Combine with Price Action: Align the crossover with the market context. After a crossover, if the price is breaking a key support or resistance level, it adds more value to crossovers.
- Combine Other Indicators: Use momentum indicators like RSI (above 50 for bullish crossover and below 50 for bearish crossover) or crossover with good volume.
A common strategy in Swing Trading is to enter on a retest; wait for price to pull back to the moving average and enter only when it bounces from it. This disciplined approach to Swing Trading ensures that entries are made at more favorable prices with a clear level for risk management.
Is Moving Average Crossover Profitable?
Yes, moving average crossovers is profitable, but only when used with the right context. Moving average crossover is a trend-following system, and profitability comes from capturing a big trend instead of frequent wins.
The moving average crossover is more profitable when you allow trades to run until trends change in a trending market with proper risk management. Even a 40-50% win rate can generate consistent profit in such conditions. Avoid trading sideways or in a choppy market.
What is the Success Rate of Moving Average Crossover?
The success rate of moving average crossovers is not fixed. It varies a lot by market, timeframe, and the exact MA settings. However, we do have real backtested ranges and research-backed insights.
According to JournalPlus backtest, moving average crossover strategies usually have a 40%–55% win rate. If moving average crossover is executed with specific market criteria, the win rate can be increased. A backtest result by TradingZenith on 9/21 EMA crossover showed around a 62% win rate in specific market conditions on Nifty and Forex.
How to Backtest Crossover Strategy?
There are two main methods to do backtesting of crossover strategies. These two methods are manual and automated. In the manual method, traders use historical price charts, whereas in automation, traders use programming languages like Python to backtest.
- Define the Strategy: Select the moving averages pair (20 & 50 EMA or 50 & 200 SMA) and define the timeframe, the entry criteria (buy on bullish crossover and sell on bearish crossover), exit criteria, reentry, and stop loss.
- Select Historical Data: For manual backtesting, use TradingView for charts, multiple timeframes, and the bar replay feature to simulate past price action. For automated backtesting using Python, use yfinance and pandas.
- Run the Backtest: Run the backtest and record the entry, exit, stop-loss, risk-to-reward, and market conditions.
- Analyze Key Metrics: The key metrics to analyze after the backtest result are mentioned below in the table.
| Metric | What It Means | Why It Matters | Example |
| Win Rate (%) | Percentage of trades that are profitable | Shows how often you win, but doesn’t guarantee profitability | 40% win rate = 4 wins out of 10 trades |
| Risk-to-Reward (RR) | Profit potential vs loss per trade | Core driver of profitability | 1:2 RR → Risk ₹100 to make ₹200 |
| Maximum Drawdown | Largest drop from peak capital | Measures risk and psychological pressure | ₹1,00,000 → ₹80,000 = 20% drawdown |
| Expectancy | Average profit per trade | True measure of strategy edge | Positive expectancy = profitable system |
Now, there are multiple backtesting software options available that make the process much easier. You simply need to define your strategy rules, and the software will automatically simulate trades on historical data, generate performance metrics, and help you quickly evaluate whether your strategy has a real edge.
Is the Moving Average Crossover a Lagging Indicator?
Yes, moving average crossover is a lagging indicator because the moving average itself gets calculated based on past price data. Hence, when crossover occurs, the move has already started. The crossovers simply confirm the trend instead of predicting it. The longer the period of the moving average, the more delay occurs in the crossover.
However, the crossover can be used professionally by combining it with a leading indicator or price action. Moving average crossovers also help traders to avoid false early entries.


 Previous Article


![15 Investing.com Alternatives [Free+Paid] You Should Use in 2026](https://www.strike.money/wp-content/uploads/2026/04/Investing.com-Alternatives.jpg "15 Investing.com Alternatives [Free+Paid] You Should Use in 2026 40")
![15 TradeStation Alternatives [Free+Paid] You Should Use in 2026](https://www.strike.money/wp-content/uploads/2026/04/TradeStation-Alternatives.jpg "15 TradeStation Alternatives [Free+Paid] You Should Use in 2026 41")
![15 Chartink Alternatives [Free+Paid] You Should Use in 2026](https://www.strike.money/wp-content/uploads/2026/04/Chartlink-Alternatives.jpg "15 Chartink Alternatives [Free+Paid] You Should Use in 2026 42")


 : Definition, Formula, calculation, Uses, Advantages Vs limitations 46")


 50")


No Comments Yet.