A bearish flag pattern is one of the most used trend continuation chart patterns amongst traders to identify the temporary consolidation and trend continuation. A bearish flag pattern often appears before the next momentum driven move starts. This makes this pattern valuable for swing traders, positional traders and intraday traders.
By understanding how a bearish flag pattern forms and works, it will help you to distinguish healthy pullbacks from genuine trend reversals and will improve trade timing, risk management, and profitability.
What is a Bearish Flag Pattern in Technical Analysis?
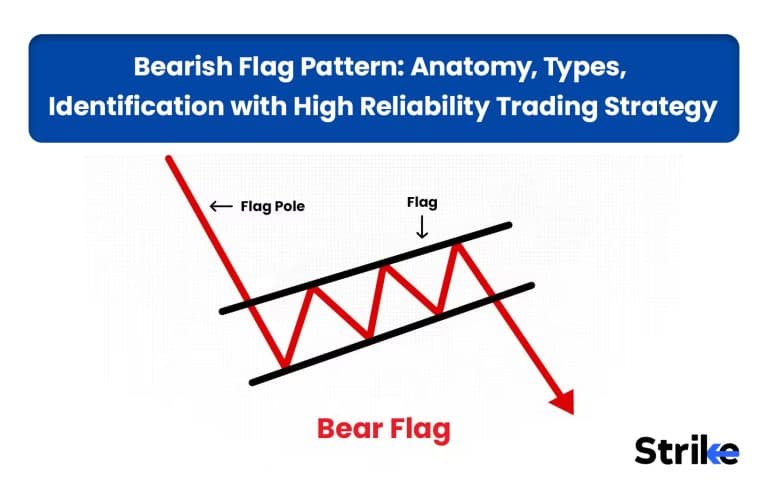
A bearish flag pattern is a bearish trend continuation chart pattern used in technical analysis that represents brief consolidation before the continuation of downtrend. This pattern is called flag because it resembles the shape of flag on a pole, where a sharp decline represents a flag pole formation and consolidation represents flag. Traders use this pattern to participate in an ongoing trend.
Is the Bearish Flag pattern a Reversal or Continuation Pattern?
A bearish chart pattern is a trend continuation chart pattern that suggests a temporary pause in an ongoing downtrend, after which the price is likely to continue its downtrend. The flag or the consolidation in this pattern suggests that the sellers are preparing or distributing again to push prices lower.
Anatomy of a Bearish Flag Pattern
The bearish flag pattern consists of three key components. The components are flag pole, flag, and breakout.

- Flag Pole: A strong price move in downward direction driven by strong selling forms a nearly vertical pole like structure.
- Flag Formation: A short-term retracement or a consolidation after a strong downward price move forms the flag. The consolidation in flag formation usually moves in a parallel channel, sloping upward.
- Breakout: Breakout is the point where the price breaks the lower level of the parallel channel after consolidation, in order to continue the ongoing downtrend.
During the formation of flag patterns, the volume usually contracts or reduces during sideways consolidation, meaning that the buying pressure is weak and sellers are still dominant.
Psychology Behind the Bearish Flag Pattern
The psychology of the bearish flag pattern reflects the battle between profit-booking sellers and bargain-hunting buyers. After a strong downwards trending market (flag pole), many short traders exit their positions to book profit. However, their buying pressure is not enough to drag the market up, where strong sellers absorb this buying pressure in anticipation of future fall, creating the consolidation zone. As soon as the strong sellers take over, price breaks below the consolidation and trend again starts moving in downwards direction.
Types of Bearish Flag Patterns
There are two types of bearish flag patterns based on buyers and sellers psychology. The types are classic bear flag and flat bear flag.
1. Classic Bear Flag
Classic bear flag pattern is the most common type of bearish flag pattern, where price consolidates within an upward sloping trendline to form a flag pattern. The classic bear flag pattern has a shallow retracement, often retracing less than 50% of the prior decline.
This pattern appears when short sellers start booking profits after a strong downward move making a price to consolidate or pause from falling. However, this profit booking pressure is low and quickly gets absorbed by the new selling orders. Once the temporary buying pressure fades, sellers again drag the market down.

The characteristics of the classic bear flag pattern is discussed below.
- Strong bearish flagpole.
- Upward-sloping consolidation channel.
- Moderate pullback.
- Volume generally decreases during consolidation.
- The breakdown below the flag confirms the pattern.
Institutions frequently use these retracements to add or rebuild short positions.
2. Flat Bear Flag
In the flat bear flag pattern, price forms a sideways or horizontal consolidation instead of sloping in an upward direction. This pattern is usually considered more powerful than the classic bear flag pattern because it shows strong supply and a lack of buying pressure.

The characteristics of the flat bear flag pattern is discussed below.
- Strong flagpole.
- Horizontal or nearly flat consolidation.
- Very shallow retracement.
- Tight trading range.
- Bearish breakdown below support confirms continuation.
A flat bear flag pattern shows the institutional urgency where large selling orders get executed without allowing a significant rebound.
How to Identify a Bearish Flag Pattern Correctly
There are five simple steps to identify the bearish flag pattern correctly. The steps include identifying strong flagpole, flag formation, pullback depth, volume behaviour and a breakdown.

- Look for a Strong Flagpole: Look for a strong and impulsive downward move which is marked as a flagpole. This move should be supported by a strong volume and strong bearish candles, which validates the strong selling interest.
- Identify the Flag Formation: Look for a price consolidation after a strong downward momentum, marked as a flag. This consolidation usually moves within two parallel trendlines sloping upward. A healthy flag has a tight price structure, low volatility, and low volume. If price starts to make a wider swing due to increased volatility, the pattern may lose its validity.
- Check the Pullback Depth: A reliable or strong bearish flag ideally pulls back 20% to 38.2% of the flagpole. Retracements beyond 50% indicate weakening of momentum and decreases the pattern’s reliability.
- Observe Volume Behavior: Volume should be high during flagpole formation, declining during consolidation or flag formation, and should rise again during breakdown. This signals strong selling interest.
- Wait for the Breakdown: The pattern only completes when price breaks below the lower boundary of consolidation with a strong bearish candle and a good volume.
A bearish flag formed against the primary trend is less reliable compared to one that aligns with a strong downtrend.
How to Trade a Bearish Flag Pattern?
There are five simple steps to trade the bearish flag pattern. The steps include identifying the valid bearish flag, mark the support trendline, confirm breakdown, enter the trade and manage the trade.
- Identify a Valid Bearish Flag: First identify the valid bearish flag pattern by marking a strong downtrend as a flagpole and the short-consolidation as a flag, supported by volume, controlled pullback or sideways consolidation, and existing downtrend.

- Mark the Flag Support: Connect the swing lows of the consolidation phase using trendline. Breakdown of this will confirm the regained sellers control.
- Wait for Breakdown Confirmation: Enter only after giving a clear breakdown. If you are an aggressive trader, you can enter the trade as soon as price breaks down, whereas if you prefer conservative entry, wait for the candle to close below the breakdown level. The breakdown is more reliable when accompanied by higher-than-average volume.

- Place the Stop Loss and Price Target: The stop-loss is usually placed above flag high, above breakdown candle, or above recent swing high. For target, calculate distance of flag pole and project it from the breakdown point or use the next key level as target.

- Manage the Trade: After entry, trail stop-loss as price moves in your favour and partially book your profits at intermediate support levels. Most professional traders prefer setups offering at least a 1:2 risk-to-reward ratio before entering.
The less stock rises during consolidation, the stronger is the bearish flag pattern.
How to Confirm a Bearish Flag Breakdown?
The bearish flag breakdown can be confirmed by looking at four main confirmation signals. The signals include price closing, volume expansion, sustaining of breakdown and indicator support.
- Price Closes Below Flag Support: A price closing below the support trendline of the flag indicates that the sellers have successfully overcome the buying pressure, confirming the breakdown of pattern.
- Volume Expands During Breakout: The breakdown confirms pattern and volume confirms breakdown. The pattern becomes more reliable when price breaks down with higher-than-average volume. A breakdown without a strong volume is usually a fakeout.
- Price should Sustain the Breakdown: After breakdown, price should not immediately rise back inside the flag pattern, it must sustain the breakdown, take pullback towards breakdown level and then continue lower.
- By using Indicator: Indicators like RSI and Moving averages are commonly used for confirming the bearish flag pattern. A bearish flag forming below RSI 50 or below moving averages like 50 or 200 increases the pattern’s reliability.
Hence, the pattern is confirmed when price breaks below support with a strong volume and strong closing supported by indicators like volume, moving averages or RSI.
How to Set Entry, Stop-loss, and Profit targets for a Bearish Flag Pattern?
Setting entry, stop-loss, and profit targets is an essential part of trading bear flag pattern, which is briefly discussed below.
- Entry: Enter short position once price breaks down of the flag pattern with a strong volume. Here we have two ways to enter the trade, an aggressive entry and a conservative entry. Aggressive traders will enter the trade immediately after price breaks the flag pattern, while conservative traders will wait for price to give strong closing before entering a trade.
- Stop-Loss: Stop-losses are usually placed above recent swing high, above breakdown candle, or above upper trendline of the channel. Price braking above these levels reduces reliability of pattern success.
- Profit Target: The profit target in bear flag pattern trading is defined by using measured move technique. Measure the height of the flagpole and project the same distance downward from the breakdown level. You can set a target near the next key support level.
Following these levels with a well-placed stop-loss and proper risk management can help traders capitalize on trend continuation opportunities while maintaining a favorable risk-to-reward ratio. By consistently applying a disciplined stop-loss strategy, a trader ensures that potential losses are contained even if the market moves against their position.
What is an Example of Bearish Flag Pattern in Trading?
Lets understand the bearish flag pattern in trading using stock Adani Power Limited.

The stock started to fall on the 7th of May 2026 with strong volume, a signal often tracked in Technical Analysis. After falling for almost 6%, the stock went into an upward channel consolidation on 11th May 2026, where trading volumes were very low. Immediately on the next day, price broke the lower support trendline of the flag with strong volume—a classic Technical Analysis setup—and the price continued its downtrend.
Which Time-frame is Best to Trade a Bearish Flag Pattern?
Bearish flag patterns can be traded across all the frames, but the reliability of the pattern is comparatively high on higher time frames such as 4 hrs, daily and weekly, because higher time frames often provide less market noise and more institutional participation.
The best timeframe to trade the bearish flag also depends on your trading style.
| Trader Type | Preferred Time Frame |
| Scalper | 1-Minute to 5-Minute |
| Intraday Trader | 5-Minute to 15-Minute |
| Swing Trader | 1-Hour to Daily |
| Positional Trader | Daily to Weekly |
However, professional traders use multi-timeframe analysis to increase the reliability of the pattern. For instance, a swing trader might spot the flag on the daily chart but use the 1-hour chart to time a precise entry.
How Reliable is Bearish Flag Pattern in Trading?
Bearish flag pattern is amongst one of the most reliable chart patterns, but only when traded in a right market context and executed with a proper risk management. According to Thomas Bulkowski , the standard bearish flag roughly has a win rate of 55%-67%, with average gain after breakout is 8% and 19%. A rarer variation known as the High-tight Flag has demonstrated a much higher success rate of around 82%-85%, making it one of the most reliable continuation patterns.
How to Manage Risk when Trading the Bearish Flag Pattern?
To manage the risk when trading the bearish flag pattern, look for the following four important points.
- Trade Confirmed Breakdown: Many traders enter the trade during the formation of flag patterns expecting a breakdown. If breakdown never comes, they get trapped. Only enter the trade after the breakdown supported by a strong volume.
- Use Stoploss and Maintain Favourable Risk to Reward: While entering the trade define the stoploss to limit the maximum risk. Stoplosses are usually placed above recent swing high, above breakdown candle or above upper trendline of a channel. Aim for more than twice the stoploss (1:2 RR).
- Risk Fixed Percentage of the Capital: Bearish flag patterns do not have 100% win rate. Hence it is important to expose only a fixed portion of capital for loss. Risk only 1% to 2% of your trading capital per trade.
- Avoid Trading Bear Flag Against the Main Trend of the Market: Only trade bear flag when the primary trend is downtrend.
Most traders focus on finding the perfect bear flag. Professional traders focus on controlling risk when the bear flag fails.
What Invalidates a Bearish Flag?
There are five major price and volume behaviour that invalidates a bear flag pattern which includes breakout above the upper trendline, breakdown failure, high buying volume and loss of structure.
- Breakout Above the Upper Trendline of Flag: A healthy flag formation consolidates within the parallel channel and breaks below the lower trendline of the channel. However, if price breaks the upper trendline, it weakens or invalidates the bearish flag setup .
- Deep Retracement of the Flagpole: Flag is supposed to be a temporary pause rather than a major correction, if the price retreats more than 50% of flagpole, it indicates buyers dominance. The strong bearish flag usually has less than 38% retracement of the flagpole.
- Breakdown Failure: A breakdown should sustain a lower price. If the price quickly rises after breakdown, it suggests weak seller participation. This is also known as false breakdown or bear trap.
- High Buying Volume During Consolidation: A volume during a flag formation should be low. If heavy buying volume appears during consolidation, it suggests accumulation rather than a simple profit booking.
- Loss of Structure: The flag should form within the existing downtrend. If the stock starts making higher lows and higher highs, the trend may be reversing instead of continuing.
A bear flag remains valid as long as the pullback is controlled, volume remains healthy, and the overall downtrend stays intact. Once price starts showing the above mentioned signal, the bear flag pattern invalidates.
Differences between Bearish Flag vs Bearish Pennant vs Descending Triangle
The difference between bearish flag VS bearish pennant VS descending triangle pattern is discussed below in the table.
| Feature | Bearish Flag | Bearish Pennant | Descending Triangle |
| Pattern Type | Bearish continuation | Bearish continuation | Usually bearish continuation |
| Prior Trend | Strong downtrend required | Strong downtrend required | Often forms during a downtrend |
| Consolidation Shape | Parallel channel sloping upward or sideways | Small symmetrical triangle with converging trendlines | Horizontal support with descending resistance |
| Trendlines | Parallel | Converging | One horizontal and one descending |
| Duration | Short-term consolidation | Short-term consolidation | Usually longer consolidation |
| Breakdown Direction | Below lower trendline | Below lower trendline | Below horizontal support |
| Market Psychology | Temporary profit-booking before sellers regain control | Brief market indecision before trend continuation | Sellers become increasingly aggressive while support weakens |
| Volume Pattern | Declines during consolidation and expands on breakdown | Declines during consolidation and expands on breakdown | Often contracts during formation and expands on breakdown |
| Price Target | Flagpole projected downward from breakdown | Flagpole projected downward from breakdown | Height of triangle projected downward from support |
| Reliability | High | High | High, especially after multiple support tests |
| Retracement | Usually shallow (20%-50% of flagpole) | Very shallow consolidation | Can remain range-bound for longer periods |
| Best Use | Trading trend continuation after a sharp decline | Trading continuation after explosive downward moves | Trading breakdowns from established support zones |
Hence, while a flag, a pennant, and a Descending Triangle all represent a pause before the resumption of an uptrend, they differ in the way the price consolidates. Specifically, a Descending Triangle typically shows a flat support level with lower highs, creating a different consolidation structure than a traditional flag.
Differences between Bearish Flag vs Bullish Flag Patterns
The difference between a bearish flag and a bullish flag is briefly discussed below in the table.
| Feature | Bearish Flag | Bullish Flag |
| Market Trend | Downtrend | Uptrend |
| Flagpole | Sharp downward move | Sharp upward move |
| Consolidation | Bounce or sideways movement | Pullback or sideways movement |
| Signal Type | Bearish continuation | Bullish continuation |
| Breakout Direction | Breaks below support | Breaks above resistance |
| Trading Opportunity | Short (Sell) | Long (Buy) |
| Stop-Loss Placement | Above the flag high | Below the flag low |
| Profit Target | Flagpole height projected downward | Flagpole height projected upward |
| Volume Pattern | Volume usually declines during consolidation and increases on breakdown | Volume usually declines during consolidation and increases on breakout |
| Market Psychology | Temporary profit-booking by short sellers before sellers regain control | Temporary profit-taking by buyers before buyers regain control |
| Typical Retracement | Small upward retracement against the downtrend | Small downward retracement against the uptrend |
| Best Market Environment | Strong bearish trend | Strong bullish trend |
| Confirmation Signal | Strong bearish candle closing below flag support with volume | Strong bullish candle closing above flag resistance with volume |
Bullish flag represents pause before uptrend resumes, while bearish flag represents the pause before downtrend resumes.
What Type of Indicators can be used with a Bearish Flag Pattern?
There are four indicators commonly used with a bearish flag pattern to confirm the trend strength, breakout validity, momentum, and entry timing.
- Volume: It is the most important indicator used when trading a bear flag pattern because it tells whether the breakdown of the flag pattern is actually driven by strong participation. Enter the trade when price breaks the flag consolidation with a good volume.

- Moving Averages: It helps to confirm whether the price is in downtrend or not. If a bearish flag pattern forms below moving averages like 20 EMA and 50 EMA, it increases the reliability of the pattern.

- RSI: RSI measures the strength of the momentum during the flag formation and a breakout. When RSI stays below 60 during flag formation, it is generally considered a healthy consolidation. If RSI falls below 50 or 40 after breakdown, it supports the breakdown by marketing it as a falling strength.

- ADX: ADX is mainly used to filter out trending markets from sideways markets. ADX above 25 is generally considered as a trending market. If a bearish flag forms when ADX is above 25, the reliability of the pattern increases.

Hence the accuracy of the bearish flag pattern can be increased by combining the continuation signal with other indicators.


 Previous Article


![15 Investing.com Alternatives [Free+Paid] You Should Use in 2026](https://www.strike.money/wp-content/uploads/2026/04/Investing.com-Alternatives.jpg "15 Investing.com Alternatives [Free+Paid] You Should Use in 2026 52")
![15 TradeStation Alternatives [Free+Paid] You Should Use in 2026](https://www.strike.money/wp-content/uploads/2026/04/TradeStation-Alternatives.jpg "15 TradeStation Alternatives [Free+Paid] You Should Use in 2026 53")
![15 Chartink Alternatives [Free+Paid] You Should Use in 2026](https://www.strike.money/wp-content/uploads/2026/04/Chartlink-Alternatives.jpg "15 Chartink Alternatives [Free+Paid] You Should Use in 2026 54")
: Overview, 10 Types of Indicators, Settings for Different Markets 55")


 : Definition, Formula, calculation, Uses, Advantages Vs limitations 58")


No Comments Yet.