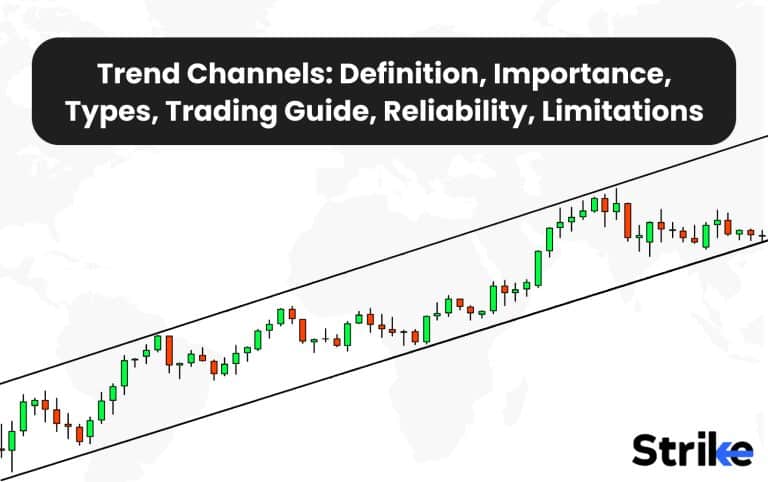
Trend channels are lines drawn above and below the price that act as support and resistance levels for the trend. Trend channels’ main advantage is that they help traders visualize the highs and lows of the recent price action.
One disadvantage is that they require the price to respect the channel levels which is not always the case.
The three main types of trend channels are sideways trend channels, uptrend channels and downtrend channels.
A sideways trend channel is drawn between two horizontal lines to show the price is moving sideways within a narrow range.
An uptrend channel is formed by drawing two upward sloping lines to encompass several higher lows and higher highs showing an ongoing bullish trend.
A downtrend channel is identified by drawing two downward sloping lines to connect lower highs and lower lows indicating a bearish trend.
Trend channels help identify the overall direction of the price movement and potential support and resistance levels going forward. Traders enter or exit trades based on breaks of the identified channel levels for potential momentum moves in the direction of the breakout. Drawing trend channels is a simple yet effective technical analysis tool for visualizing trends and potential reversals.
What are trend channels?
Trend Channels are technical analysis tools used to identify and plot trends in financial markets. Trend Channels are bounded by two parallel trend lines that connect significant swing highs and lows and they also contain an average of the drawn trend channel. The upper trendline connects at least two major highs, while the lower trendline connects at least two major lows. The area between the two trendlines forms the channel for the current trend.
Trend Channels help traders visualize the prevailing trend, determine trend strength and direction, identify support and resistance levels, and forecast potential breakouts. Prices tend to respect the upper and lower channel rails as support and resistance until the channel finally breaks. As long as prices oscillate within the boundaries, the trend remains intact. Traders look to enter long positions near the lower rail when the stock pulls back to support. Short trades are taken at the upper rail if the stock hits resistance. A breakout signals a potential trend reversal or acceleration which presents trading opportunities. Traders require confirmation before acting on breakout signals. Channels make trends easier to identify, follow and trade when combined with other indicators.

Why is it important to know trend channels?
Trend channels are important to know as they help to identify and follow trends, gauge potential support and resistance levels, plan enter and exit points. Trend channels also help determine when trends are accelerating or weakening, and spot potential breakouts. Trend channels provide vital insights into the prevailing trend that allows traders to make informed decisions. Identifying and drawing trend channels on stock charts helps traders better grasp the direction, strength, potential longevity, and trading opportunities within trends.
Trend channels immediately reveal the direction of the current trend on any timeframe chart. The slope and orientation of the channel show whether prices are trending higher in an uptrend or trending lower in a downtrend. This helps traders align with the dominant momentum and avoid taking contrarian trades. The slope and width of a trend channel provide clues about the intensity and energy behind the trend. A steep, narrow channel shows strong, focused momentum. A shallow, wide channel indicates a loose, weak trend. Assessing the slope and breadth visually quantifies how powerful the underlying trend is. Traders then measure whether the trend has enough momentum to continue.
How many types of channels are there?
There are three primary types of trend channels used in the technical analysis of the stock market. An ascending channel has an upward sloping lower trendline and upward sloping upper trendline, indicating an uptrend. A descending channel downward sloping lines reveal a downtrend. Horizontal channels move sideways with relatively flat parallel support and resistance lines, reflecting consolidation.

1. Ascending channel

An ascending channel is a chart pattern formed when a stock price trades between two upward sloping parallel trendlines. There are two types of ascending channels – bullish and bearish.
A bullish ascending channel has the stock price bouncing off the lower trendline and hitting resistance at the upper trendline as it moves higher over time. This indicates growing demand for the stock as buyers come in to support the price at the lower trendline. A breakout above the upper trendline signals strong upside momentum.
A bearish ascending channel has the stock price bouncing off the upper trendline and finding support at the lower trendline as it moves higher. This indicates limited demand for the stock as sellers come in at resistance. A breakdown below the lower trendline signals the uptrend has lost momentum and a potential reversal.
Ascending channels show visually where potential areas of support and resistance are. Bullish channels indicate growing upward momentum while bearish channels suggest weakening momentum. Traders watch for trendline breaks to signal possible long entries on bullish breakouts or short entries on bearish breakdowns.
2. Descending channel

A descending channel is a chart pattern formed when a stock price trades between two downward sloping parallel trendlines. Like ascending channels, there are two types – bullish and bearish.
A bullish descending channel has the stock price finding support at the lower trendline and hitting resistance at the upper trendline as it moves lower over time. This indicates reducing supply as buyers come in to support the price at the lower trendline. A breakout above the upper trendline signals upside momentum is returning.
A bearish descending channel has the price bouncing off the upper trendline and breaking support at the lower trendline as it moves lower. This reflects continued selling pressure. A breakdown below the lower trendline indicates the downtrend is accelerating to the downside.
Descending channels visually display potential support and resistance levels for a stock in a downtrend. Bullish descending channels suggest reduced selling pressure while bearish channels indicate building downward momentum. Traders use trendline breaks to identify possible long trades on bullish breakouts or short trades on bearish breakdowns.
3. Horizontal channel

A horizontal channel is formed when a stock trades between clear horizontal support and resistance levels for an extended period. There are two types of horizontal channels – bullish and bearish.
A bullish horizontal channel has the stock finding buying support at the lower support level and meeting selling resistance at the upper level as it consolidates in a range. This indicates equilibrium between buyers and sellers. An upside breakout signals renewed demand is coming into the stock.
A bearish horizontal channel has the stock finding selling resistance at the upper level and buying support at the lower level as it trades sideways. This reflects limited demand for the stock. A downside breakdown indicates selling pressure is building again.
Horizontal channels display clear areas of support and resistance in a trading range. Bullish patterns indicate balanced consolidation while bearish suggests weakening demand. Traders watch for breakouts above bullish channel resistance or breakdowns below bearish channel support to time entries. Confirmation of a trading setup is increased when the price retests on a lower time frame to confirm the broken level will continue the flow of the trend on the breakout or breakdown side. Trading horizontal channel patterns capture continuation moves as the stock exits the trading range.
Traders utilise channel breakouts and breakdowns to time entries for high probability, low-risk trades in the direction of the emerging trend.
How do you draw trend channels?
To draw a trend channel on a stock chart, connect the swing highs and lows with parallel lines to identify the upper and lower boundaries of the price channel showing the prevailing trend direction. First, determine the overall trend direction on the chart. Is the market in a clear uptrend or downtrend? Drawing trend channels works best on charts where the overall trend direction is obvious.
- The first step is to identify the overall trend direction of the script on a higher time frame (Daily or weekly) to identify proper higher highs or lower lows.
- After identifying a proper higher high or lower low setup that defines a true trend, select the trend channel tool from the tradingview library and connect the channel with proper pivot highs and lows that establishes a trend. Be sure to line up the swing points as accurately as possible
- This trend channel will potentially work as a range that works as an accumulation of market participation to finally breakout or breakdown to follow the original trend. The upper and lower trendlines also work as potential bounce levels where trade on lower time frames can be identified.
- Draw a parallel line the same distance above the first trend line, connecting at least two significant highs on an uptrend or lows on a downtrend. Use the slope and spacing from the first line as a guide. The upper trend line marks key resistance on an uptrend or support on a downtrend.
- Step back and evaluate the channel lines. Adjust their positioning and slope as needed to find the optimal fit and alignment with the most pivotal swing highs and lows. The final channel should create clear visual boundaries containing price.
- As the trend evolves over time, continue adjusting the channel to align with new emerging highs and lows. The channel lines are tilted to better fit, and channel width expands or contracts. Trend channels are not static – update them to reflect changes in trend behavior.
- Tips for drawing accurate trend channels are to use prominent swing highs and lows, adjust the channel lines to find the best fit alignment, extend the lines into the future to anticipate potential support and resistance levels, update the channel over time to reflect any trend changes, and beware of channel breakouts that signal reversals.

How do breakouts & reversal work in trend channels?
A breakout occurs when the price breaks above the upper trendline resistance or breaks below the lower trendline support. Reversal occurs when the price fails to break out and resumes trading within the channel again. Breakouts signal that the prior trend is ending and a new trend is starting.
An upside breakout happens when the price closes above the upper trendline resistance. This signals that bullish momentum is strong enough to push the price out of its prior trading range. Upside breakouts are used by technical traders to go long, as they expect the uptrend to continue in the new direction.
A downside breakout occurs when the price closes below the lower trendline support level. This signals that bearish momentum has overwhelmed the bulls and broken the prior trading range. Downside breakouts are used by traders to initiate short positions, anticipating the new downtrend to continue.
The image uploaded below shows classic examples of how price and trend channel’s components known as upper resistive trendline, lower supportive trendline and the average of the channel respects the price of the script. Examples of reversal and breakdown of the supportive lower trendline and the conversion of support into a resistance in also highlighted.

Breakouts are most significant when high volume confirms the price move. High volume indicates increased participation that provides enough momentum to sustain the new trend’s direction. Breakouts on low volume are weaker and more prone to fail.
To increase confidence, traders will combine trendline breakouts with other technical indicators and chart patterns. For example, using a moving average to confirm the direction improves breakout signals. It signals stronger upside potential, if the price breaks above a resistance level and is also above the 50-day moving average.
Chart patterns like flags, pennants, triangles, double tops and head & shoulders form within the channel, providing additional trading signals when the patterns complete. For example, the breakout above the neckline has an increased chance of reversing the downtrend, if an inverse head & shoulders pattern forms near support within a downtrend channel.
A channel reversal forms when the price fails to break out and resumes trading in the opposite direction within the existing channel. For example, it signals a reversal back to the upside, if the price approaches the lower channel support and bounces higher off it. This indicates the downside momentum was not strong enough to maintain the prior direction.
Reversals are more likely to occur if key support and resistance levels are tested but not broken. Round numbers like 10, 20, 50 are psychologically significant levels. Prior highs and lows also act as support and resistance. It signals that supply and demand are relatively balanced and a reversal develops, when the price tests but does not exceed these key levels.
To confirm reversals, traders watch for candlestick patterns indicating indecision or loss of momentum. Doji and spinning tops indicate equal buying and selling pressure. Long upper or lower candlestick shadows demonstrate that bears or bulls tried to push the price but failed and reversed. Such reversal patterns often form near inflection points like channel support and resistance.
How do you trade using trend channels?
Trend channels are traded by buying near the lower channel line and selling near the upper channel line in the direction of the overall trend, until a confirmed breakout signals a potential trend reversal. Trend channels help to visualize the slope and direction of a trend, and provide trading opportunities in the direction of the trend.
Look to buy near channel support in an uptrend, as this indicates the trend is intact and offers a low-risk area to enter long positions. Place a stop loss below support. For downtrends, look to sell short near channel resistance, as rallies up to resistance signal the downtrend will likely resume. Enter short with a stop above the channel. Increase odds of success by waiting for price or momentum confirmations before entering, such as the stochastic oscillator reaching oversold and turning up or a moving average breakout, before trading channel bounces.

In uptrends, take profits on longs at channel resistance as it signals reversal risk. In downtrends, cover shorts at channel support to capture profits as bounce risk increases. Rather than exiting the entire position, use trailing stops under channel support to lock in gains as the trend progresses. Hold winning trades until a decisive break of channel support or resistance which signals the trend is ending. Close short positions when the price breaks above resistance and open long positions when it falls below support. Channel breaks often lead to trend reversions.
The average of the trend channel also offers trade opportunities to short term traders like scalpers and daytraders.
Trade pullbacks to the 20-period moving average near channel support and resistance, use RSI to identify oversold bounces and overbought fades at channel lines, utilise Average True Range for stop loss placement below channels with trailing stops under swing lows, and scale out of winning trades in portions at profit targets like channel lines, moving averages, and on channel breaks instead of exiting the entire position all at once.
How do we determine stop loss in trend channels?
Stop Loss in trend channels are determined by placing them just below the lower trendline for long positions or just above the upper trendline for short positions. This allows the trend to continue moving within the channel without stopping out prematurely. The stop loss placement accounts for volatility in price while adhering to the overall channel direction. There are five techniques that are used for stop loss placement.
- Firstly, identify key support and resistance levels within the channel by looking left on the chart. Previous swing highs and lows that align with the channel boundaries provide logical areas for stop placement. You want to set your stop below critical support levels so you are not stopped out prematurely. Allowing some room below support allows for normal market fluctuations.
- Second, place your initial stop loss below the most recent swing low prior to entering your trade. As the trend progresses, move your stop up to just below new swing points. This trailing stop technique locks in profits while maintaining exposure to the upside. Avoid getting overly aggressive with trailing stops to prevent being shaken out of strong trends early.
- Thirdly, for very volatile stocks, consider using volatility-based stops. Determine the Average True Range (ATR) and set your stop loss at 2-3 times the ATR below your entry. This accounts for normal volatility and provides wiggle room. Adjust the stop higher as volatility declines during the trend. Always check ATR stops against nearby support levels.

4. Fourth, a common technique is entering reversal patterns at the channel midline, when trading pullbacks within trends. In this case, place your stop loss below the pullback swing low. Your risk is defined as the distance from your entry to that low. Make sure your profit target is at least twice as large as your risk.
5. Fifth, place stops above resistance formed by the upper channel line, when selling short in a downtrend. Trail your stop lower below new swing highs formed within the channel. Your risk is defined by the distance from entry to the channel resistance.
How do you set targets in trend channels?
Target in trend channels is set at the opposite side of the channel from the entry point, either at or slightly before the upper or lower trendline. This allows the trade to capture the full range of the expected move within the channel based on the identified directional bias. Targets are also staggered at intervals within the channel to lock in profit before the eventual channel break.There are six techniques traders use to set logical and strategic targets within trend channels.

- The first method is to identify key support and resistance levels that stand out on the chart. In an uptrend, resistance levels that the price has struggled to break through or has reacted to multiple times in the past often act as target areas on the upside. These could be previous swing highs, psychological round numbers, Fibonacci retracements, or trend lines connecting several rally peaks. As the price breaks out to new highs in an ascending channel, traders aim to take partial or full profits near these known areas of potential resistance. The opposite applies for downside targets in a downtrending channel, where clear support levels are suitable targets to the downside.
- Secondly, traders use recent swing highs and lows to set targets within the prevailing trend. As the price fluctuates between the channel lines, it will often form minor swings making lower highs and lower lows in a downtrend, or higher highs and higher lows in an uptrend. By projecting these swing points into the future, traders estimate logical areas for the price to stall or reverse back the other way. Taking profits near the projection of the previous minor swing high or low gives a high-probability target.
- Moving averages are another tool to generate targets when swing trading trend channels. The price will often react around key moving averages aligned with the dominant trend. In an uptrend, the 20-day, 50-day, or 200-day simple moving averages act as support where buyers tend to emerge. Moving average zones present sensible areas to cover shorts and take profits on longs, when trading pullbacks within an uptrend channel. The opposite levels are used as selling targets in downtrend channels.
How reliable are trend channels in technical analysis?
Trend channels are a moderately reliable technical analysis tool that provides useful information about the prevailing trend when used properly in confluence with other indicator signals to define trend direction and strength.
Trend channels are most effective at identifying the dominant trend direction and strength when the market is already in a well-defined uptrend or downtrend. They work best on time frames of 1 hour and above when a stock or index has established a clear directional bias. On shorter time frames or choppy markets, trend channels whipsaw and provide false signals. Traders should first determine the major trend on daily/weekly charts before drawing trend channels on intraday charts. The reliability depends greatly on how the trend channels are constructed. Poorly drawn channels with inaccurate anchor points leads to invalid analysis. Traders should connect at least two prominent swing highs and two major swing lows to draw the parallel channel lines. Pay attention to the angle and spacing between the lines – the broader the channel, the weaker the trend. Very narrow channels signal climaxing price action. Trend channels work best when defined on “qualified” Price swings – not minor daily fluctuations or noise.
For better reliability, trend channels should be used along with momentum oscillators like RSI to assess overbought/oversold conditions. For example, oversold readings on RSI near the lower channel line could signal a bounce. Adding moving averages helps measure the strength – the longer the price respects the moving average line, the stronger the trend. Traders should look for confluence from technical indicators to increase reliability of trend channel analysis.
What are the limitations of trend channels?
The limitations of trend channels are that they produce false signals during consolidation periods, struggle to adapt to changing market conditions, lag at major turning points, perform best in strongly trending markets, and are prone to subjectivity in their construction.
Trend channels produce false signals during periods of consolidation or range-bound price action. It continues to touch the trend channel boundaries and produce buy or sell signals that turn out to be premature, when a stock price moves sideways after a trend. During choppy consolidation zones, a breakout above or below the channel results in a false breakout rather than a genuine trend reversal.
They also struggle to adapt to changing market conditions. Channels are static analysis tools based on historical price action. Once drawn, the channel lines remain fixed and do not adjust to shifts in volatility or momentum. The channel fails to contain price moves and requires constant re-drawing, if market conditions change. Channels lag dynamic markets and cannot account for accelerating or slowing trends. Adaptive analysis tools like Bollinger Bands self-adjust to changing volatility.
Trend channels lag at major market turning points. The price will often break out of the channel abruptly, when a long-term trend reverses. By the time the channel signals a potential reversal, the initial price move has already occurred. Channels confirm reversals after they happen and risk late exits from trends. Methods like moving average crossovers signal reversals earlier than trendline breaks.
Trends punctuated by frequent reversals and volatile ranging markets reduce the reliability of channel signals. Whipsaws across channel boundaries produce losing trade signals. Channels work better on daily or weekly charts for long-term trends.
They are prone to subjectivity in their construction. While there are guidelines for drawing valid channels, the parameters vary based on the trader’s discretion. Slight differences in channel placement and slope affect the signals generated. Automated or algorithmic channel drawing removes subjectivity but has limitations in visual chart analysis.
What are the tools available for trend channels?
Strike, trading view, chartschool, etc, are among the tools available for trend channels. Strike is one of the best tools available in India right now, and it helps with comprehensive trend channel analysis.
How to do channel width analysis?
Channel width analysis involves examining the upper and lower boundaries of a stock’s price channel over a period of time to see how the distance between support and resistance levels changes. It is a technical analysis technique used by traders and investors to gauge trends in a stock’s volatility and make predictions about potential price breakouts.
To begin trend channel width analysis, a trader will first have to identify an established price channel on a stock chart. This involves drawing a trendline connecting higher price highs to form the channel’s resistance line and another trendline connecting the lower price lows to form the channel’s support line. The area between these two parallel lines forms the price channel. The trader will have to look back over months or years to define the long-term channel.
Once the channel is defined, the trader measures and tracks the vertical distance between the support and resistance lines over time. This distance is the channel width. It signals increasing volatility and widening trading range, if the channel width is expanding. This foreshadows a future breakout. It signals decreasing volatility and narrowing trading range, if the channel width is contracting. The trading range is tightening and a breakout is imminent.
By comparing channel widths at different points in time, the trader spot trends and anticipate potential breakouts. For example, suppose a channel width slowly expands over months followed by a sharp contraction, this often precedes a major price movement. The contraction indicates the spring is coiling tighter before a significant release of energy.
To trade on trend channel analysis, traders will watch for channel width extremes. Expanding width extremes signal rising volatility and potentially overbought or oversold conditions. This suggests a reversal is near. Contracting width extremes signal falling volatility and a tightly wound spring. The trader will prepare to enter a new position when price breaks out above resistance or below support.
What is a bearish trend channel?
A bearish trend channel is a pattern that forms on a stock chart when a stock is in a downtrend. It consists of an upper resistance trendline that connects a stock’s lower highs and a lower support trendline that connects the lower lows as the stock falls. The area between these parallel declining trend lines represents the bearish trend channel. As the stock drops, it will bounce off the support trendline and then fall back to test the resistance trendline repeatedly.
The downward sloping trend lines contain the stock price action within the bearish channel. The increasing distance between the lines shows the downtrend is intensifying. Traders watch for a break below channel support as an entry signal to trade the stock’s downward momentum. A bearish trend channel indicates sustained selling pressure and an overall bearish sentiment surrounding the stock. It typically leads to lower prices unless the stock breaks out above the upper resistance trendline. A reversal from bearish to bullish side occurs when the upper resistive trendline is broken and converted into a support and a downward breaking leads to trend continuation.

What is a bullish trend channel?
A bullish trend channel is a pattern thatforms on a stock chart when a stock is in an uptrend. It consists of a lower support trendline that connects a stock’s higher lows and an upper resistance trendline that connects the higher highs as the stock rises. The area between these parallel rising trend lines represents the bullish trend channel. As the stock increases, it will bounce off the support trendline and then rise back to test the resistance trendline repeatedly. The upward sloping trend lines contain the stock price action within the bullish channel. The increasing distance between the lines shows the uptrend is gaining momentum.

Traders watch for a break above channel resistance as an entry signal to trade the stock’s upward momentum. A bullish trend channel indicates sustained buying pressure and an overall bullish sentiment surrounding the stock. It typically leads to higher prices unless the stock falls back below the lower support trendline.
What is the rising channel trend?
A rising channel trend is a pattern that forms on a stock chart when a stock is in a steady uptrend. It consists of an upward sloping support line that connects the pullback lows and an upward sloping resistance line that connects the rally highs as the stock rises over time. The area between the parallel rising support and resistance lines represents the rising channel.
As the stock increases, it will bounce off support and hit resistance repeatedly while contained within the channel. A rising channel shows consistent buying pressure is propelling the stock higher. However, the slope of the channel lines reflects an ideal or sustainable rate of ascent. Sharper rallies encounter selling. Traders use rising channels to identify low-risk entry points to trade momentum. A break below channel support indicates the uptrend is ending. A rising channel helps gauge both the strength and pace of an uptrend.


 Previous Article


![15 Investing.com Alternatives [Free+Paid] You Should Use in 2026](https://www.strike.money/wp-content/uploads/2026/04/Investing.com-Alternatives.jpg "15 Investing.com Alternatives [Free+Paid] You Should Use in 2026 160")
![15 TradeStation Alternatives [Free+Paid] You Should Use in 2026](https://www.strike.money/wp-content/uploads/2026/04/TradeStation-Alternatives.jpg "15 TradeStation Alternatives [Free+Paid] You Should Use in 2026 161")
![15 Chartink Alternatives [Free+Paid] You Should Use in 2026](https://www.strike.money/wp-content/uploads/2026/04/Chartlink-Alternatives.jpg "15 Chartink Alternatives [Free+Paid] You Should Use in 2026 162")
: Overview, 10 Types of Indicators, Settings for Different Markets 163")


 : Definition, Formula, calculation, Uses, Advantages Vs limitations 166")


No Comments Yet.