The morning star candlestick pattern is closely followed by traders because of its early indication of the weakening of bearish momentum. The morning star candlestick pattern is commonly formed around significant areas of support, which makes it helpful for traders looking for a potential reversal trade after a decline.
Due to its three-candle formation and clear change in market sentiment, this pattern is frequently used in technical analysis with other indicators such as RSI, moving averages, or volume to enhance trade confirmation. Over the period of time, morning star has turned out to be among the best-known bullish reversal patterns in candlestick charting, particularly in swing and positional trading.
What is a Morning Star Candle?
The morning star is a three-candle bullish reversal candlestick pattern that typically appears after the end of the downtrend. It signals a gradual shift in the market sentiment from bearish to bullish, suggesting that selling pressure has been exhausted and buyers are regaining control.
Is Morning Star Bullish or Bearish?
The morning star is a bullish candlestick pattern that signals a trend reversal from bearish to bullish. It typically forms after a period of sustained selling pressure and indicates a weakening of selling pressure.
Structure of a Morning Star Candlestick
The morning star is a three-candle bullish reversal candlestick pattern representing a psychological shift from bearish to bullish. We will briefly discuss the three-candle morning star structure below.

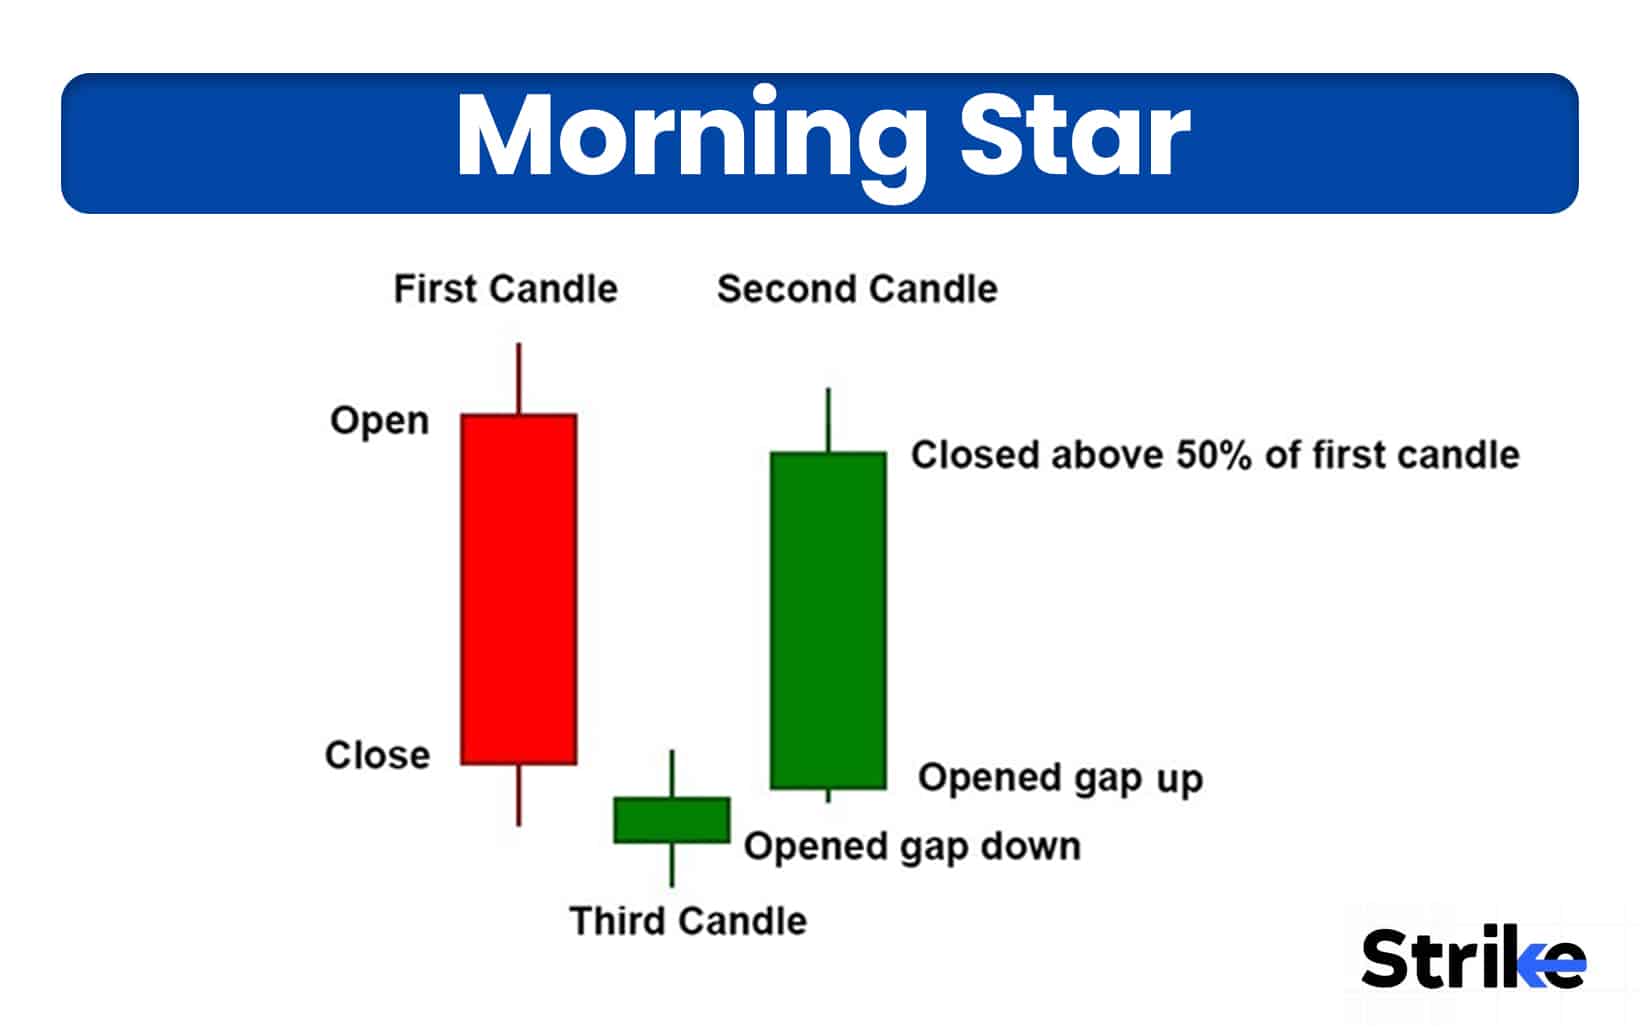
- First Candle: A long bearish (red/black body) candle reflecting sellers’ dominance and the continuation of the prevailing downtrend.
- Second Candle: A small-bodied (doji, spinning top, or star) candle that opens a gap down from the first candle, signaling market indecision due to buyer entry.
- Third Candle: A long bullish (green/white body) candle that opens with a gap up and closes halfway into the first candle’s body, confirming buyer control.
Gaps between candles strengthen the signal, and higher volume on the third candle adds reliability, especially on daily charts in Indian markets.
Psychology behind a Morning Star
The psychology behind the morning star reveals the shift from bearish dominance to bullish resurgence during a downtrend.
- First Candle: The first large bearish candle shows that the sellers are in control and the downtrend is still dominant. At this stage, market sentiment is pessimistic, with traders continuing to sell.
- Second Candle: The small body of the second candle reflects market indecision, where selling momentum begins to slow and the balance between buyers and sellers becomes more even. This phase suggests that the bearish trend is losing strength.
- Third Candle: The third strong bullish candle indicates that the buyers have stepped in with confidence and control of the market. This shift in control from sellers to buyers suggests the end of the downtrend and a potential bullish reversal.
This shift in sentiment from selling pressure to buying strength is what makes the morning star a reliable signal of a potential bullish reversal.
What Does the Morning Star Indicate?
The morning star pattern indicates the weakening of selling pressure and a gradual shift in market sentiment from bearish to bullish. This transition suggests that bearish momentum is fading and a possible upward price movement may follow, especially when the pattern forms near a key support level or after a prolonged decline.
How to Identify a Morning Star Candle?
To identify a morning star candlestick pattern, look for a specific three-candle sequence that appears at the bottom of a downtrend. Following are the four major steps for identifying the morning star candlestick pattern.

- Confirm the Prior Downtrend: Identify and confirm the downtrend by marking the lower highs and lower lows or by using moving averages. A valid morning star forms after a visible decline.
- Look for the three-candle formation: A first bearish candle, indicating strong selling pressure, is followed by a second small-body candle, indicating market indecision, followed by a third bullish candle with a large green body, showing strong buying momentum.
- Check the Closing Strength: The third candle should close above 50% of the first candle with increased volume.
- Check location: The reliability of the morning star pattern increases when it forms near support, the Fibonacci golden zone, or an RSI oversold condition.
Identifying these characteristics helps traders recognize a valid morning star candlestick pattern and improves the chances of spotting a potential trend reversal early.
How to Scan for Stocks with the Morning Star Pattern?
To scan for stocks with a morning star pattern, there are different stock screening platforms available, like Strike Money, TradingView, Chartink, Trendlyne, and Screeners, which automatically identify the morning star pattern.
There are three major steps common for all the above-mentioned software to scan a morning star pattern.
- Open the software: Go to platforms (Strike Money, TradingView, Chartink, Trendlyne, or Screener).
- Open the Screeners Section: Go to the screener section on these platforms, where different scanners are available based on various technical and fundamental criteria. From the available options, select the candlestick pattern scanner to look for patterns like the morning star.
- Select Morning Star Pattern: Select the Morning Star candlestick pattern scanner from the candlestick scanners and run the scan to generate a list of stocks where the Morning Star pattern has recently formed.
Before trading it directly, open the charts of shortlisted stocks to confirm the pattern and check if it forms near support levels or after a clear decline.
Where Does the Morning Star Appear in a Chart?
The morning star pattern in the chart appears at the potential reversal zones where selling pressure weakens and buyers may take control. Such reversal zones include a support zone, a Fibonacci golden zone (0.5 – 0.618), and oversold market conditions.
How Often Does the Morning Star Candlestick Pattern Happen?
The morning star candlestick pattern appears moderately across all financial markets. However, a perfect textbook version of a morning star with specific gaps between all three candles is rare, often occurring only in volatile market conditions or during significant trend reversals.
Patternswizard conducted a historical study of 4,120 markets over the past 59 years and found approximately 22,863 morning star patterns. Statistically, this number translates to about one Morning Star pattern for every 680–700 candles, or roughly 1 occurrence in 682 bars on average.
This data concludes that the morning star pattern appears moderately often but not excessively frequently in the market.
What Timeframe is Best for Morning Star?
Higher timeframes, such as daily or weekly, are considered to be the best timeframes to trade the morning star pattern. This timeframe helps filter market noise, making reversals more significant and reducing false signals.
| Timeframe | Reliability | Frequency | Best Use Case |
| 1-min / 5-min | Low | High | Scalping (very noisy, lower accuracy) |
| 1-Hour | Medium | Medium | Intraday/Day trading |
| 4-Hour / Daily | High | Medium | Swing trading |
| Weekly | Highest | Low | Position trading / Long-term reversal |
In most cases, traders consider the 4-hour and daily charts as the most effective timeframes for trading the Morning Star, as they provide a good balance between reliability and trading opportunities.
How to Confirm an Morning Star Signal
To confirm a morning star signal, traders often look for four additional confirmational factors. The additional factors are the next candle close after the morning star, volume expansion, support level confluence, and use of a momentum indicator.

- Next Candle Confirmation: The next candle following the morning star should close above the high of the third bullish candle in the morning star pattern. This confirms the control of buyers and a reversal of the trend.
- Volume Expansion: Check for the higher trading volume on the third candle of the pattern to confirm the strong buying interest.
- Support Level Confluence: The reliability of the morning star increases when it forms near a key support level, such as a previous swing low, demand zone, or a major trendline. This support level often attracts buyers, which helps the reversal sustain.
- Momentum Indicator Confirmation: Momentum indicators, such as the Relative Strength Index (RSI), can help validate the pattern. If a morning star pattern appears during an RSI oversold condition or RSI bullish divergence, it suggests a weakening of selling pressure and a potential trend reversal.
When these conformational factors align with morning star candlestick formation, the probability of bullish reversal increases significantly.
How Successful is Morning Star?
The morning star is considered to be one of the most reliable candlestick patterns, especially when it forms after a strong downtrend and near a key support level. A study by Thomas Bulkowski in Encyclopedia of Candlestick Charts suggests that the pattern has a success rate of around 60–65% when traded with proper market context.
However, the success rate of the Morning Star also depends on the timeframe. Higher timeframes, such as daily and weekly, are more reliable to trade morning stars due to less market noise.
How to Trade Using the Morning Star Candlestick Pattern
There are four major steps to trading the morning star candlestick pattern. The steps include entry, profit target, stop-loss, and exit.
Entry
Enter a long position after the third bullish candle closes. For a more confirmed entry, wait for the price to break above the high of the third bullish candle or look for increased volume on that candle.

Profit Target
Set the profit target at the next resistance level, such as the previous swing high or 61.8% of the Fibonacci extension. You can also set a profit target to a 1:2 risk-reward ratio.

Stop-Loss
Place the stop-loss below the low of the second (indecision) candle or the pattern’s overall low to minimize the downside risk. You can also trail the stop-loss using the 9 or 20 EMA or swing lows near the EMA. Always risk 1-2% of the capital per trade.
Exit
Exit when the price hits either the profit target, stop loss, or trailing stop loss. You can also use time-based exits in case of low momentum.
Is the Morning Star Candlestick Profitable?
Yes, the morning star candlestick pattern is a reliable and potentially profitable bullish reversal pattern, but only when traded with the right market context and proper risk management. According to backtest results from Quantified Strategies, the Morning Star pattern shows a win rate of about 50–60%, which can be improved to 60–75% if it is followed by strict criteria, such as preceding downtrends and volume spikes on the third candle.
Common Mistakes to Avoid with Morning Star
There are five common mistakes to avoid when trading the morning star candlestick pattern.
- Ignoring the Prior Trend: A morning star is only reliable when it appears after a clear downtrend. Morning stars forming in a sideways market are often less reliable to trade.
- Trading without Confirmation: Avoid entering immediately after a pattern forms. It is better to wait for the next candle to close above the third candle’s high or the pattern’s high.
- Ignoring Support Levels: The morning star pattern works best near strong support zones, demand areas, or Fibonacci levels.
- Not Checking Volume: Patterns’ reliability increases with higher volume on the third candle.
- Ignoring Overall Market Context: Even a strong pattern fails if the broader market trend or sector momentum is strongly bearish.
Avoiding these mistakes helps traders filter false signals and improve the reliability of the Morning Star pattern. When combined with proper confirmation, support levels, volume analysis, and overall market context, the pattern can offer a stronger and more reliable bullish reversal signal.
Difference between Morning Star & Evening Star
The difference between the morning star and the evening star is mentioned below in the table.
| Feature | Morning Star | Evening Star |
| Trend Context | Appears after a downtrend | Appears after an uptrend |
| Signal Type | Bullish reversal | Bearish reversal |
| First Candle | Large bearish candle | Large bullish candle |
| Second Candle | Small candle (indecision – doji/spinning top) | Small candle (indecision – doji/spinning top) |
| Third Candle | Strong bullish candle closing above midpoint of first candle | Strong bearish candle closing below midpoint of first candle |
| Market Psychology | Selling pressure weakens and buyers take control | Buying pressure weakens and sellers take control |
| Expected Move | Potential price rise | Potential price fall |
A morning star indicates a potential bottom and bullish reversal, while an Evening Star indicates a potential top and bearish reversal.
What are Other Candlesticks besides Morning Star?
There are six other well-known bullish reversal candlestick patterns besides morning star. These candlestick patterns are briefly discussed below.
- Hammer Candlestick Pattern: A single candlestick pattern that appears after a downtrend with a small real body and a long lower shadow, indicating strong rejection of lower prices and potential buying pressure.

- Bullish Engulfing Pattern: A double-candlestick pattern where the first bearish candle is completely engulfed by the second large bullish candle, signaling a strong shift from sellers to buyers.

- Piercing Line Candlestick Pattern: It is also a double-candlestick pattern, where the second candle opens below the low of the first candle and closes above the midpoint of the first candle, signaling bulls gaining control.

- Tweezer Bottom Candlestick Pattern: Occurs when two candles form a equal low, suggesting that the market has found strong support and buyers are stepping in.

- Three White Soldiers Candlestick Pattern: Three consecutive bullish candles appear after a strong downtrend, indicating sustained buying momentum.

- Inverted Hammer Candlestick Pattern: A single candlestick pattern appears at the bottom of a downtrend with a long upper shadow, suggesting that buyers attempted to push prices higher and a reversal may follow.

These bullish reversal patterns are most effective when they appear after a clear downtrend and near important support levels, especially when confirmed with indicators like RSI, volume, or moving averages.


 Previous Article


 2026: Features, Pros vs Cons, Pricing, Reviews, Is It Worth It? 48")
 2026: Features, Pros vs Cons, Pricing, Reviews, Is It Worth It? 49")
 2026: Features, Pros vs Cons, Pricing, Reviews, Is It Worth It? 50")


 : Definition, Formula, calculation, Uses, Advantages Vs limitations 54")


No Comments Yet.