


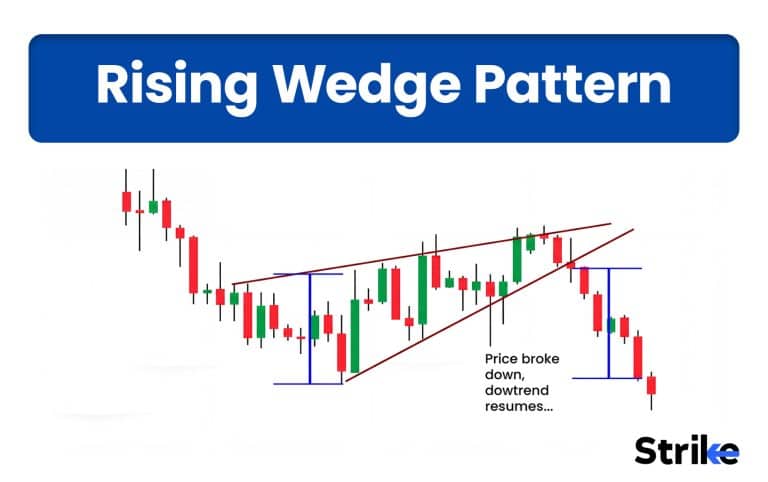


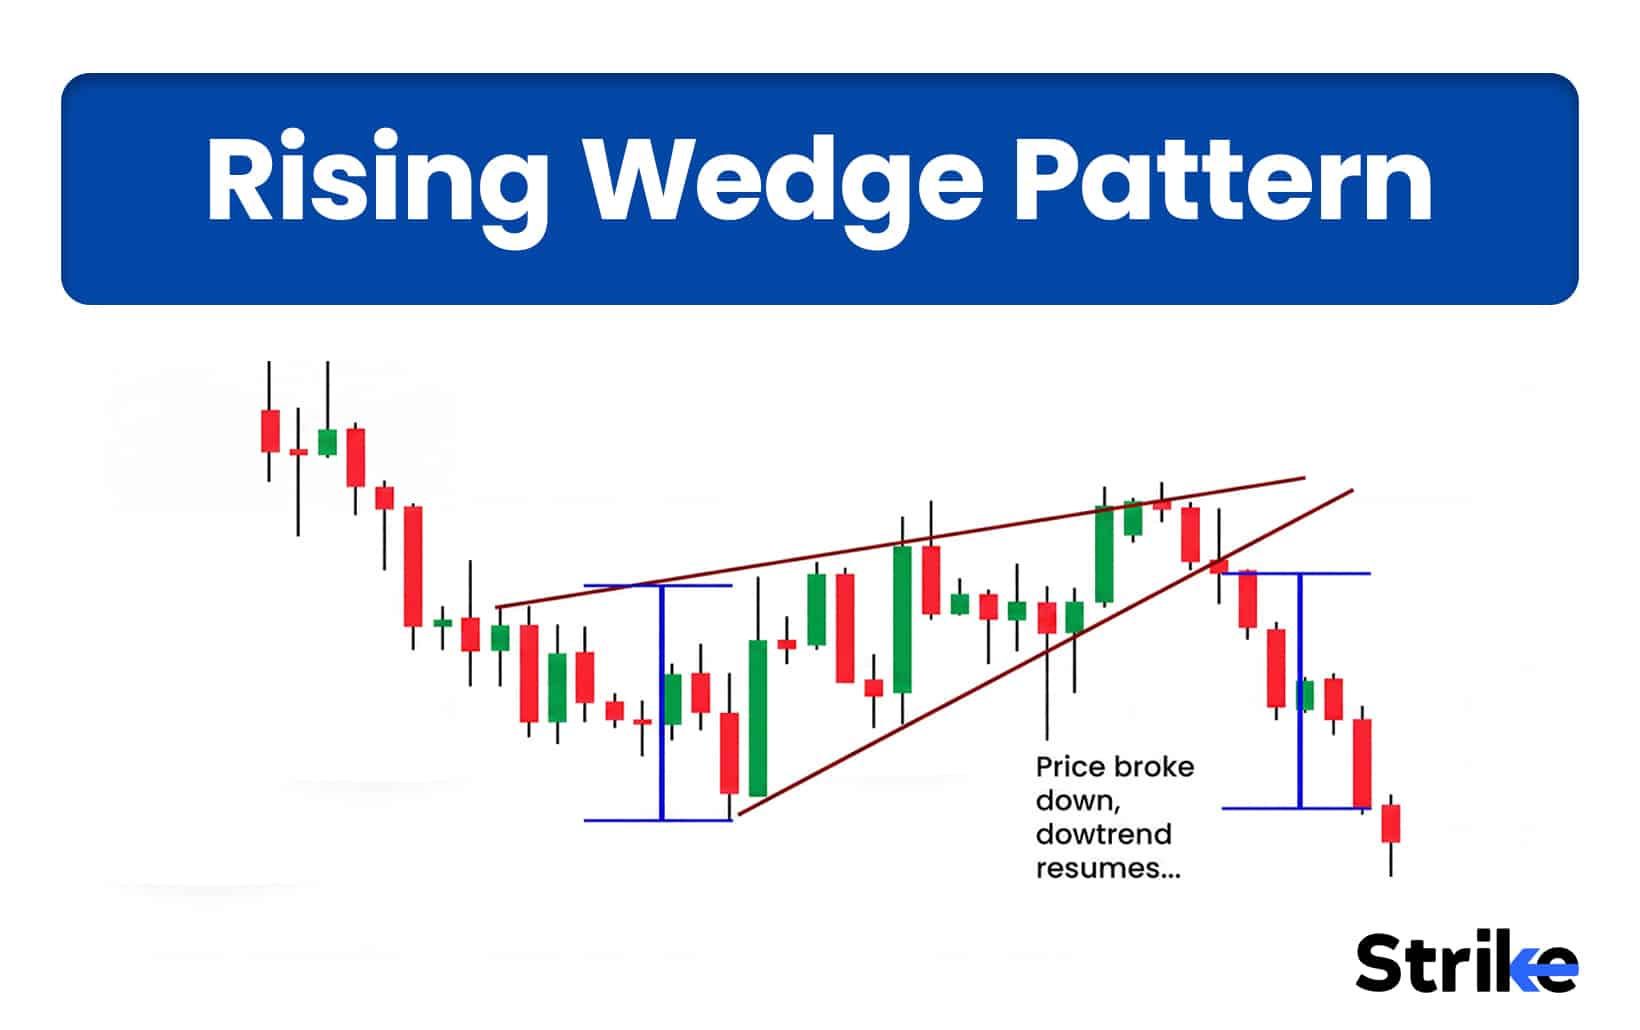
Rising wedge is one of the popular chart patterns used by technical traders, because it signals an exhaustion of a strong rally and an upcoming significant price reversal. Rising wedge got his name because of its appearance where it has a narrowing, upward-sloping price structure that resembles a wedge.
Whether you trade stocks, forex, cryptocurrencies, or commodities, recognizing this pattern will help you to identify early trend reversals, which will not only help you identify high-probability bearish trading opportunities, but also exit your long positions to secure your profits and avoid buying near market tops. Understanding how a rising wedge develops, why it works, and how to trade it can improve your market timing, risk management, and overall trading performance.
What is a Rising Wedge Pattern?
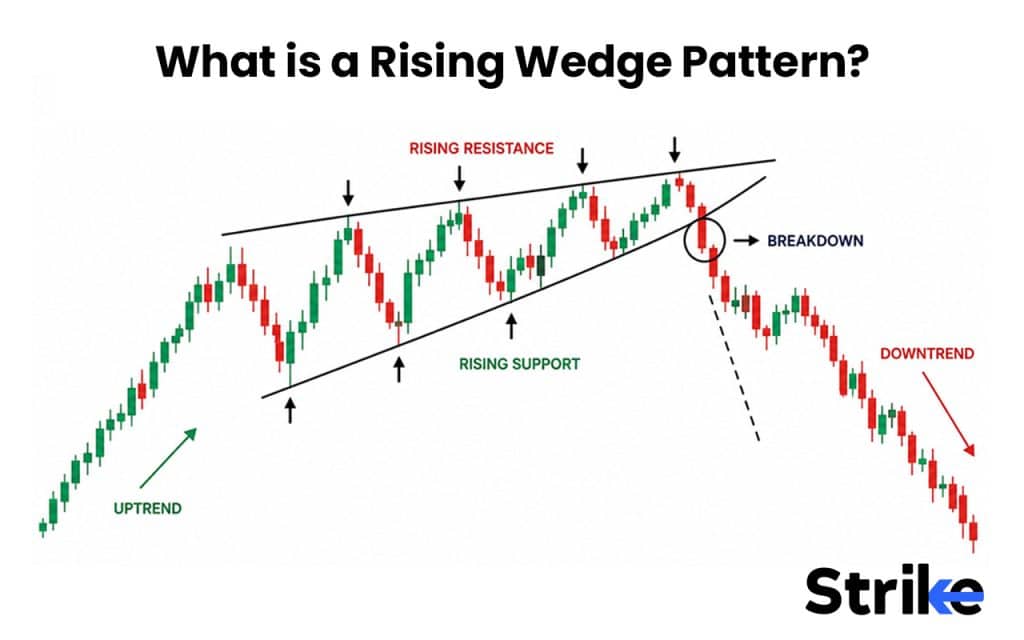
Rising wedge pattern is a bearish chart pattern in technical analysis which usually appears after a sustained uptrend and suggests the exhaustion of uptrend. It forms when price makes higher highs and higher lows, but each time the higher highs and higher lows forms are smaller than the previous one. This means that although the trend is structurally bullish, buyers are getting weaker in each rally and upward movement is gradually losing momentum.
Is the Rising Wedge Pattern Bullish or Bearish?
The rising wedge pattern is a bearish chart pattern which forms after a sustained uptrend and signals either trend reversal from bullish to bearish or bearish trend continuation. It indicates the weakening of upward momentum although the price is making higher highs and higher lows. Once price breaks this pattern (the lower trend line), trend shifts to bearish.
Rising Wedge Pattern in Uptrend vs Downtrend
The meaning of rising wedge pattern changes based on the context in which it appears, though the outcome of the pattern is the same, a downward move.
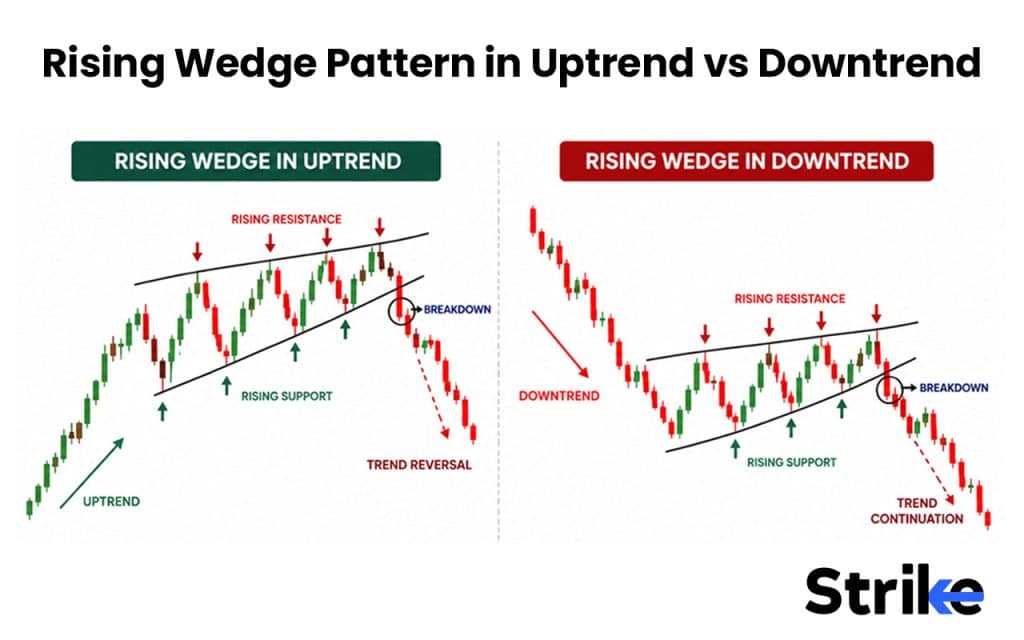
- In an Uptrend (trend reversal): If a rising wedge pattern appears in an uptrend, it signals that the upward momentum is now exhausted and the trend will reverse to bearish.
- In an Downtrend (trend continuation): If rising wedge pattern appears in a downtrend, it signals a temporary pause or a pullback of a price in an existing downtrend before price continues trading lower again, hence rising wedge in downtrend signals.
Rising wedges appearing after prolonged uptrends generally produce stronger bearish reversals than wedges forming during pullbacks in downtrends because they trap late buyers.
How to Identify a Rising Wedge Pattern on Chart
There are five simple steps to identity rising wedge pattern on chart which are briefly discussed below.
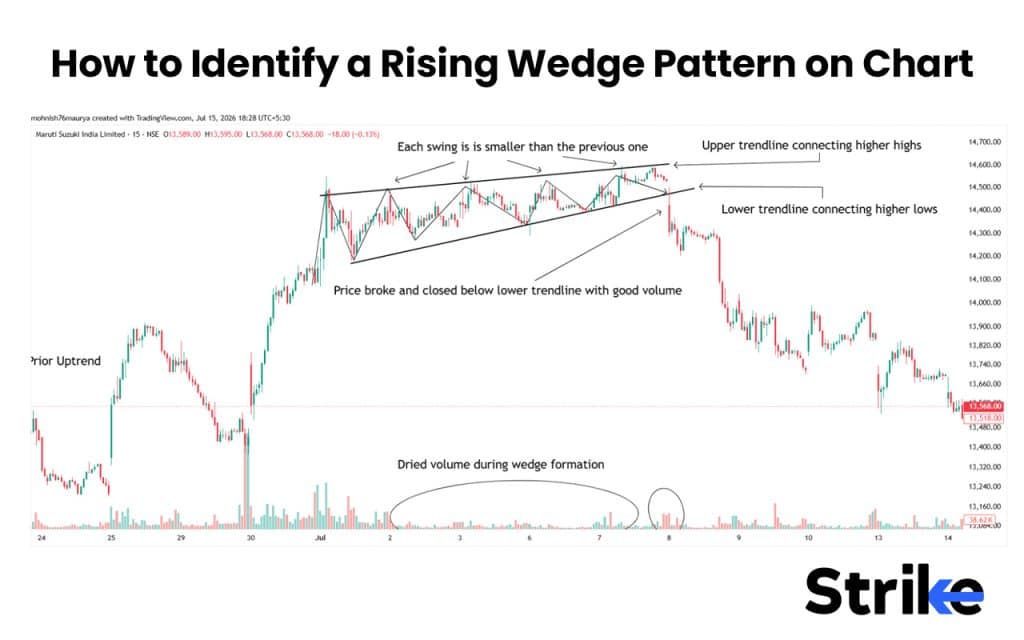
- Identify the existing trend: Look whether the market is in uptrend or downtrend, because in an uptrend rising wedge will act as a reversal pattern while in downtrend it will act as a continuation pattern. You can use moving averages of 50 or 200 period to identify the market trend.
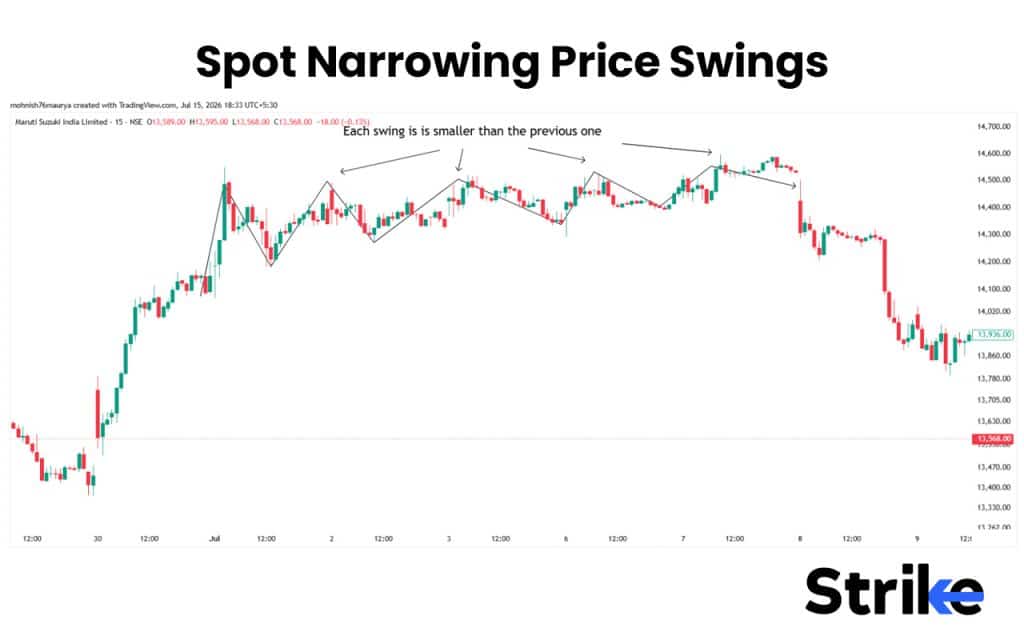
- Spot Narrowing Price Swings: After you have identified a trend, look for higher highs and higher lows, where each swing (higher highs and lows) is smaller than the previous one.
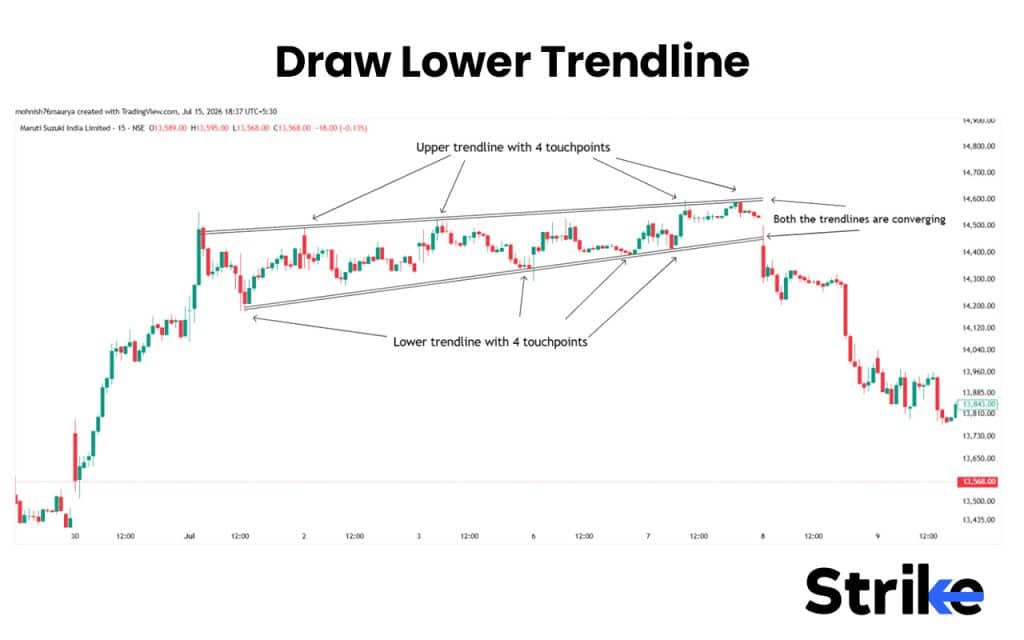
- Draw Two Upward-Sloping Trendlines: Draw upward converging trendlines connecting these swing points. Draw lower trendlines by connecting higher lows and draw upper trendlines by connecting higher highs. Ideally the wedge should contain at least five reversal points (three touches on one trendline and two on the other).
- Watch Trading Volume: During this time, volume usually declines indicating that buyers are losing their interest to push the price up.
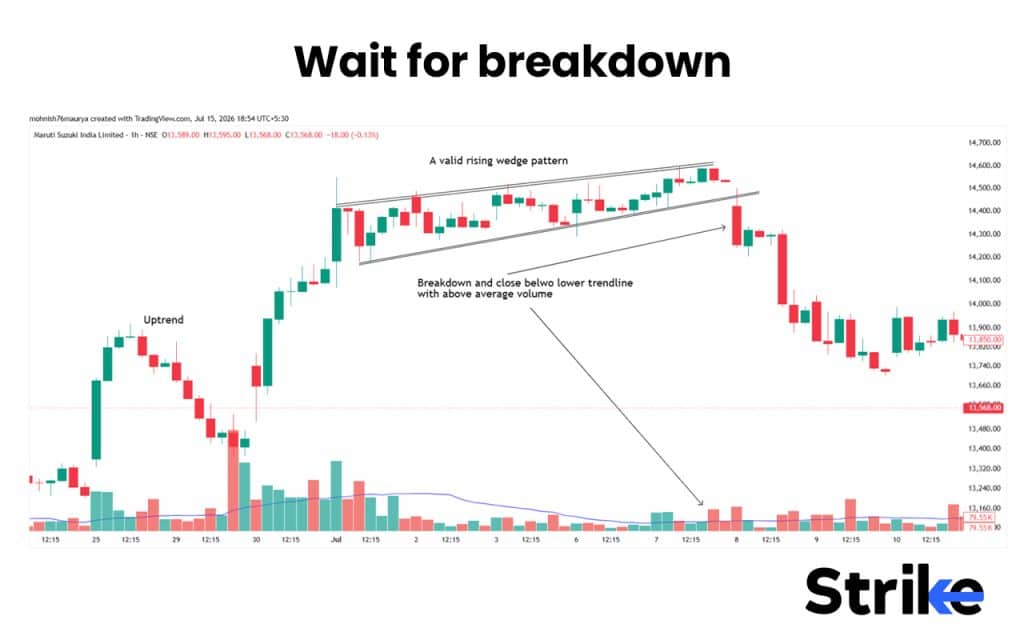
- Wait for the Breakdown: The pattern gets completed once the price breaks the pattern low or lower trendline. Make sure that the breakdown volume is above average for even stronger confirmation.
During my analysis, I have observed that among various Chart Patterns, the rising wedge formed after a strong uptrend and RSI divergence gives the strongest reversal trade with a win rate exceeding 70%. However, when trading these Chart Patterns, it is very important to wait for a confirmed breakdown no matter how strong the setup appears.
The Psychology Behind the Rising Wedge Pattern
The rising wedge pattern reflects a gradual shift in power from buyers to sellers. Let’s understand this psychological shift in five steps.
- Stage 1 (Buyers Are in Control): At this stage, buyers are usually strong, pushing the price higher to new highs.
- Stage 2 (Buying Momentum Starts to Fade): At this stage price still continues to rise by making higher highs/lows, but each of these swings starts to get smaller than the previous one. This means buyers are now struggling to push prices higher.
- Stage 3 (Sellers Gradually Gain Strength): At this stage, sellers gradually gain strength and start absorbing the buying pressure.
- Stage 4 (Market Reaches a Decision Point): At this stage, the converging trendlines show the battle between buyers and sellers is tightening, where buyers no longer have enough strength to push the price significantly higher.
- Stage 5 (Bearish Breakdown): Sellers finally take control and push the price lower, breaking the lower trendline. Exit of buyers and entering of new sellers accelerate this decline.
This is how power shifts from buyers to sellers. Keep in mind that stronger the upward move, more reliable will be the pattern.
How to Draw a Rising Wedge on a Trading Chart
A rising wedge pattern is drawn by two upward-sloping converging trendlines that connect a series of higher highs and higher lows.
- Spot Narrowing Price Swings: First look for higher highs and higher lows, where each swing (higher highs and lows) is smaller than the previous one.
- Draw Lower Trendline: Draw a trendline connecting higher lows with a minimum of 3-4 touchpoints. This creates an upward sloping lower trendline of the pattern.
- Draw Upper Trendline: Draw a trendline connecting higher highs with a minimum of 3-4 touchpoints. This creates an upward sloping upper trendline.
Make sure that both the trendlines are converging, which means the lower trendline should ride faster than the upper trendline. Avoid forcing trendlines, connecting candles and shadow randomly and drawing trendline with only 2 touch points.
How to Trade the Rising Wedge Pattern
There are five important steps to trade the rising wedge pattern. The steps include pattern identification, confirmation, entry, stop-loss, and target.
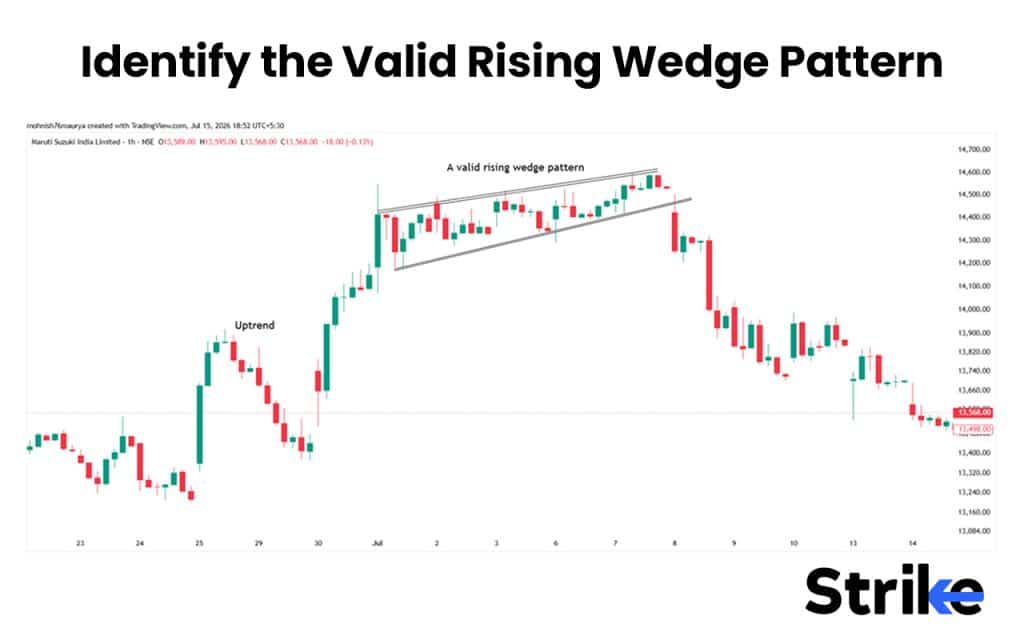
- Identify the Valid Rising Wedge Pattern: A higher highs and higher lows pattern within an upward converging trendline supported by a decline in trading volume.
- Wait for breakdown: Wait for price to break and close below lower trendline with a volume above average.
- Entry: If you are an aggressive trader, you enter immediately after price closes below lower trendline, otherwise you can wait for price to re-test the broken level, for conservative entry.
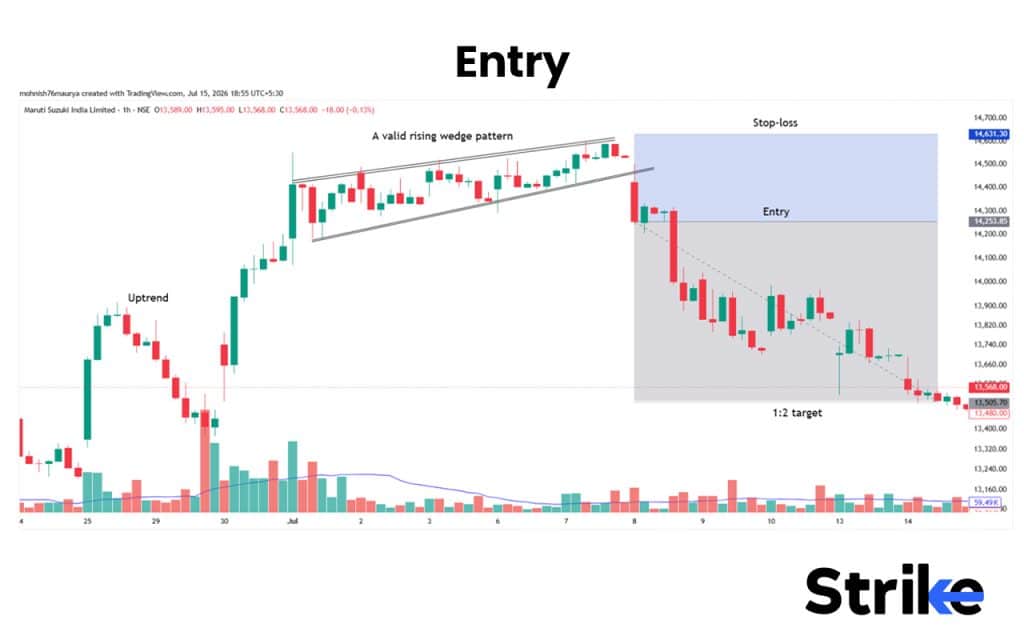
- Stop-loss: Place the stoploss above the most recent swing high or above patterns high. Try to keep some buffer space between upper trendline and stoploss to avoid getting stopped out by normal price fluctuations.
- Profit Target: For target, you can measure the height of the pattern and project it downward from breakdown point or else you can look for 1:2 risk to reward ratio.
Consider shifting your stoploss to breakeven once your 1:1 RR Price Target is achieved. You can also look for booking partial profits at that initial Price Target and then trail the remaining quantity to maximize your gains.
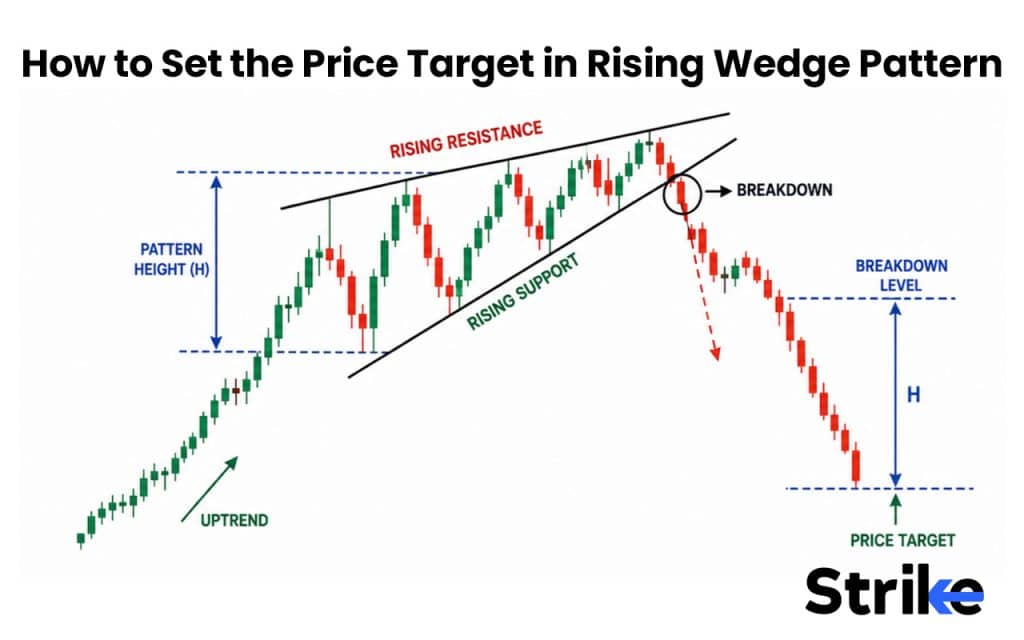
How to Set the Price Target in Rising Wedge Pattern
To set a price target in a rising wedge pattern, measured move technique is the most widely used method where you set a profit target based on the height of the pattern. You measure the height of the pattern and project it downwards from the level of breakdown to get a profit target. You can go for a 1:1.5 or 1: 2 risk reward profit target or next key level.
Stop-Loss & Risk Management in Rising Wedge Pattern
Stop-loss and risk management is an essential part of trading a rising wedge pattern because no pattern is 100% accurate. There are three ways to put stop-loss while trading a rising wedge pattern.
- Above Recent Swing High: Put your stop-loss above recent swing high within a pattern.
- Above Upper Trendline: Place your stop-loss above upper trendline with some buffer space in between upper trendline and stop loss to avoid getting stopped out by normal price fluctuations.
- Above a Breakout Candle: If you are an aggressive trader, you can put your stoploss above the breakdown candle high.
Professional traders typically look for a 1:2 RR, which requires a well-placed stop loss to ensure effective risk management. It is also important that you never risk more than 2-3% of your total capital per trade; using a disciplined stop loss as part of your overall risk management strategy is essential to protect against serious drawdowns.
How Reliable Is the Rising Wedge?
Rising wedge pattern is considered to be a moderately reliable chart pattern, however the actual reliability heavily depends on market context and how you trade it. According to research by Thomas Bulkowski, one of the most respected researchers on chart patterns, a rising wedge breaks downward about 69% of the time.
However, not every breakdown leads to a large decline, and false breakouts are common. Out of all breakdowns, 72% of them show pullbacks meaning price often retest the breakdown level. A price falls 9% on an average after breakdown. The reliability of a pattern increases when combined with indicators like RSI, MACD, moving averages etc.
Our Backtesting Result with Rising Wedge Pattern
We, at Strike Money, manually backtested 100 Rising Wedge patterns on NSE-listed large- and mid-cap stocks to evaluate how consistently the pattern identifies bearish reversals. We found that the standard Rising Wedge pattern delivered a 64% win rate when traded only after a confirmed breakdown below the lower trendline. However, when we added an additional filter of RSI above 70 along with bearish RSI divergence before the breakdown, the setup became more selective and produced higher-quality trades, with the win rate improving to 72%.
Backtest Setup
| Backtest Parameter | Details |
| Pattern Tested | Standard Rising Wedge Pattern |
| Market | NSE-listed large- and mid-cap stocks |
| Timeframe | Daily chart |
| Trade Direction | Short / bearish setup |
| Entry Rule | Sell after price closes below the lower trendline |
| Alternative Entry | Sell on the retest of the broken trendline |
| Stop-Loss Rule | Above the recent swing high or upper trendline |
| Target Rule | Measured move or minimum 1:2 risk-reward |
| Risk Rule | Minimum 1:1.5 risk-reward |
| Confirmation Used | Prior uptrend, declining volume during formation, high-volume breakdown, RSI filter |
| Avoided Setups | Sideways markets, weak breakouts, low-volume breakdowns, poorly defined wedges |
Backtest Logic
The strategy followed 8 fixed rules.
- Identify a strong prior uptrend.
- Confirm a valid Rising Wedge with converging upward-sloping trendlines.
- Prefer setups where RSI is above 70 and forms bearish divergence.
- Wait for a daily candle to close below the lower trendline.
- Enter on the breakdown candle or on the retest of the broken trendline.
- Place the stop-loss above the recent swing high or upper trendline.
- Target the measured move or maintain at least a 1:2 risk-reward ratio.
- Exit early if the price re-enters the wedge with strong bullish momentum.
Backtest Result Summary
| Metric | Standard Rising Wedge | Rising Wedge + RSI > 70 & Divergence |
| Total Patterns Tested | 100 | 58 |
| Winning Trades | 64 | 42 |
| Losing Trades | 36 | 16 |
| Win Rate | 64% | 72% |
| Average Risk-Reward | 1:2.0 | 1:2.3 |
| Average Winning Trade | 7.2% | 8.1% |
| Average Losing Trade | 3.6% | 3.4% |
Key Findings
- Our manual backtest produced a 64% win rate using the standard Rising Wedge pattern.
- Adding an RSI above 70 with bearish divergence improved the win rate to 72% by filtering out weaker setups.
- Retest entries provided better risk-reward than entering immediately after the breakdown.
- Rising Wedges accompanied by declining volume during formation and above-average volume on the breakdown showed higher reliability.
- Patterns that formed after strong, extended uptrends significantly outperformed those that developed during short rallies or sideways markets.
- False breakdowns were most common in low-volume and range-bound market conditions, making volume confirmation one of the most important filters.
How to Avoid False Breakouts in a Rising Wedge Pattern
A false breakdown in rising wedge happens when price closes below the lower trendline of the pattern, signalling trend reversal, but price quickly reverses back inside the wedge. There are six important points you should consider while trading a rising wedge pattern to avoid such false breakdown.
- Wait for a Confirmed Candle Close: Avoid entering immediately after price breaks the lower trendline. Wait for the candle to close below the lower trendline, because it carries more weightage.
- Confirm with Higher Trading Volume: A genuine breakdown is usually supported by above average volume. A breakdown with high volume signals strong seller participation, whereas breakdown with less volume usually has chances of failure.
- Look for Momentum Confirmation: Take help of momentum indicators like RSI, MACD, ADX or EMA to get additional confirmation on breakdown. For instance, breakdown in rising wedge patterns supported by RSI divergence or RSI falling below 60 increases the patterns reliability.
- Wait for a Retest: Although the aggressive trades enter after candle closes below lower trendline, you can wait for price to retest the broken support trendline. If price forms a reversal candle pattern or bearish pattern after retest, the pattern gets even more reliable.
- Avoid Trading Near Major Support: If the rising wedge pattern forms just above a strong historical support level avoid trading such wedge pattern or trade only when the support level is clearly broken or trade with less quantity.
Best Timeframes & Markets to Trade Rising Wedge Pattern
Rising wedge patterns can be traded in almost every financial market and timeframe. However, its reliability is comparatively good on higher timeframes like 4hrs, daily and weekly, because it shows broader market psychology.
| Timeframe | Characteristics |
| 1-Minute to 15-Minute Charts | Frequent patterns but high market noise and false breakdowns. Best for scalping with strict risk management. |
| 1-Hour to 4-Hour Charts | Good balance between reliability and trading opportunities. Ideal for intraday and swing traders. |
| Daily Charts | Most reliable timeframe. Reflects stronger market sentiment with more consistent breakdowns. |
| Weekly Charts | Rare but highly reliable. Suitable for long-term positional trades and major trend reversals. |
Why does the Price Squeeze in a Rising Wedge Pattern?
In rising wedge pattern price squeeze because neither side (bears and bulls) has clear control on the market at that particular. The buyers slowly start losing interest to push price higher, reducing the buying momentum, whereas sellers gradually start entering the market absorbing the buyers orders. Therefore, during this indecisive transitional phase, where power shifts from buyers to sellers, the price squeezes.
Difference between a Rising Wedge and a Rising Channel
| Feature | Rising Wedge | Rising Channel |
| Trendlines | Upward-sloping and converging | Upward-sloping and parallel |
| Price Movement | Higher highs and higher lows with narrowing swings | Higher highs and higher lows with consistent swings |
| Momentum | Gradually weakening | Remains strong and steady |
| Volume | Often declines during formation | Usually remains stable or gradually increases |
| Market Psychology | Buyers are losing control, sellers are gaining strength | Buyers remain in control of the trend |
| Typical Signal | Bearish reversal or bearish continuation | Bullish continuation |
| Breakout Direction | Usually breaks below the lower trendline | Usually continues higher within the channel until a breakout occurs |
| Trading Strategy | Sell or short after a confirmed bearish breakdown | Buy near channel support and sell near channel resistance, or trade the breakout |
Difference between Rising Wedge vs Falling Wedge Pattern
| Feature | Rising Wedge | Falling Wedge |
| Trendlines | Upward-sloping and converging | Downward-sloping and converging |
| Price Movement | Higher highs and higher lows | Lower highs and lower lows |
| Market Psychology | Buying momentum weakens as sellers gain control | Selling momentum weakens as buyers gain control |
| Typical Signal | Bearish reversal or bearish continuation | Bullish reversal or bullish continuation |
| Breakout Direction | Usually below the lower trendline | Usually above the upper trendline |
| Volume | Often declines during formation and rises on breakdown | Often declines during formation and rises on breakout |
| Best Trading Strategy | Sell or short after a confirmed bearish breakdown | Buy after a confirmed bullish breakout |
| Profit Target | Measured below the breakdown point | Measured above the breakout point |
What are the Other Types of Pattern You Should Know?
The other types of pattern closely related to rising wedge pattern is briefly discussed below in the table.
| Chart Pattern | Typical Signal | How It Differs from a Rising Wedge |
| Falling Wedge | Bullish reversal / continuation | Slopes downward instead of upward and typically breaks upward. |
| Ascending Triangle | Bullish continuation | Has a flat resistance with rising support instead of converging upward trendlines. |
| Descending Triangle | Bearish continuation | Has a flat support with falling resistance rather than two rising trendlines. |
| Symmetrical Triangle | Neutral (bullish or bearish breakout) | Both trendlines converge toward each other without a clear upward slope. |
| Rising Channel | Bullish continuation | Trendlines remain parallel, indicating a healthy uptrend rather than weakening momentum. |
| Bear Flag | Bearish continuation | Forms after a sharp decline and represents a temporary pullback before the downtrend resumes. |
| Head and Shoulders | Bearish reversal | Reverses an uptrend using three peaks instead of converging trendlines. |
These patterns are often confused with the Rising Wedge, but each has a different market psychology, breakout behaviour, and trading strategy. Learning to distinguish between them will help you identify higher-probability trading opportunities and reduce false signals.


 Previous Article

![15 Investing.com Alternatives [Free+Paid] You Should Use in 2026](https://www.strike.money/wp-content/uploads/2026/04/Investing.com-Alternatives.jpg "15 Investing.com Alternatives [Free+Paid] You Should Use in 2026 40")
![15 TradeStation Alternatives [Free+Paid] You Should Use in 2026](https://www.strike.money/wp-content/uploads/2026/04/TradeStation-Alternatives.jpg "15 TradeStation Alternatives [Free+Paid] You Should Use in 2026 41")
![15 Chartink Alternatives [Free+Paid] You Should Use in 2026](https://www.strike.money/wp-content/uploads/2026/04/Chartlink-Alternatives.jpg "15 Chartink Alternatives [Free+Paid] You Should Use in 2026 42")



No Comments Yet.