Support and Resistance Decoded: Why Round Numbers Matter, Identification Rules, Confluence Rules & Real Trading Setup

 Author

 Editor
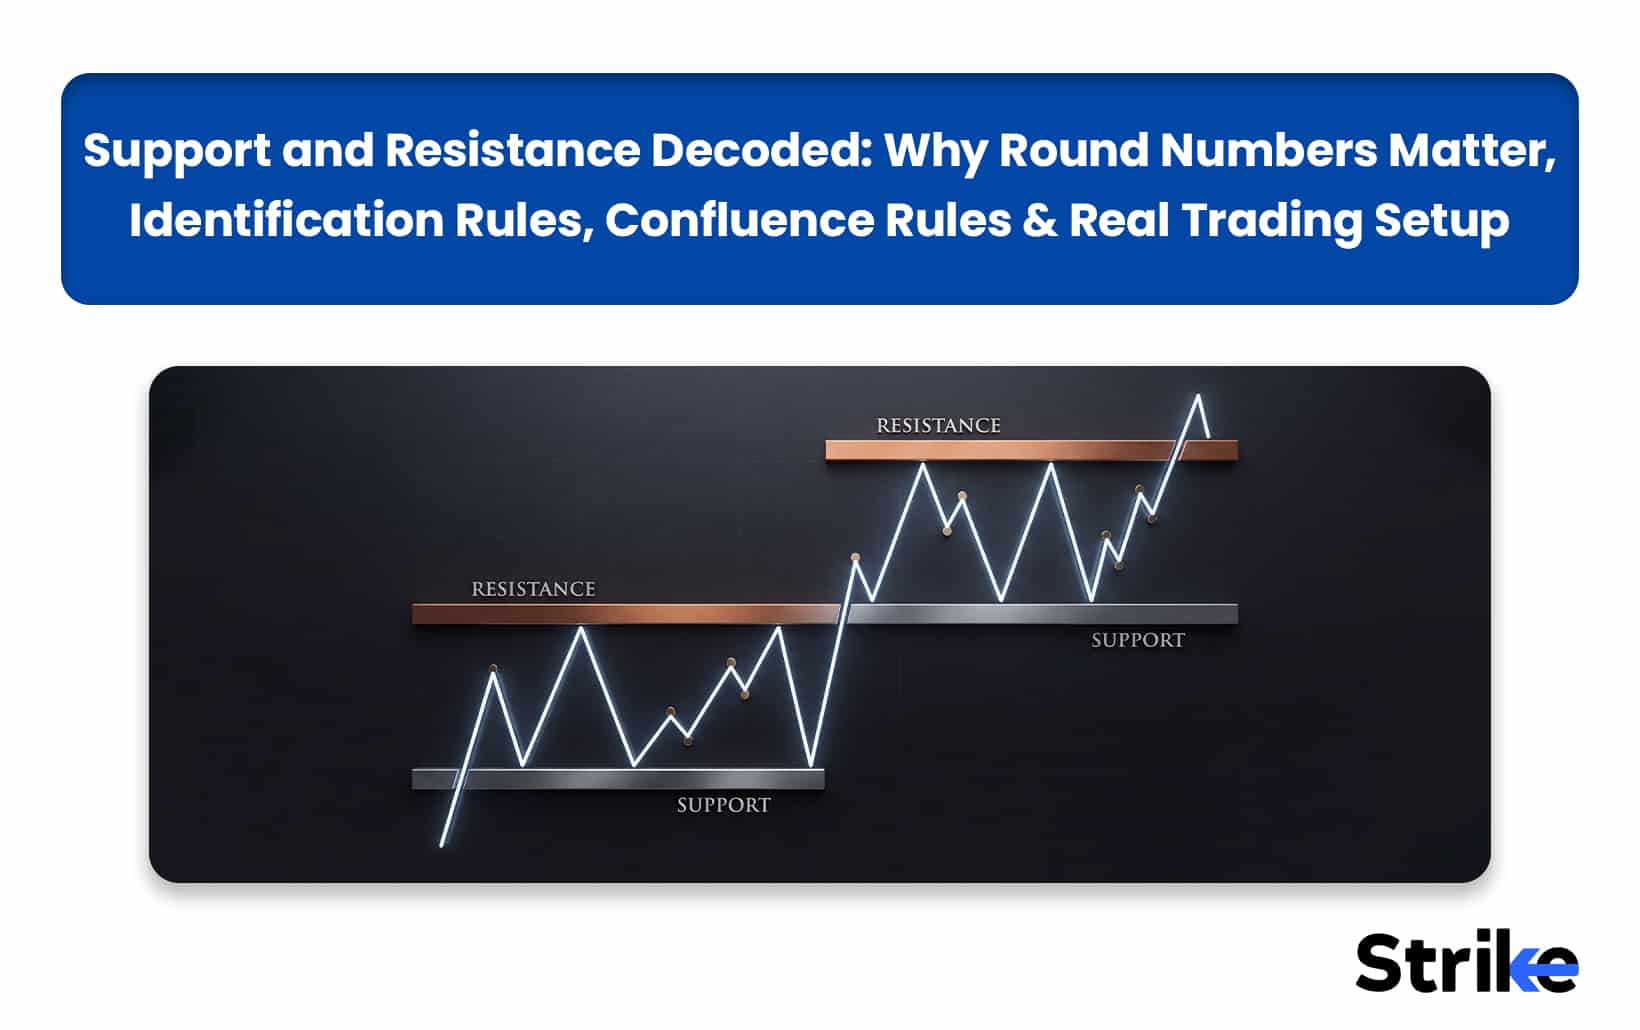
Support and resistance are the widely used concepts in technical analysis that helps traders in identifying potential reversal zones, breakout levels, and trading opportunities. Support and resistance looks like a simple concept to trade, but it is very important to know why these levels form, how to draw them correctly, and which ones matter most can make a real difference in trading decisions.
As Jesse Livermore famously said, “The big money is made in the big swings.” Hence by recognising important price levels, you can catch the swings at its start instead of chasing prices after they have already moved. In this blog, you will learn why round numbers matter, how to identify strong support and resistance zones, how to use confluence for better confirmation, and how to apply these concepts in a practical trading setup.
What Are Support and Resistance?
Support and resistance are key price levels from where the price trend either reverses or takes pause before continuing its existing trend.
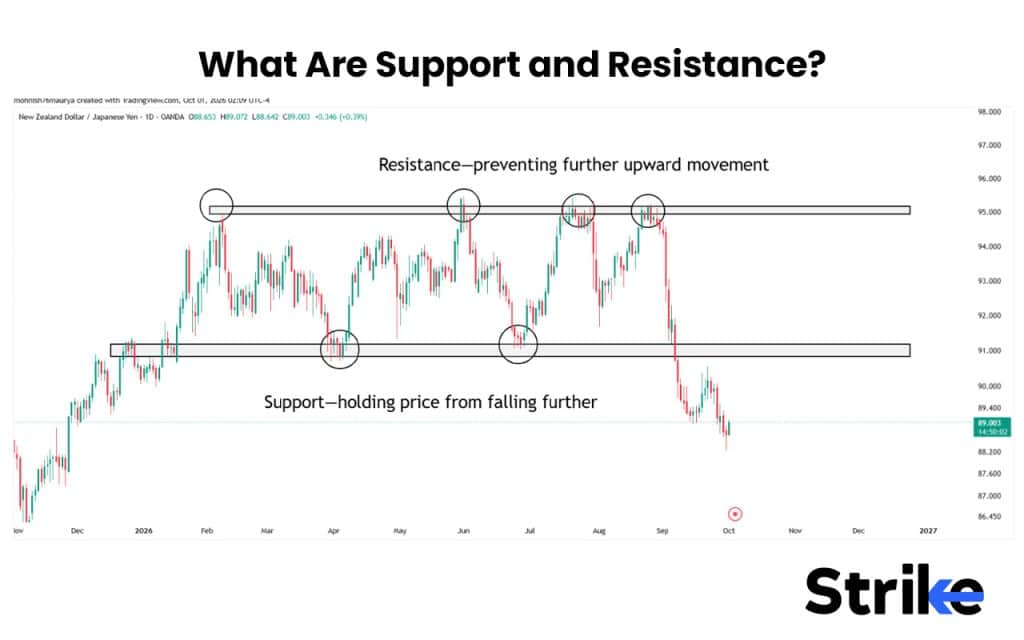
- Support: A price level where buyers are most active. When price reaches this level after a fall, it is expected that buyers will enter and support the price from falling.
- Resistance: A price level where sellers are more active. When price reaches this level from below, sellers resist price from moving up.
A level acts as support and resistance because of concentrated orders of buying and selling at that particular level.
Why Do Support and Resistance Levels Form?
Support and resistance forms when a large number of market participants reacts in the same area. There are five major reasons why a large number of traders react at the same price level.
- Previous Price Reactions or previous highs and lows: Traders remember such areas from where price previously has reversed and expect a similar reaction when price returns to that area.
- Trapped Traders: Traders stuck in losing position will try to exit at breakeven point, creating additional buying or selling pressure.
- Institutional Orders: Large participants may accumulate or distribute positions around specific price zones, creating significant demand or supply.
- Market Psychology and Expectations: Fear, greed, profit-taking, and the fear of missing out can cause many participants to make similar decisions around the same price area.
- Technical Levels: Indicators, trendlines, moving averages, Fibonacci levels, and chart patterns can lead different traders to identify the same price area.
The stronger the number of independent factors pointing to the same price area, the more attention that zone may receive from market participants.
Why does Price Bounce Off Support?
Prices bounce off support due to increased buying orders. These buying orders typically come from three major sources.
- Short sellers book profit near support by buying the sold stock.
- New buyers or buyers who missed previous bounce and funds who wanted the stock at a cheaper price finally got their price.
- Already existing traders who re-enter or increase their quantity.
Note that bounce is not guaranteed. If selling pressure overcomes the buyers, price will continue falling fueled by buyers stop loss.
Why are Round Numbers Important?
Round numbers are psychological numbers. Humans always place their orders to the nearest round numbers like ₹500, ₹1,000, Nifty 25,000 or Bank Nifty 55,000. These numbers are also easy to remember and come handy during risk management.
According to Osler’s research, more than 70% of FX support and resistance levels ended in 0 such as ₹1000 or ₹950.
Osler’s research was based on 1990s currency markets. We wanted to see whether the same behaviour appears in the Nifty 50, so we tested 9.5 years of one-minute Nifty data from April 2017 to September 2026.
We looked at around 18,000 touches of round levels such as 50, 100, 500 and 1,000 points. A level was counted as a bounce if Nifty returned to the side it came from within 15 minutes. We compared these results with more than 740,000 touches of random non-round levels on the same trading days.
Finding 1: Round numbers did not always act as stronger support or resistance
On normal trading days, the bigger round numbers actually bounced slightly less often than random levels.
| Level | Round-level bounce | Random-level bounce | Difference |
|---|---|---|---|
| 1,000 points | 50.3% | 53.9% | −3.6 pts |
| 500 points | 48.5% | 53.4% | −4.8 pts |
| 100 points | 52.6% | 53.9% | −1.3 pts |
| 50 points | 54.2% | 53.9% | +0.3 pts |
The difference was more noticeable at 500- and 1,000-point levels. On daily charts, however, round numbers did not show a meaningful difference from random levels.
What does this mean for traders?
- A round number is not automatically a support or resistance. Our data did not show a consistent advantage from simply trading around 500 or 1,000-point levels.
- Watch for moves through obvious levels. Stops and other orders can be clustered around widely watched prices, so a level can be breached before price reverses.
- Option strikes may matter more near expiry. Strike levels showed somewhat stronger behaviour during expiry afternoons.
- The effect is small. These differences are only a few percentage points, so round numbers should be used with price action and other market context rather than as standalone signals.
Support & Resistance Formula
There is no specific formula for support and resistance since drawing them is totally a manual method. However, the support and resistance drawn by pivot points uses a formula which is briefly discussed below.
- Pivot Point (P) = High + Low + Close / 3
- First Resistance (R1) = (2 × P) − Low
- First Support (S1) = (2 × P) − High
- Second Resistance (R2) = P + (High − Low)
- Second Support (S2) = P − (High − Low)
- Third Resistance (R3) = High + 2 (P − Low)
- Third Support (S3) = Low − 2 (High−P)
For instance, yesterday Nifty made a high of 25,200, a low of 24,900 and closed at 25,100.
The pivot support and resistance would be calculated as follows.
| Level | Calculation | Value |
|---|---|---|
| R2 | 25,066.67 + 300 | 25,366.67 |
| R1 | 2 × 25,066.67 − 24,900 | 25,233.33 |
| Pivot (P) | (25,200 + 24,900 + 25,100) ÷ 3 | 25,066.67 |
| S1 | 2 × 25,066.67 − 25,200 | 24,933.33 |
| S2 | 25,066.67 − 300 | 24,766.67 |
Remember that no formula captures real order flow. Pivots are a starting map. Levels drawn from actual price reactions, covered below, carry more weight.
Should Support and Resistance be a Line or a Zone?
Support and resistance should be marked as a zone instead of drawing it as a line because orders are always spread across different bands of prices, not stacked at one exact rupee. But how broad should the range be? Well, there is no universal rule for drawing support and resistance zones, just try to connect maximum touchpoints possible including wick and body of the candles.
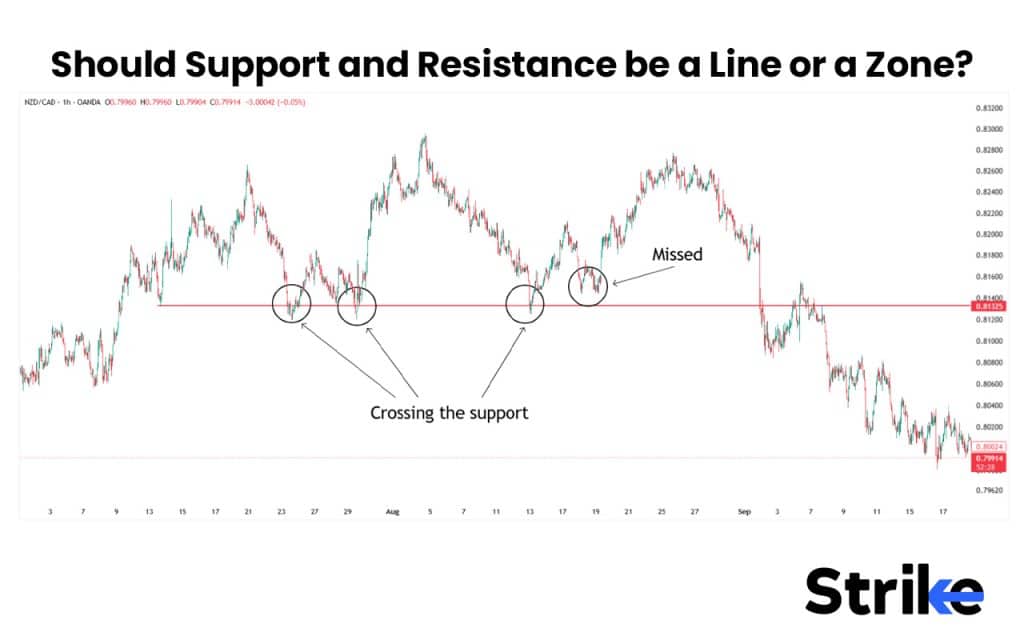
In the above screenshot, you can clearly see how drawing a support as a single line is missing some of the key swing points where some key swings are forming below it.
Let’s now draw a support zone on the same chart to see whether it covers all the important swings.
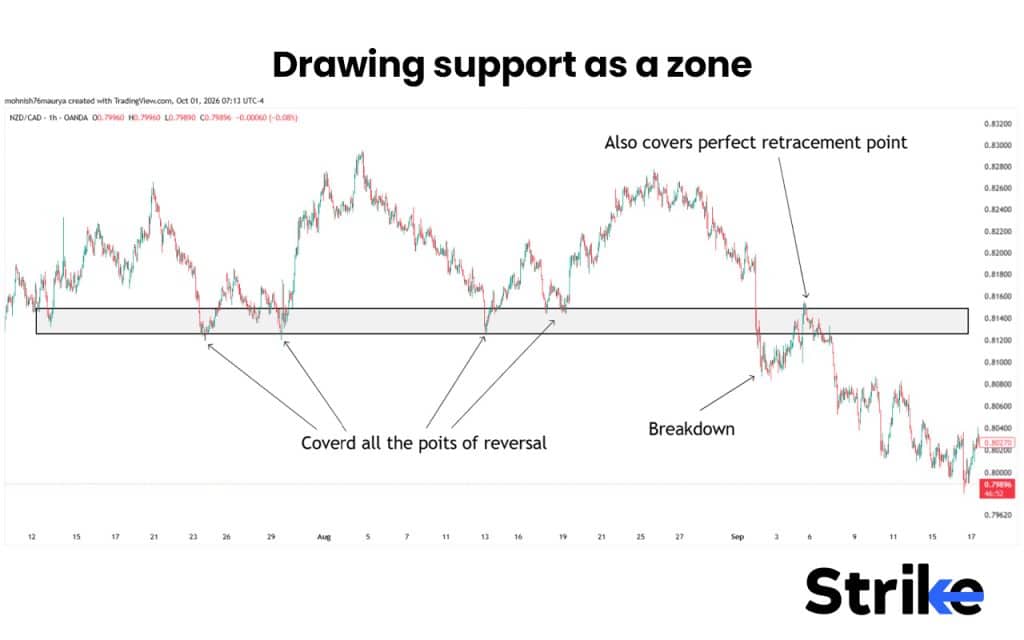
As you can see in the screenshot above, drawing support as a zone is covering all the major reaction points. Also how beautifully the price has taken rejection from the same zone after breakdown.
However, to keep your zone reasonably narrow, a practical rule is to make the zone around 0.5× to 1× the stock’s daily ATR. If the zone becomes wider than 1 ATR, it may become too broad to be useful.
How Do You Identify Support and Resistance Levels?
There are six common ways to identify support and resistance which are briefly discussed below.
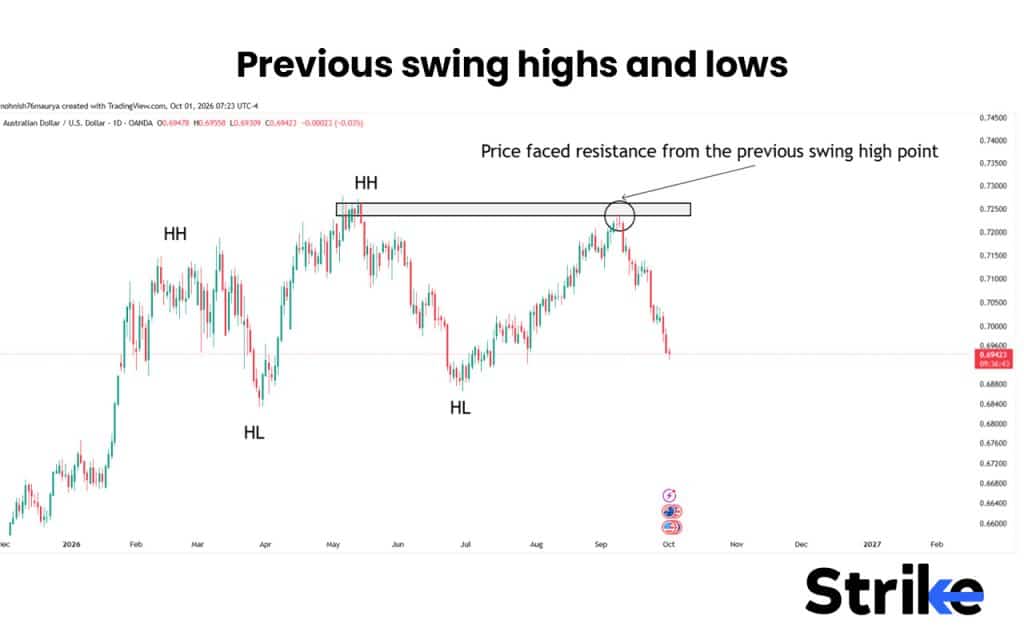
- Previous swing highs and lows: A previous low can act as support, while a previous high can act as resistance. If the price swings are larger, the previous highs or lows works better as resistance and support.
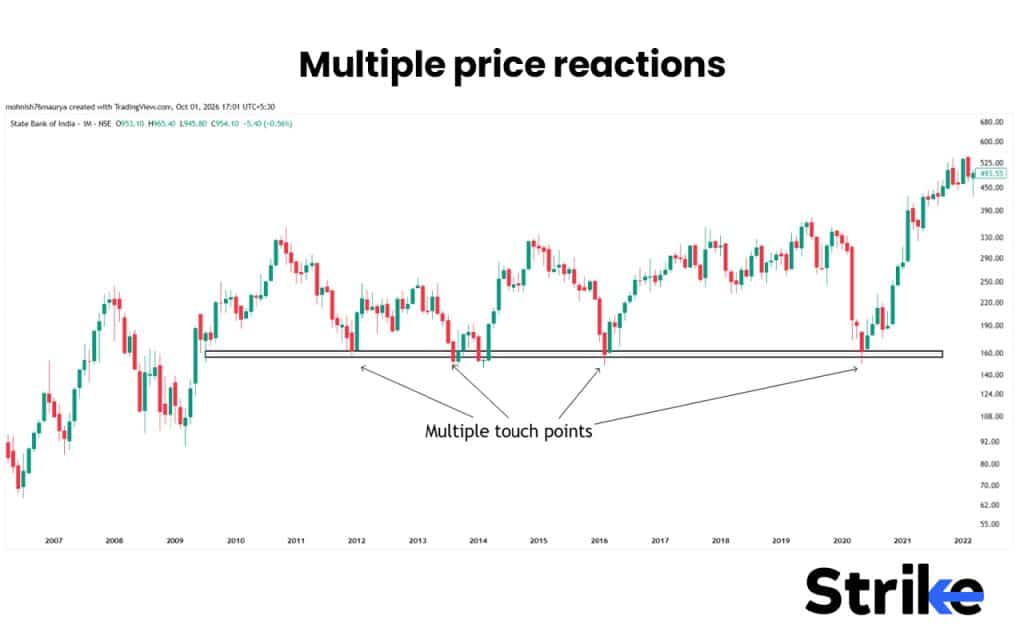
- Multiple price reactions: If price repeatedly turns around the same area, that area becomes more important.
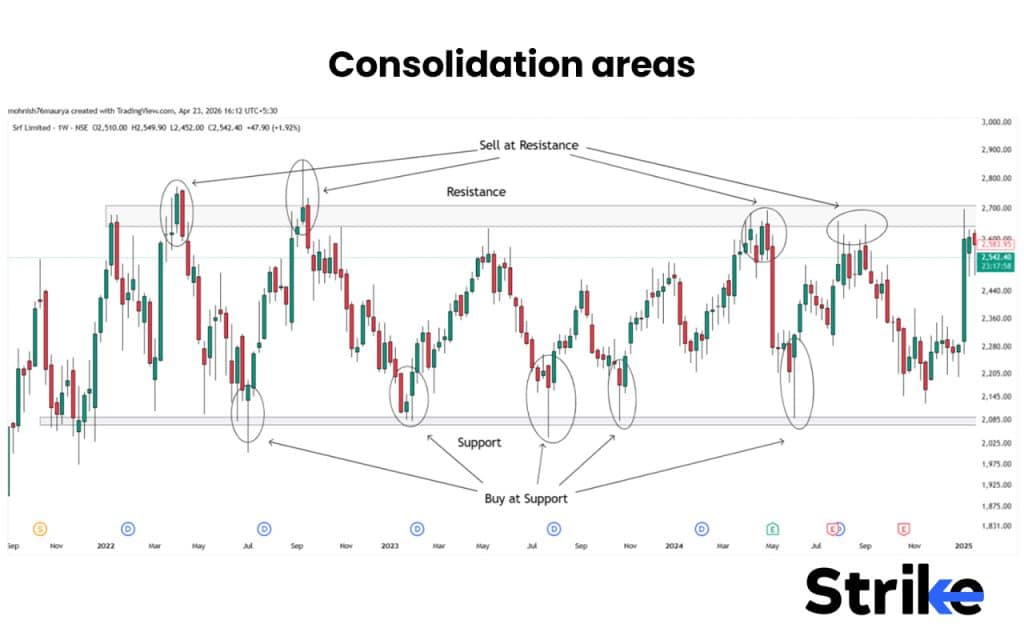
- Consolidation areas: A range where price moves sideways can create support near the lower end and resistance near the upper end.
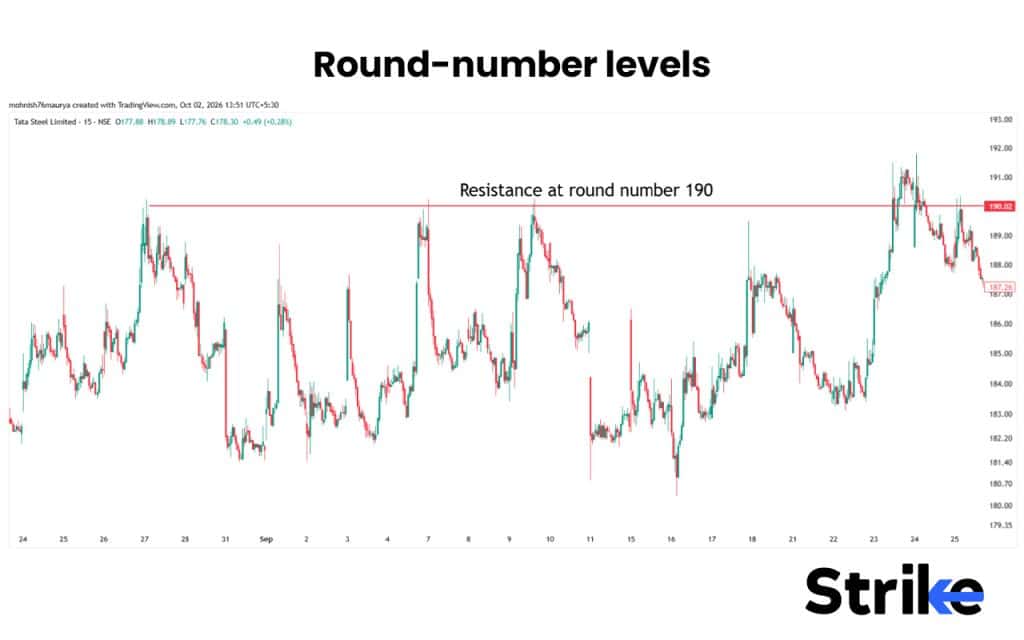
- Round-number levels: Prices such as ₹100, ₹500, or ₹1,000 can sometimes attract attention because they are easy for traders to remember. However, these levels are only used on smaller timeframes and they usually break easily.
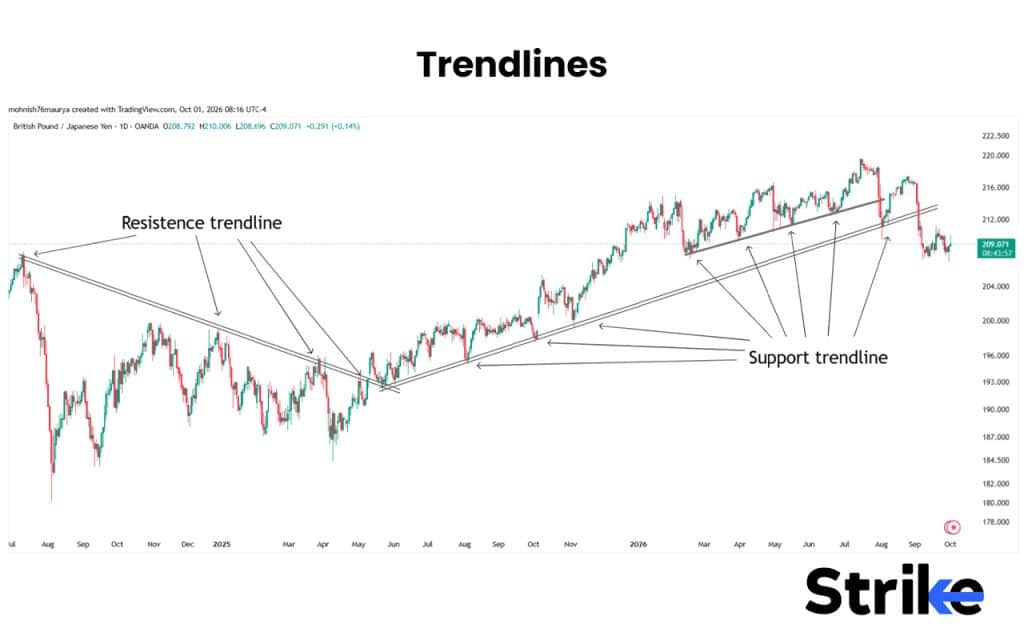
- Trendlines: Connecting rising lows can help identify dynamic support, while connecting falling highs can help identify dynamic resistance.
- Moving averages: In a trending market, moving averages such as the 20-day or 50-day average can sometimes act as dynamic support or resistance.
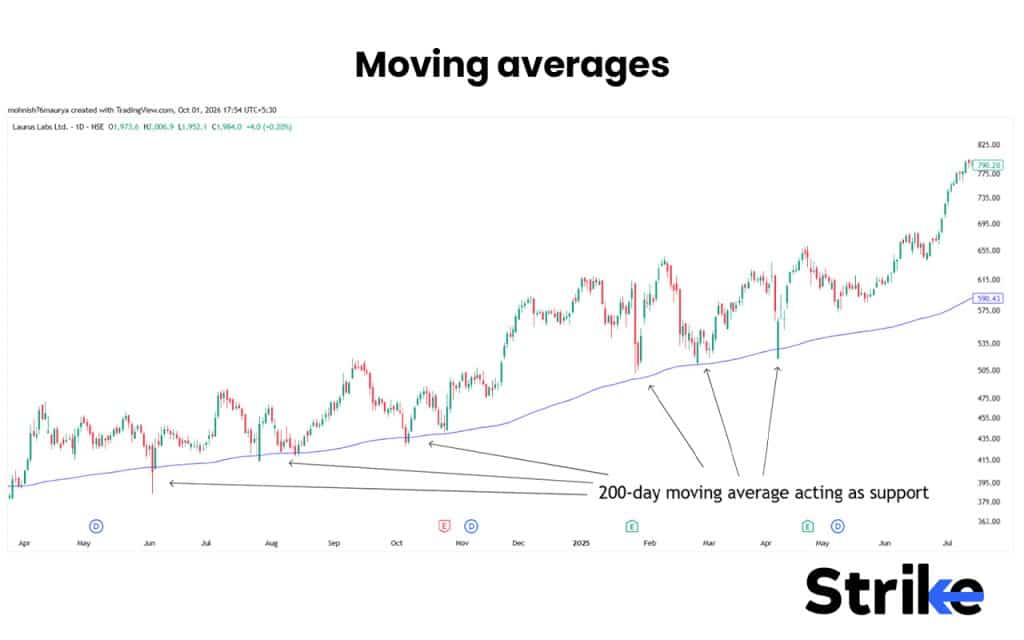
As a beginner you might get confused on which swing points or price level to consider, because everything looks important. The solution is, consider only those price levels or swing points where price has shown a clear reaction. Use ATR, such as a move of at least 3× ATR to filter out minor price fluctuations and focus on more meaningful market reactions.
How Do You Draw Support and Resistance Correctly?
There are five simple steps to draw support and resistance correctly. These steps are briefly discussed below.
- Step 1 (Start with a higher timeframe): Begin with a higher timeframe like weekly and daily chart because higher-timeframe levels provide a broader view of where price has previously reacted.
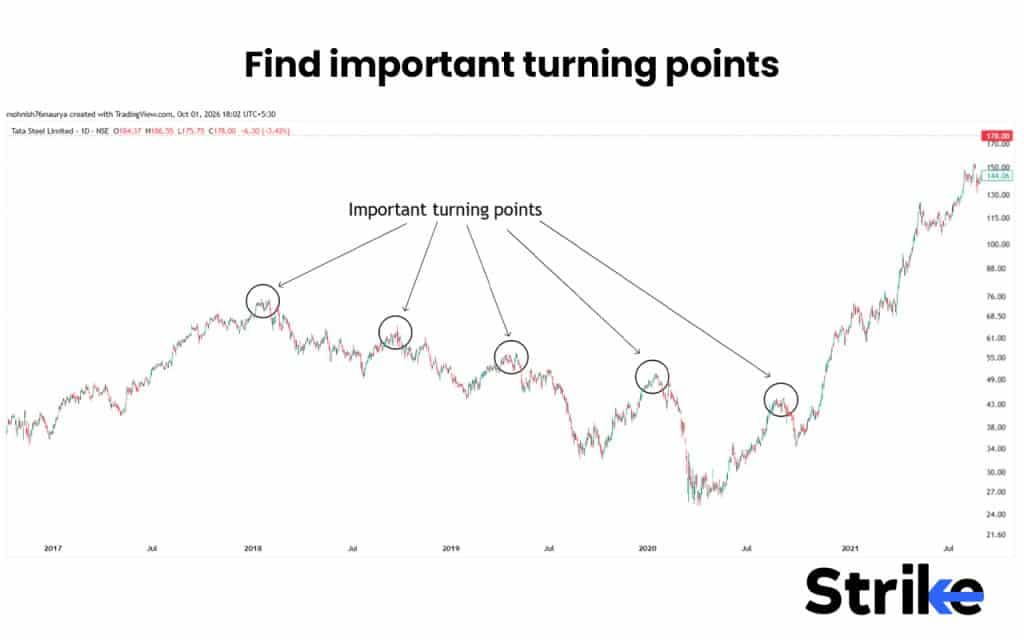
- Step 2 (Find important turning points): Look for important swing points from where price has changed direction, with minimum 3x ATR swing. A swing lows can indicate support, whereas a swing highs indicates resistance.
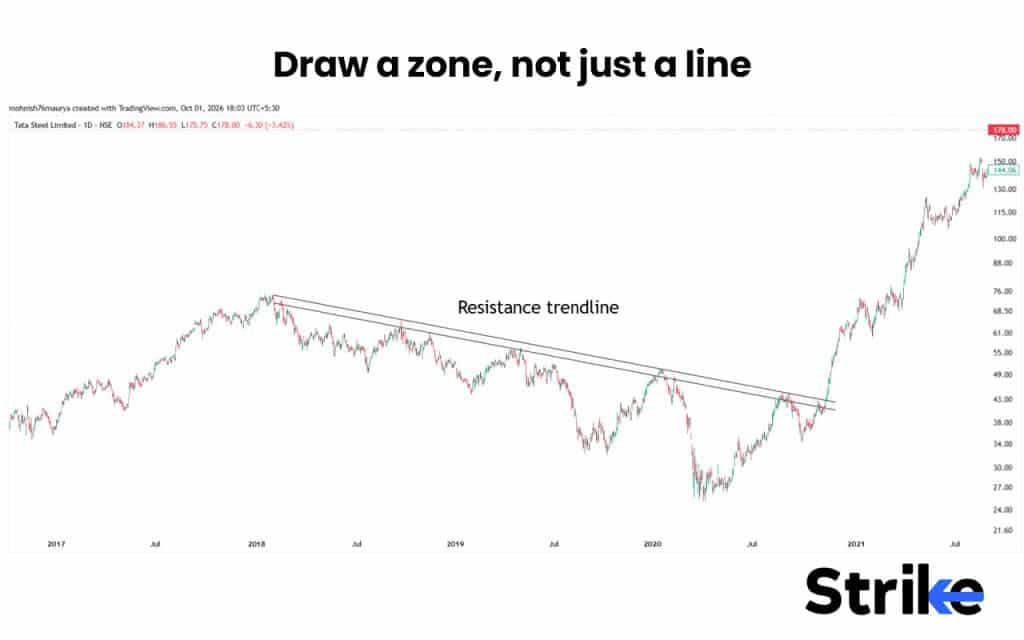
- Step 3 (Draw a zone, not just a line): Connect the swing lows with a rectangle to mark support zone, whereas connect swing highs with rectangle to mark resistance zone. Make sure to connect a minimum of two points with a clear reaction. A three touch point is even better.
- Step 4 (Keep the zone reasonably narrow): Make sure that your zone is wide enough to capture normal price movement, but not so wide that it covers the large part of the chart. You can use 0.5 × to 1× the stock’s daily ATR to gauge the width of the zone.
- Step 5 (Check the current trend): Support and resistance works best when applied with trend context. In an uptrend, previous resistance can become support after a breakout. Similarly, broken support can later act as resistance in a downtrend.
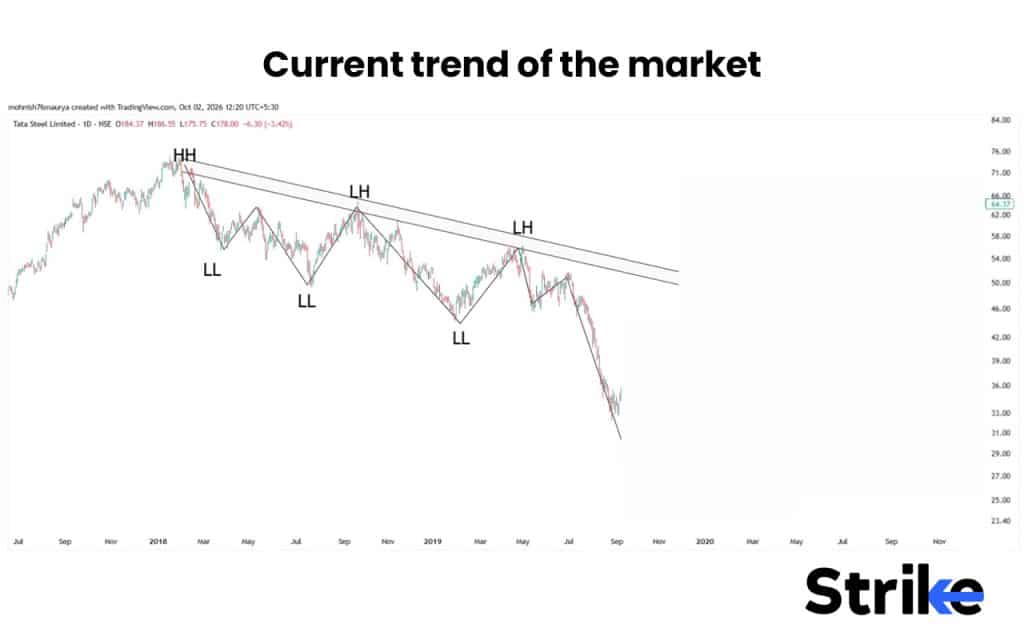
I have seen many beginners drawing support and resistance by forcefully drawing thick zones to connect most of the swing. Only connect strong level
What Makes a Support or Resistance Level Strong?
There are six main factors to consider to mark any support and resistance level as strong.
- Multiple Touchpoints: A minimum of three touch points makes support and resistance trendlines strong.
- Higher timeframe: Support and resistance zones on higher time frames like weekly and daily are stronger compared short-term charts.
- Strong price reaction: Zone strong rejections are more stronger. A sharp move away from the zone shows that buyers or sellers responded strongly there. A level that produced a 5% move matters more than one that produced 0.5%.
- Higher trading volume: A level where price showed strong rejection with high volume, usually 2x than 20 days average makes level more important.
- Confluence: When a support and resistance zone aligns with other technical factors such as a trendline, moving average, previous swing point, or round-number level, it becomes more reliable.
- Role reversal: When resistance is broken and later acts as support, or support is broken and later acts as resistance, the area can become an important reference point.
The more factors that align, the greater the significance of the zone and the more useful it can be when analysing potential breakouts, reversals and trade setups.
Does a Level Get Stronger or Weaker With More Touches?
With more touches, a level generally gets weaker. The second and third touch points are necessary to confirm the level. Every touch after that starts making the level weaker because every test uses up some of the orders waiting there. After repeated tests, that area can eventually become easier to break.
There are three major signs that warn you about weakening of level.
- The bounces get smaller each time.
- Touches come faster, with less time between tests.
- Price makes higher lows into resistance (an ascending triangle) or lower highs into support (a descending triangle). These patterns often end in a breakout.
I personally trade third and fourth touch points for most probable setups. Also, what i have observed is, a trendline break with maximum touchpoints shows the strong price movement.
Why Confluence Matters More Than Any Single Level
Confluence matters more than any single level because at the confluence point, more orders from different groups of traders wait there.
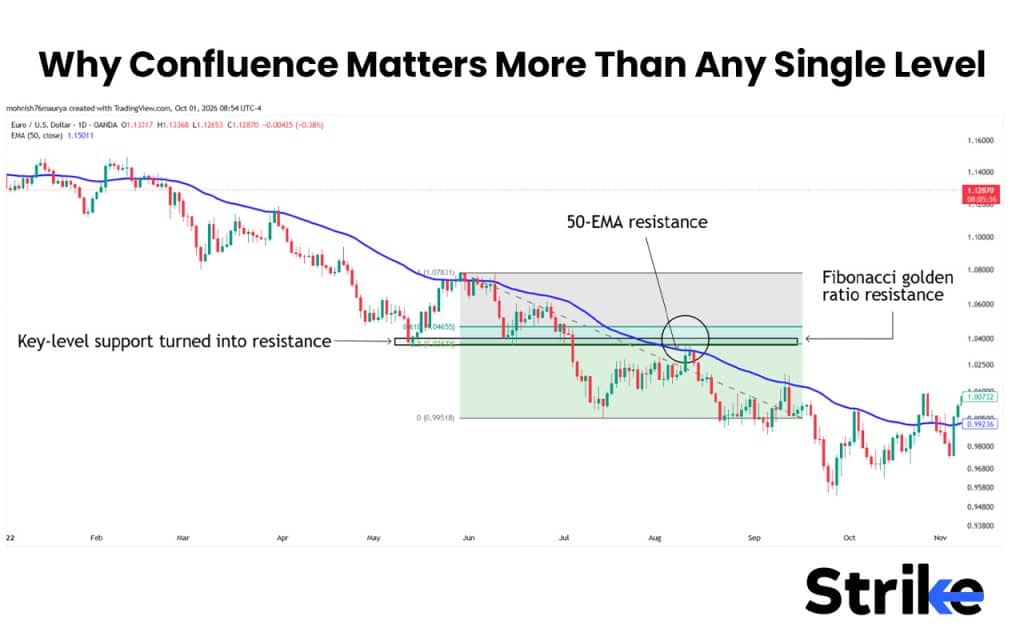
As you can see in the screen shot above of EUR/USD, three resistance points are coinciding at the same level 1.04000 USD, creating a confluence. These three resistance points are, price structure resistance, fibonacci golden zone (61.8%) resistance and 50 period EMA. Any reversal signal from such confluence points can give us a most reliable trade.
Can a Support Become Resistance & Vice Versa?
Yes, a support can become resistance and vice versa, and this phenomenon is called role reversal or polarity. This usually happens due to psychological behaviour after a break.
When price breaks any support and resistance, the following psychological behaviour changes the role of support to resistance and vice versa.
A trapped buyer who has bought at support is now at loss. When price returns at the breakdown level, most of the buyers sell to get out at break-even. That selling turns old support into resistance.
Traders who missed the breakout of resistance wait for price to pull back near the same level of breakout. Once price reaches the breakout level, their buy orders turn old resistance into support.
The first retest after role reversal works best, but by the second and third retest, the level weakens.
Which Tool Can Help You Find Support and Resistance?
Apart from indicators, there are three important tools to find support and resistance. The tools are volume profiling, fibonacci retracement, and option open interest.
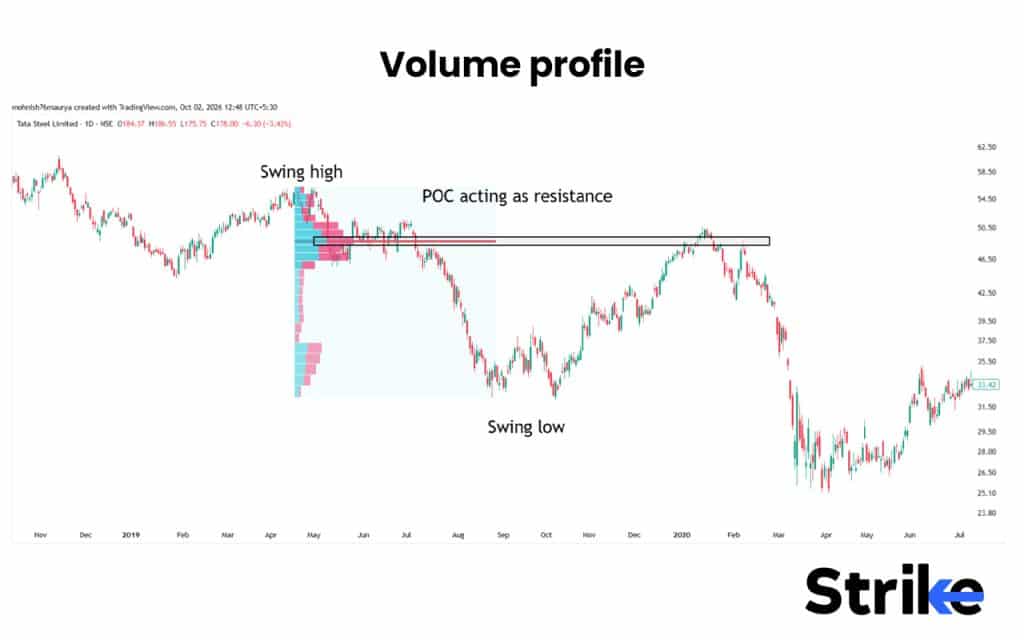
- Volume profile: It shows how much trading volume has occurred at different price levels rather than at different points in time. It helps traders identify price zones where market participants have shown relatively high or low activity. The price where most of the trading volume has occurred is called POC (point of control), which marks as a key level.
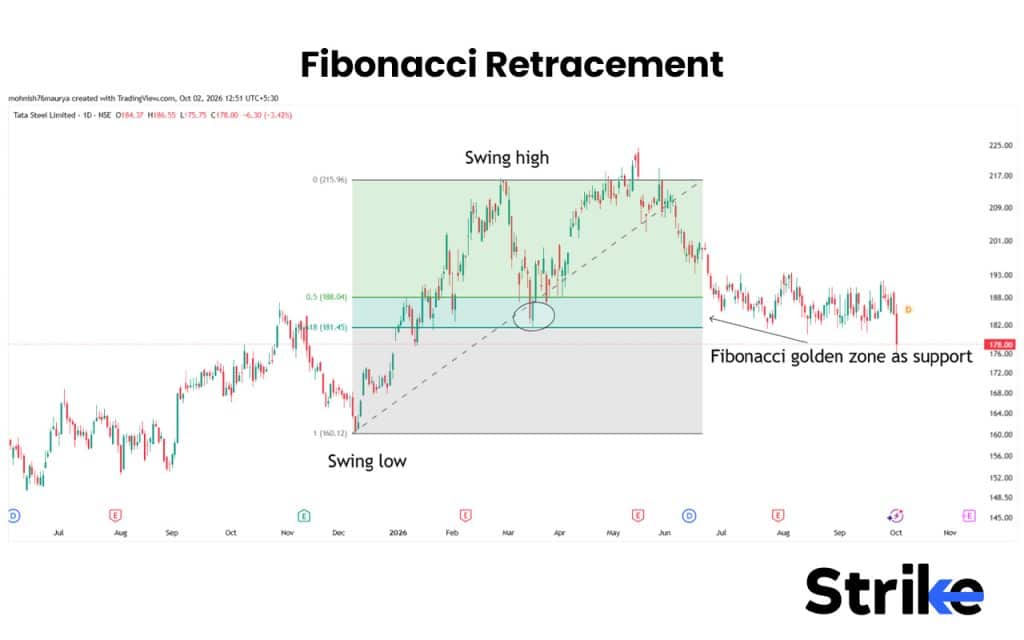
- Fibonacci Retracement: It suggests support and resistance level based on fibonacci ratios such as 23.6%, 38.2%, 50%, 61.8%, and 78.6%. In downtrend, these levels act as resistance, whereas in uptrend these levels act as support.
- Strike OI insights: Strike OI Insights marks support and resistance for stocks based on open interest. The strike with maximum OI will be marked as support and resistance.
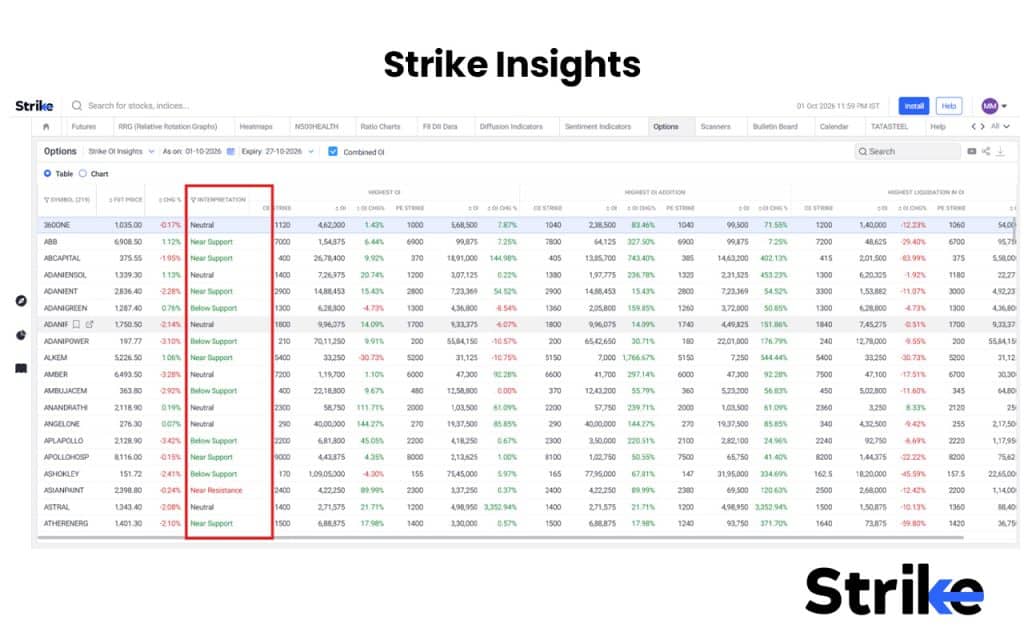
Each tool highlights support and resistance from a different perspective. Volume Profile shows where trading activity is concentrated, Fibonacci Retracement identifies potential pullback levels, and Strike OI Insights highlights levels based on open interest.
Is There Any Indicator to Find Support & Resistance?
There is no dedicated indicator to find support and resistance, since drawing them is a manual skill. However, several technical indicators can help traders identify potential support and resistance zones, especially when traditional horizontal levels are not obvious.
These indicators are pivot points, fibonacci retracement moving averages, VWAP, Bollinger Bands, and supertrend.
- Pivot Points: It calculates key price levels for today’s trading session based on previous day’s open, high, low and close.
- Moving Averages: Moving averages such as the 20 EMA, 50 EMA, and 200 SMA measure the average price of the stock over the selected period. These average prices often act as dynamic support and resistance.
- VWAP: Measures the fair value on intraday level based on average price weighted by volume. This fair value often acts as support if price approaches from above and resistance when price approaches from below.
- Bollinger Bands: Forms a band around a price which adjusts dynamically based on standard deviation. An upper band often acts as resistance and the lower band acts as support.
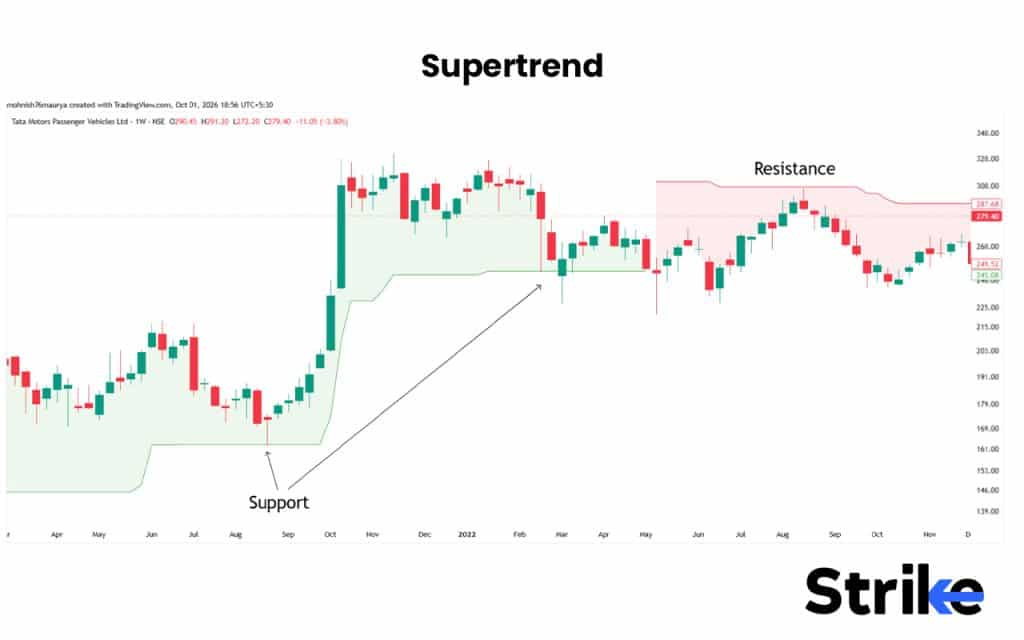
- Supertrend: Identifies trend, change in trend and also acts as support and resistance. Price often bounces off from supertrend in an uptrend and vice versa.
Above mentioned indicators are world best for support and resistance when the many traders use the same indicator settings. For instance period 200 EMA works best as trend identifier and support/resistance compared to custom 53 or 120 period EMA.
How Do You Trade Support and Resistance in the Indian Market?
There are five simple steps to trade support and resistance in the Indian market. These steps are briefly discussed below.
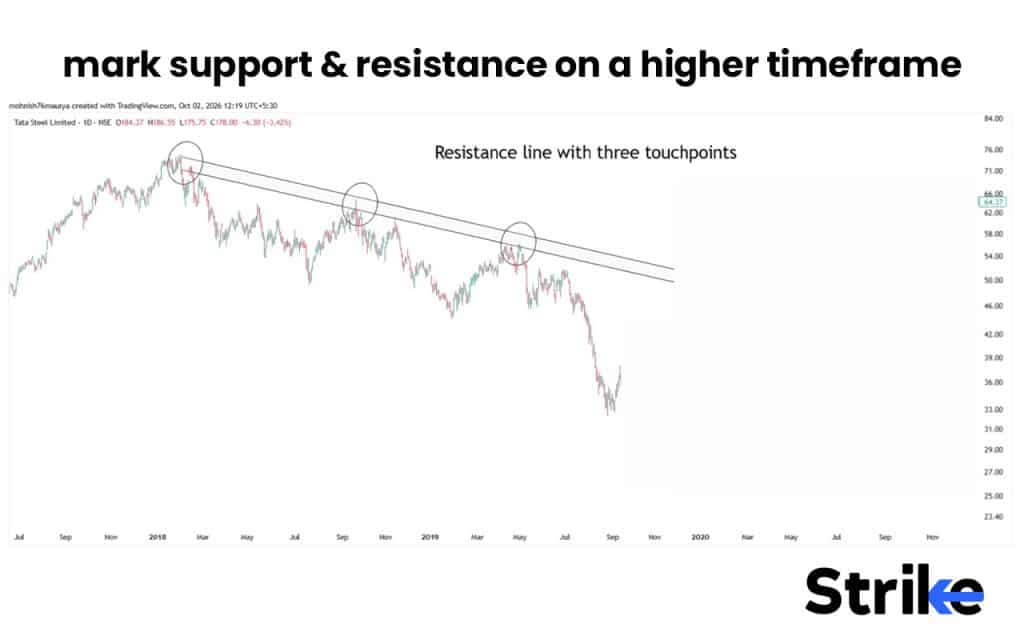
- Step 1: Start with marking support and resistance on a higher timeframe such as weekly or daily timeframe. To mark support, connect swing lows and to mark resistance connect swing highs with minimum 3 touch points.
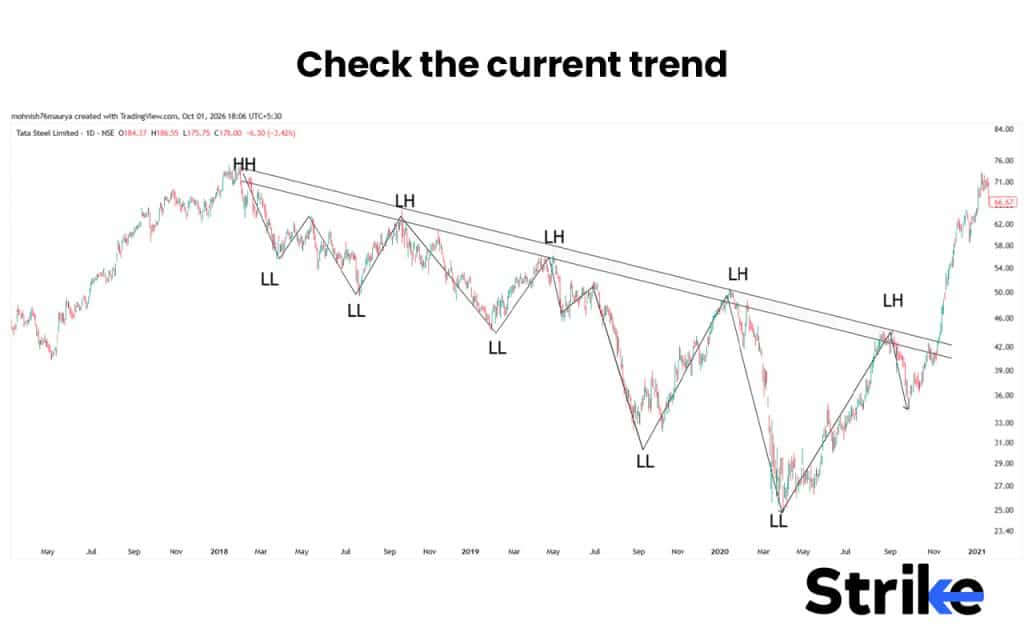
- Step 2: Check the current trend of the market, whether it is trending up, trending down or moving sideways. Trade support during uptrend and trade resistance during downtrend.
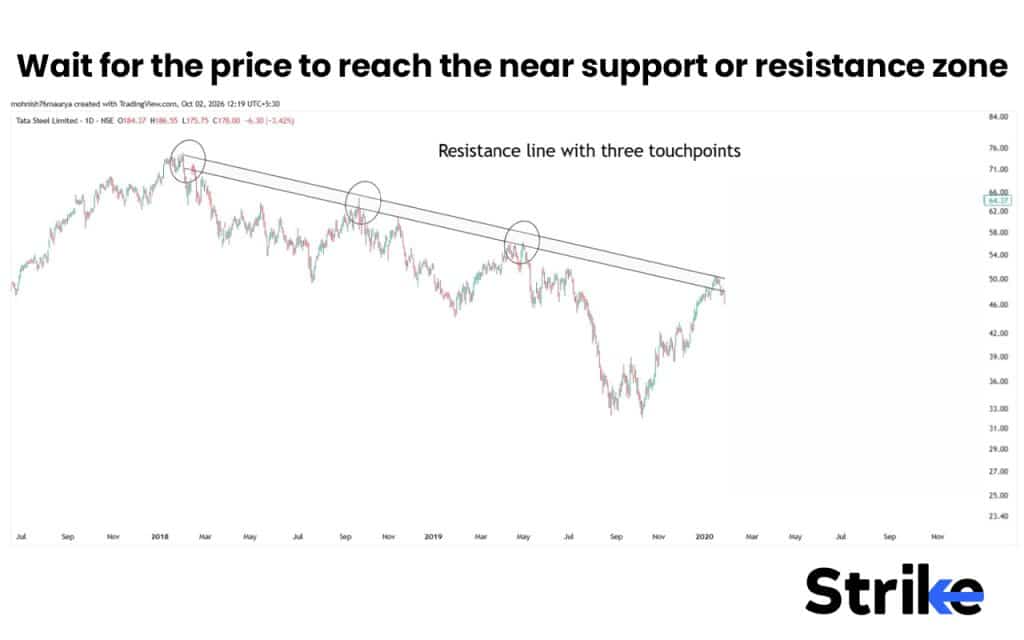
- Step 3: Wait for the price to reach the near support or resistance zone, because support and resistance zone can behave differently in each condition.
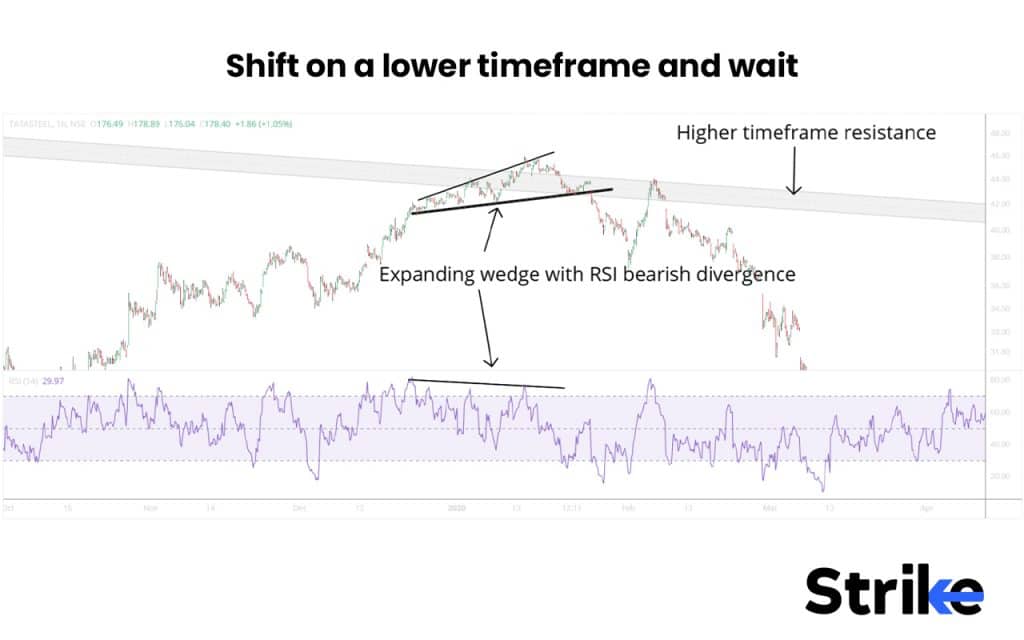
- Step 4: Shift on a lower timeframe and wait for the price to show a confirmed signal of reversal such as reversal pattern, high volume, or other indicators confirming the signal from support or resistance.
- Step 5: Once setup forms, define stop-loss and target based on the structure of the chart and enter the trade with proper position sizing. Avoid risking more than 1% of your total capital.
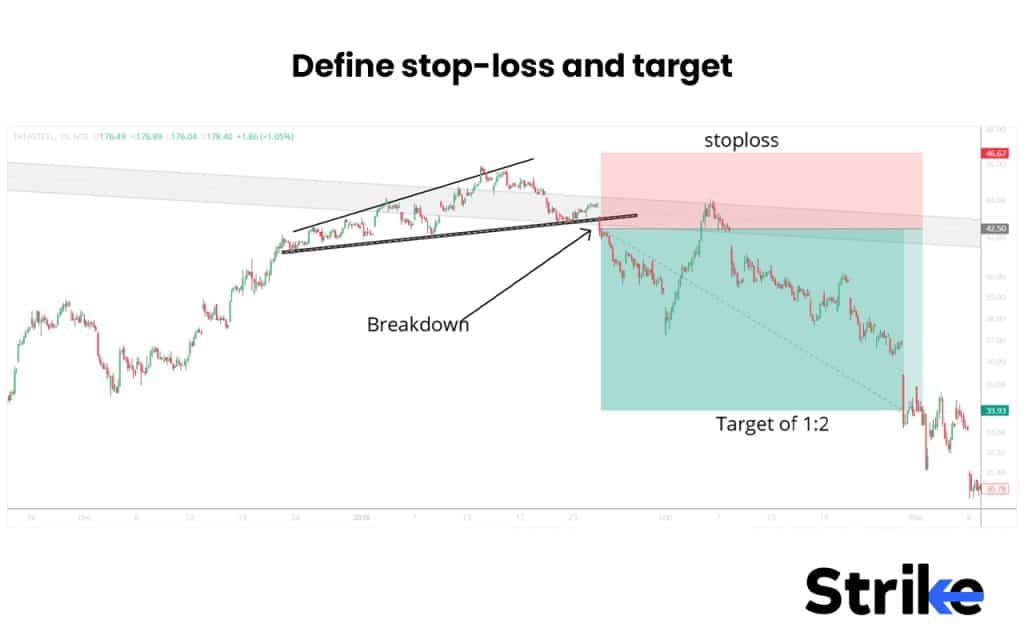
Similarly, you can trade a rising support trendline, or a flat support and resistance level. Wait for price to reach support or resistance and enter a reversal signal with 1:2 RR trade.
Where Should You Place Your Stop-Loss & Target?
You can place your stop loss beyond the key support and resistance level.
- For support, place your stoploss below the support zone.
- For resistance, place your stoploss above the resistance zone.
However, don’t place your stop-loss exactly on the support or resistance line, because the price can briefly move through the zone before reversing. Instead, leave some buffer space of 0.5× of ATR between your stop loss and the support or resistance levels.
In case of a target, the next significant zone can be considered.
- For a long trade, the next significant resistance level can be the first target and the next major higher-timeframe resistance level can be the second target.
- For a short trade, the next significant support level can be the first target and the next major higher-timeframe support level can be the second target.
However, you can also use the 1:2 risk reward ratio method to place your profit target.
What Is a False Breakout, and Why Do They Happen?
False breakout is a breakout that fails to sustain and immediately falls back inside the zone trapping the breakout traders. Traders also call it a fakeout, a bull trap (above resistance) or a bear trap (below support).
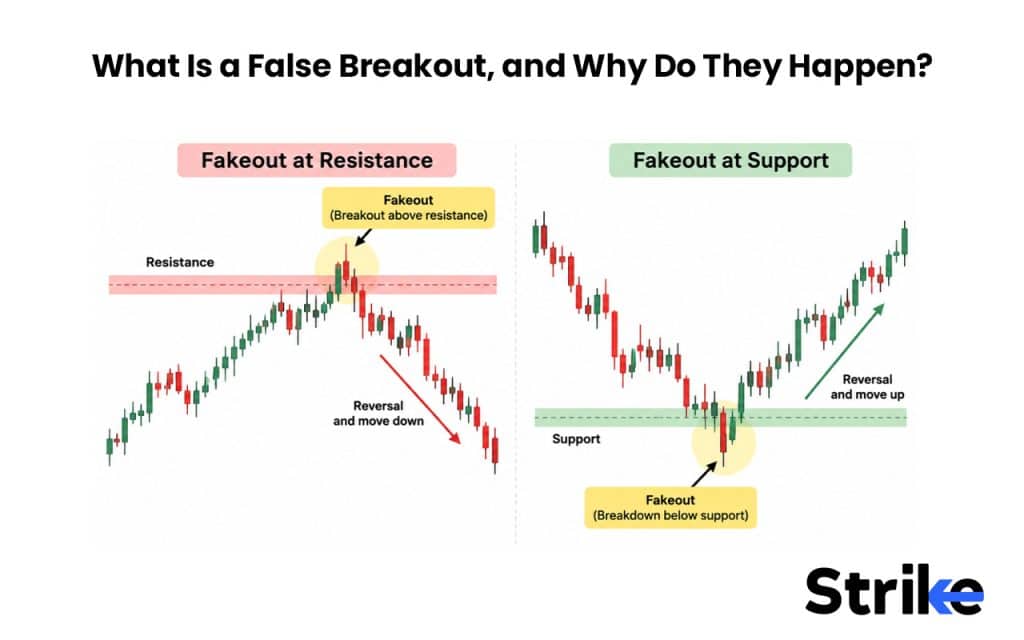
There are four main reasons behind the fakeouts. The reasons are briefly discussed below.
- Lack of buying or selling strength: When there is not enough follow-through after breakout, price fails to sustain breakout.
- Temporary price spikes: Sometimes a price gets pushed beyond the zone due to short-term momentum.
- Low liquidity: In less-liquid stocks, even small orders can cause sharp price movements, creating fakeouts.
- Market or company news: Sudden news can cause a temporary price reaction that quickly fades.
This is why traders often look for confirmation after a breakout, such as a strong candle close beyond the zone, sustained price movement, or supporting volume (2x of its 20 day average), rather than treating every move through support or resistance as a genuine breakout.
What Happens When Price Break through Support or Resistance?
When price breaks support and resistance a role reversal happens, which means support flips its role and starts acting as resistance and resistance flips its role and starts acting as support. It usually happens due to reassessment of levels after the breakout.
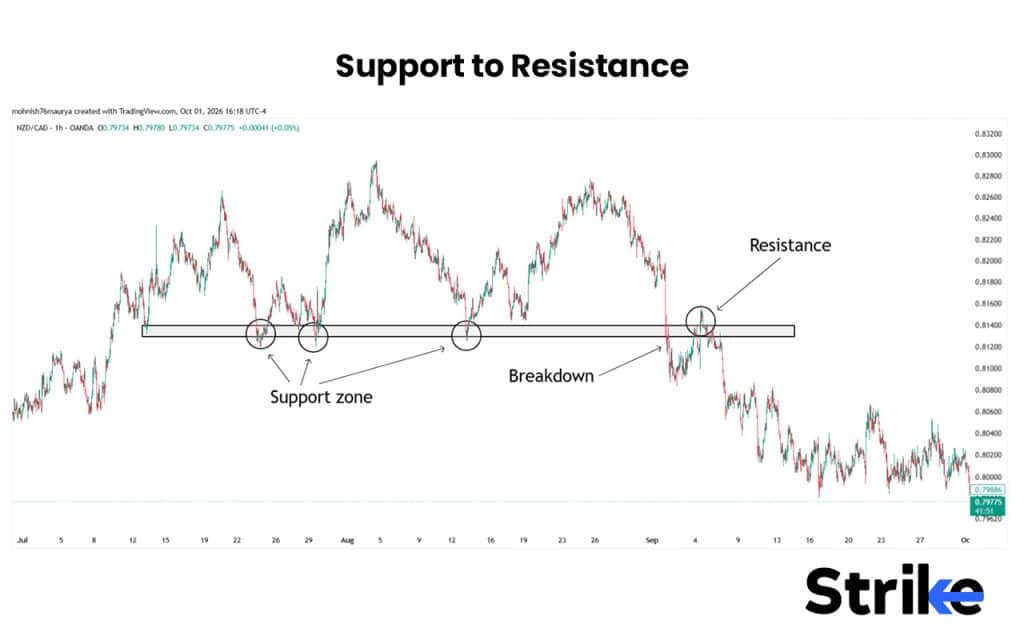
- Support to Resistance: When price breaks the support and comes back to retest, the trapped buyers start selling to exit their position, whereas fresh sellers also enter the market to trade breakdown. This converts the support into resistance.
- Resistance to Support: When price breaks the resistance and comes back to retest, the trapped sellers start buying to exit their position whereas fresh buyers entering the market to trade breakout. This converts the resistance into support.
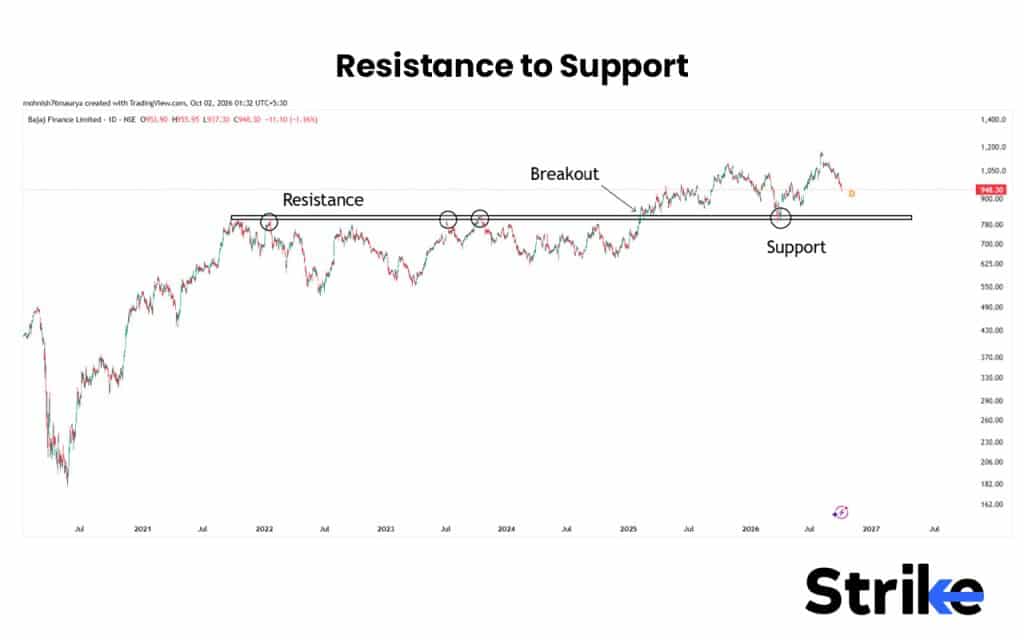
The new level becomes more meaningful when price retests it and holds, showing that the balance between buyers and sellers has shifted. A failed retest, however, can indicate a false breakout and return the price to its previous range.
Do Support and Resistance Levels Actually Work?
Yes, support and resistance level actually works but as a probability, not certainties. Support and resistance level should be only used to find the potential areas of reaction not as a direct buy and sell signal. Also, how well the support and resistance works depends on your skills and experience. .
Are Support and Resistance Self-fulfilling?
Partly yes, because the same support and resistance level is being watched by many traders and their orders help create the reaction they expect. Suppose you find ₹2,000 is support for stock XYZ. Just like you many other traders will also try to buy the stock at ₹2,000. When price finally reaches ₹2,000 support, a large buying order can push price higher giving you expected reaction.
However, not everyone executes orders based on chart level. In our case, what if an institution may want to buy a large quantity around ₹2,000. Someone who bought at ₹2,000 may sell when the price returns there. Options traders may have positions around ₹2,000.
So there can be real buying and selling pressure at that price even without everyone looking at the same support line.
The self-fulfilling effect has a limit. When a level becomes too obvious, stops cluster just beyond it, and larger players may push through to trigger them. So the most crowded levels are also the most likely to see false breakouts. The practical lesson: respect obvious levels, but give them room.
What Mistakes Do Traders Make With Support and Resistance?
There are four major mistakes a trader makes that are briefly discussed below.
- Treating support and resistance as exact lines: A slight move above and below the market support and resistance line can trigger your stop-loss. To overcome this, consider support and resistance as a zone.
- Drawing too many levels: Marking every highs and lows as support and resistance. Consider only those levels from where price has shown a significant reaction of at least 3-4%.
- Assuming the level will always hold: Taking immediate entry assuming support and resistance can not break. To avoid this, wait for reversal confirmation.
- Ignoring the trend and timeframe: A level should be considered in the context of the broader trend and the timeframe being traded. Consider trading support in an uptrend and resistance in a downtrend.
The biggest mistake is treating support and resistance as guaranteed reversal points rather than areas where price may react.Add a mistake specific to your own experience
What Timeframe Should I Use for Support and Resistance?
Higher time frames such as weekly and daily are best to find strong support and resistance levels, whereas lower time frames like 15 and 5-min are best to time the entry. Even if you want to trade on a lower timeframe like 1-minute and 3-minute, mark the support and resistance on a higher timeframe.
I also personally use a weekly and daily timeframe for support and resistance identification and a 1 hour timeframe to plan entry.
The best timeframe based on your trading style is briefly discussed below in the table.
| Trading style | Holding period | Find levels on | Time entries on |
|---|---|---|---|
| Scalping | Minutes | 15-minute, 1-hour | 1-minute, 3-minute |
| Intraday | Same day | 1-hour, daily | 5-minute, 15-minute |
| Swing trading | Days to weeks | Daily, weekly | 1-hour, 4-hour |
| Positional / investing | Weeks to months | Weekly, monthly | Daily |
Higher-timeframe levels always outrank lower ones. If your 15-minute chart shows support at ₹740 but the daily chart shows resistance at ₹745, the daily level wins, and a long trade there has very little room to run.
How Do You Use Support and Resistance With Other Indicators?
Support and resistance works better when combined with different indicators like RSI, volume, MACD, and moving averages.
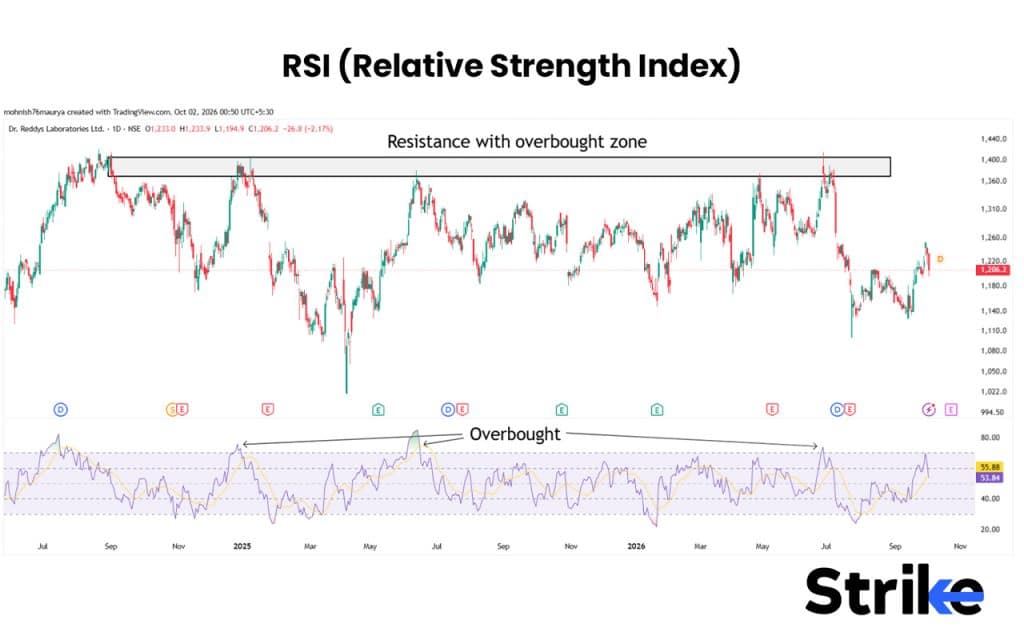
- RSI (Relative Strength Index): When price reaches its support and RSI signals oversold condition, it gives an additional confirmation that selling pressure is over. Similarly when price reaches its resistance along and RSI signals overbought condition, it gives an additional confirmation that buying pressure is over.
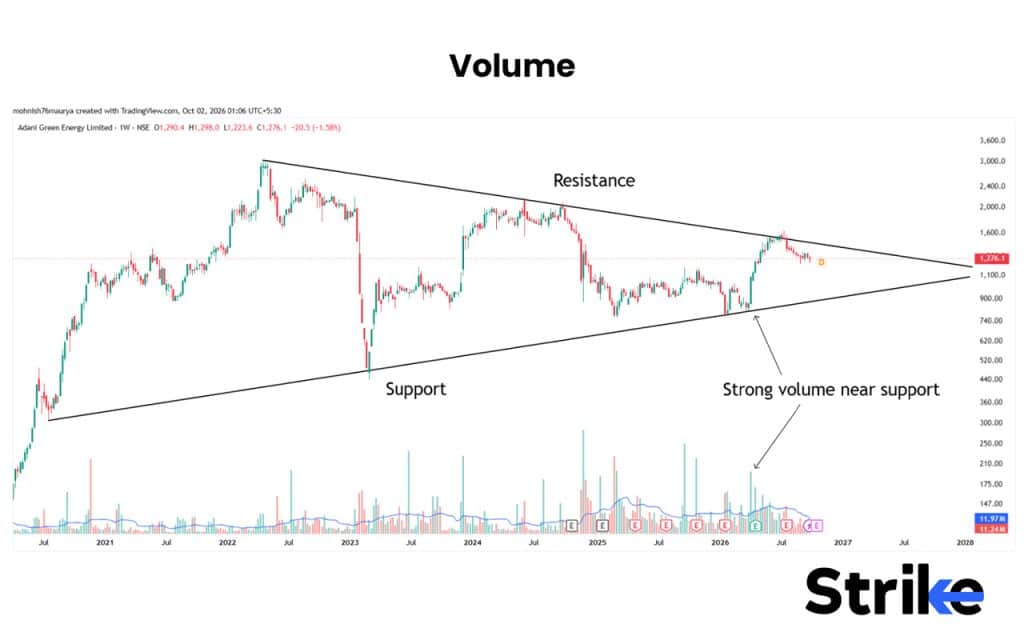
- Volume: A strong reaction near support or resistance supported by a strong volume activity (more than 2X) strengthening the convictions.
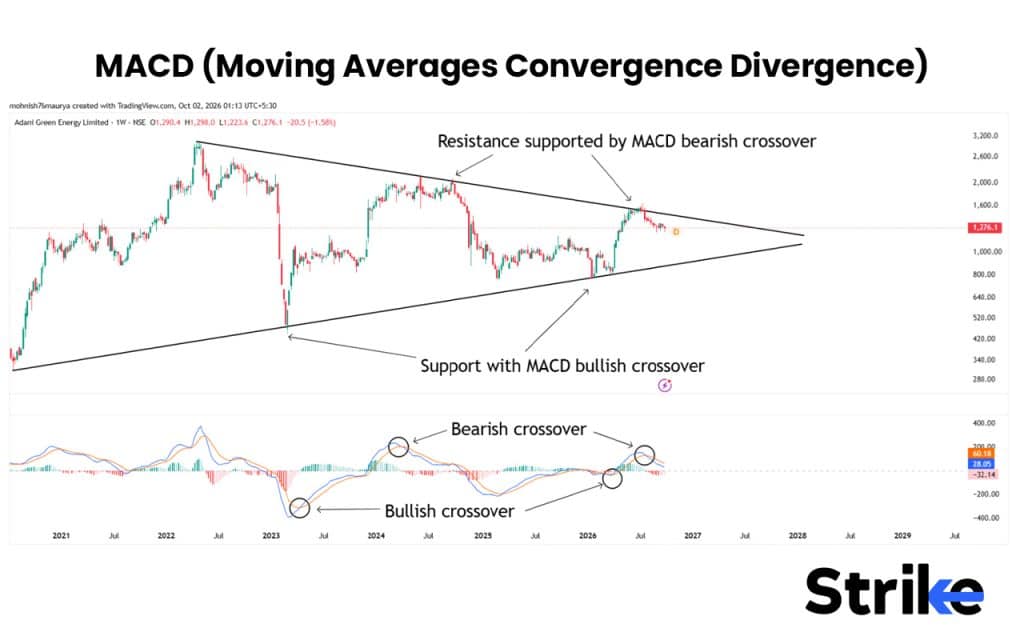
- MACD (Moving Averages Convergence Divergence): A MACD bullish crossover near support and a MACD bearish crossover near resistance provides additional confirmation.
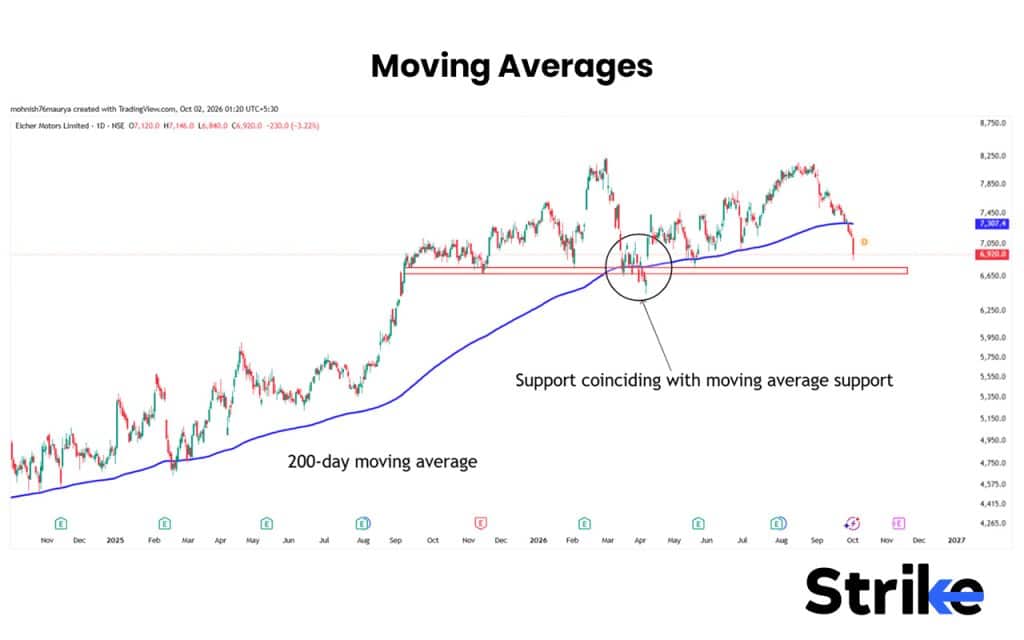
- Moving Averages: If a support or resistance overlaps with key moving averages like 50 period or 200 period, the reliability of support and resistance increases. However, the moving average should be rising for support and falling for resistance.
Avoid stacking indicators that measure the same thing. each other and give false confidence. One momentum tool, one volume check and a candle trigger are usually enough.
Can Trendline Work as a Support?
Yes, a trendline can work as support but its effectiveness depends on the slope of the trendline. A rising trendline sloping upward in an uptrend does a way better job as support compared to falling trendline.
To draw a valid support trendline, the step is technically the same; connect at least 2 swing lows swing lows. However, make sure that the angle of the trend line is not too steep, because lines steeper than about 45° on a standard chart break quickly.
The setup gets even more stronger when the rising support trendline meets the horizontal support zone.
What are Dynamic Support and Resistance?
Dynamic support and resistance are levels that move with price over time. Rather than staying fixed at one number, they keep changing along with price, following the trend.
The most commonly used dynamic support and resistance are moving averages, VWAP, trendlines / channels and bollinger bands / supertrend.
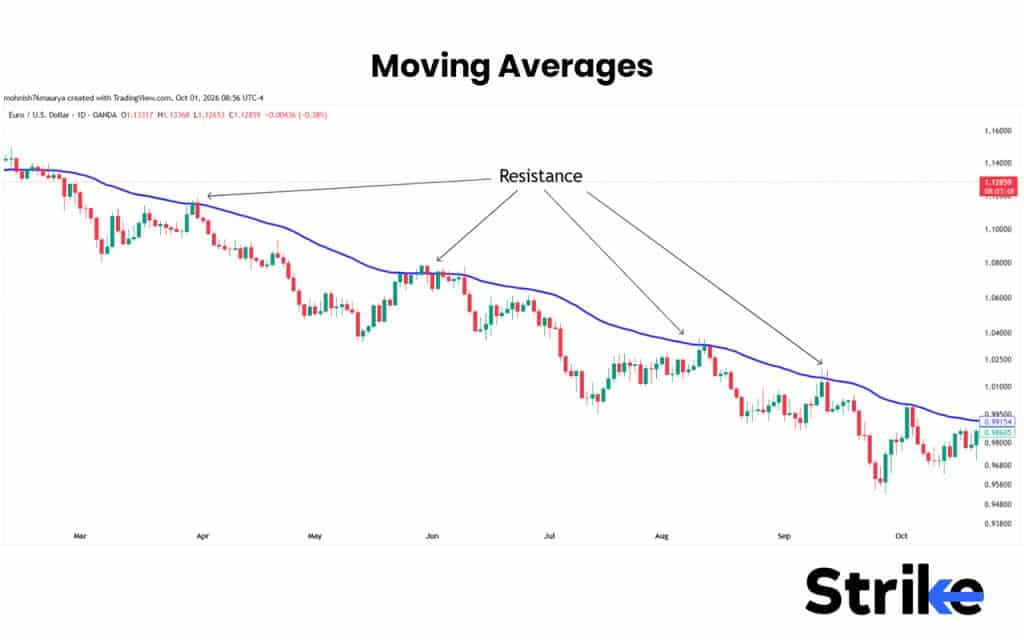
- Moving Averages: Moving averages such as the 20 EMA, 50 EMA, and 200 SMA measure the average price of the stock over the selected period. These average prices always sit as a dynamic support and resistance.
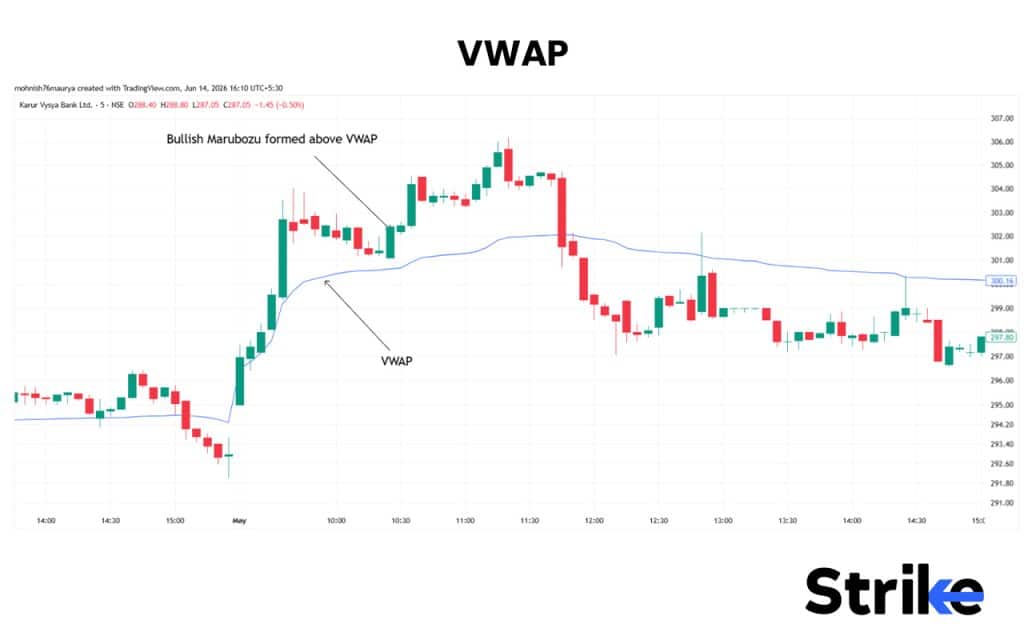
- VWAP: Measures the fair value on intraday level based on average price weighted by volume. This fair value often acts as support if price approaches from above and resistance when price approaches from below.
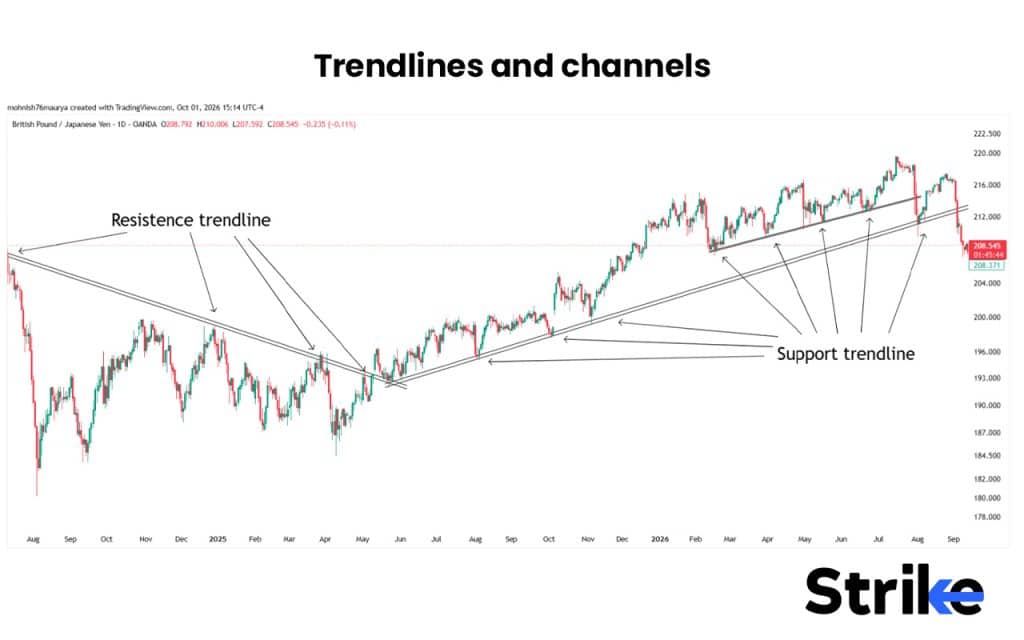
- Trendlines and channels: It moves along with trends and acts as support in an uptrend and resistance in a downtrend.
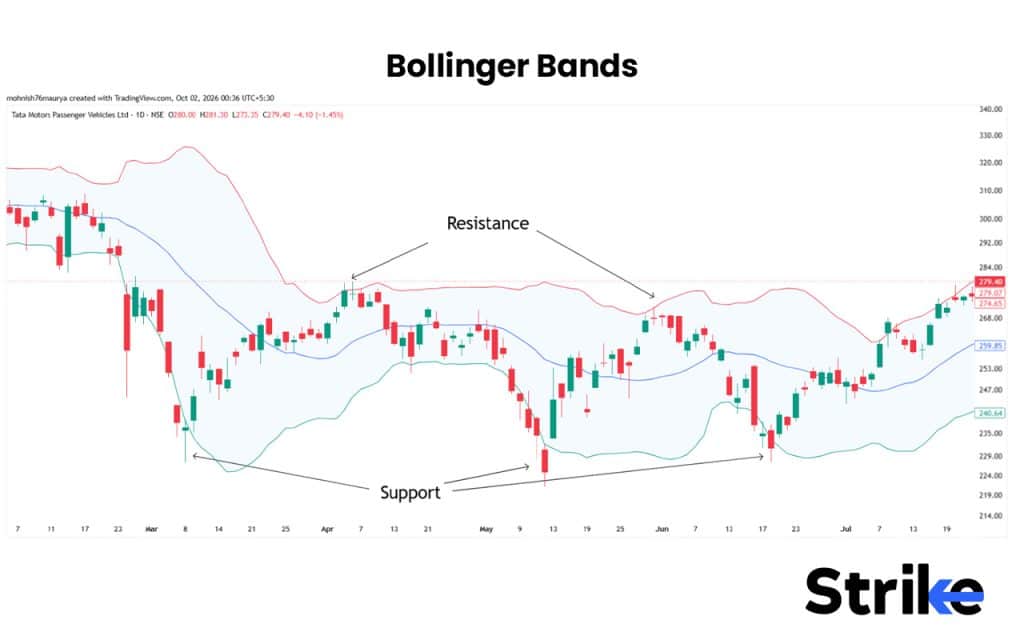
- Bollinger Bands: Forms a band around a price which adjusts dynamically based on standard deviation. An upper band often acts as resistance and the lower band acts as support of the Bollinger Bands.
- Supertrend: Identifies trend, change in trend and also acts as support and resistance. Price often bounces off from supertrend in an uptrend and vice versa.
Static support and resistance are good to trade range bound markets. Whereas dynamic ones perform in trending markets.
Support and Resistance vs Pivot Points vs Fibonacci
The difference between support and resistance, pivot points and fibonacci is briefly discussed below.
| Factor | Support and Resistance | Pivot Points | Fibonacci Retracement |
|---|---|---|---|
| Basis | Previous price reactions and market structure | Mathematical calculation using previous period’s price | Fibonacci ratios applied to a price swing |
| How levels are found | Previous highs, lows, consolidation zones, trendlines, etc. | Formula based on previous High, Low and Close | Drawn between a significant swing high and swing low |
| Nature of levels | Often zones rather than exact prices | Usually specific price levels | Percentage-based levels |
| Common levels | Previous support/resistance zones | Pivot, R1, R2, R3, S1, S2, S3 | 23.6%, 38.2%, 50%, 61.8%, 78.6% |
| Main use | Understanding market structure and price reactions | Intraday support, resistance and potential price targets | Identifying possible retracement areas during a trend |
| Depends on trader input? | Yes, especially when identifying zones | Relatively low | Yes, especially when selecting the swing points |
| Best suited for | Market structure and price-action analysis | Intraday trading and predefined levels | Trending markets and pullback analysis |
But which one should you use? None of them should be used in isolation. Everyone plays a key role in their own way. Support and resistance is pulley a price action based, while pivot and fibonacci are statistical tolls. If you find these overlapping, that’s even a better setup.
Download Complete Support and Resistance Guidebook PDF
Get every rule from this article in one printable guidebook. It is built for traders who want a checklist beside their charts.
 19 mins