


Double Top pattern, also known as M Pattern is one of the favourite chart patterns for reversal traders, and swing traders who seek low risk entries following an uptrend. The Double Top pattern is frequently used by technical analysts, price action traders and even institutions because it tells a psychological story of change in momentum from bullish to bearish.
The secret behind its popular status is that it is dependable when used in conjunction with volume confirmation and a neckline breakout. Traders do not guess bottoms but wait until they see signs of strength, so this type of pattern is an often-used tool to trade an early trend reversal with a high level of reward.
What is a Double Top Pattern?
A Double Top pattern is a bearish reversal chart pattern that signals a potential change of trend from uptrend to downtrend. Double Top pattern usually occurs after a stock reaches similar high prices two times with a moderate decline between the two peaks.
: Meaning, Identification, Trading Strategy & Examples 29")
Why is It Called an M Pattern as well as Double Top?
The double top pattern is also called the “M” pattern because its shape on the price chart visually represents the letter ‘M”. This happens because the pattern consists of two distinct peaks at roughly the same price level, separated by a trough or valley similar to the latter “M”.
: Meaning, Identification, Trading Strategy & Examples 30")
When Does Double Top Pattern Appears?
The Double Top Pattern Appears after the prolonged or sustained uptrend in price. The appearance of the Double Top pattern after prolonged uptrend suggests the shift in momentum from bullish to bearish. This pattern forms when price hits the same high two times with a moderate dip in between.
Is Double Top Pattern Bearish?
Yes, the Double Top pattern is a bearish chart pattern. It signals the losing momentum of the uptrend and possible reversal to downtrend. This pattern visually represents the failure of buyers to push prices above the resistance of the two peaks, leading to growing selling pressure. Traders use this signal to identify selling or shorting opportunities.
What Does Double Top Pattern Indicate in Technical Analysis?
Double Top pattern in technical analysis indicates a potential trend reversal from uptrend to downtrend. It indicates hesitation of buyers at higher levels and failure to create new highs, which clearly shows trend exhaustion and an emerging dominance of sellers.
Once the neckline breaks, it points toward a likely downward move driven by declining demand and increasing supply. Double Top communicates that bullish momentum has faded, distribution is complete, and a potential trend reversal to the downside is now underway.
What are the Components of the Double Top Pattern?
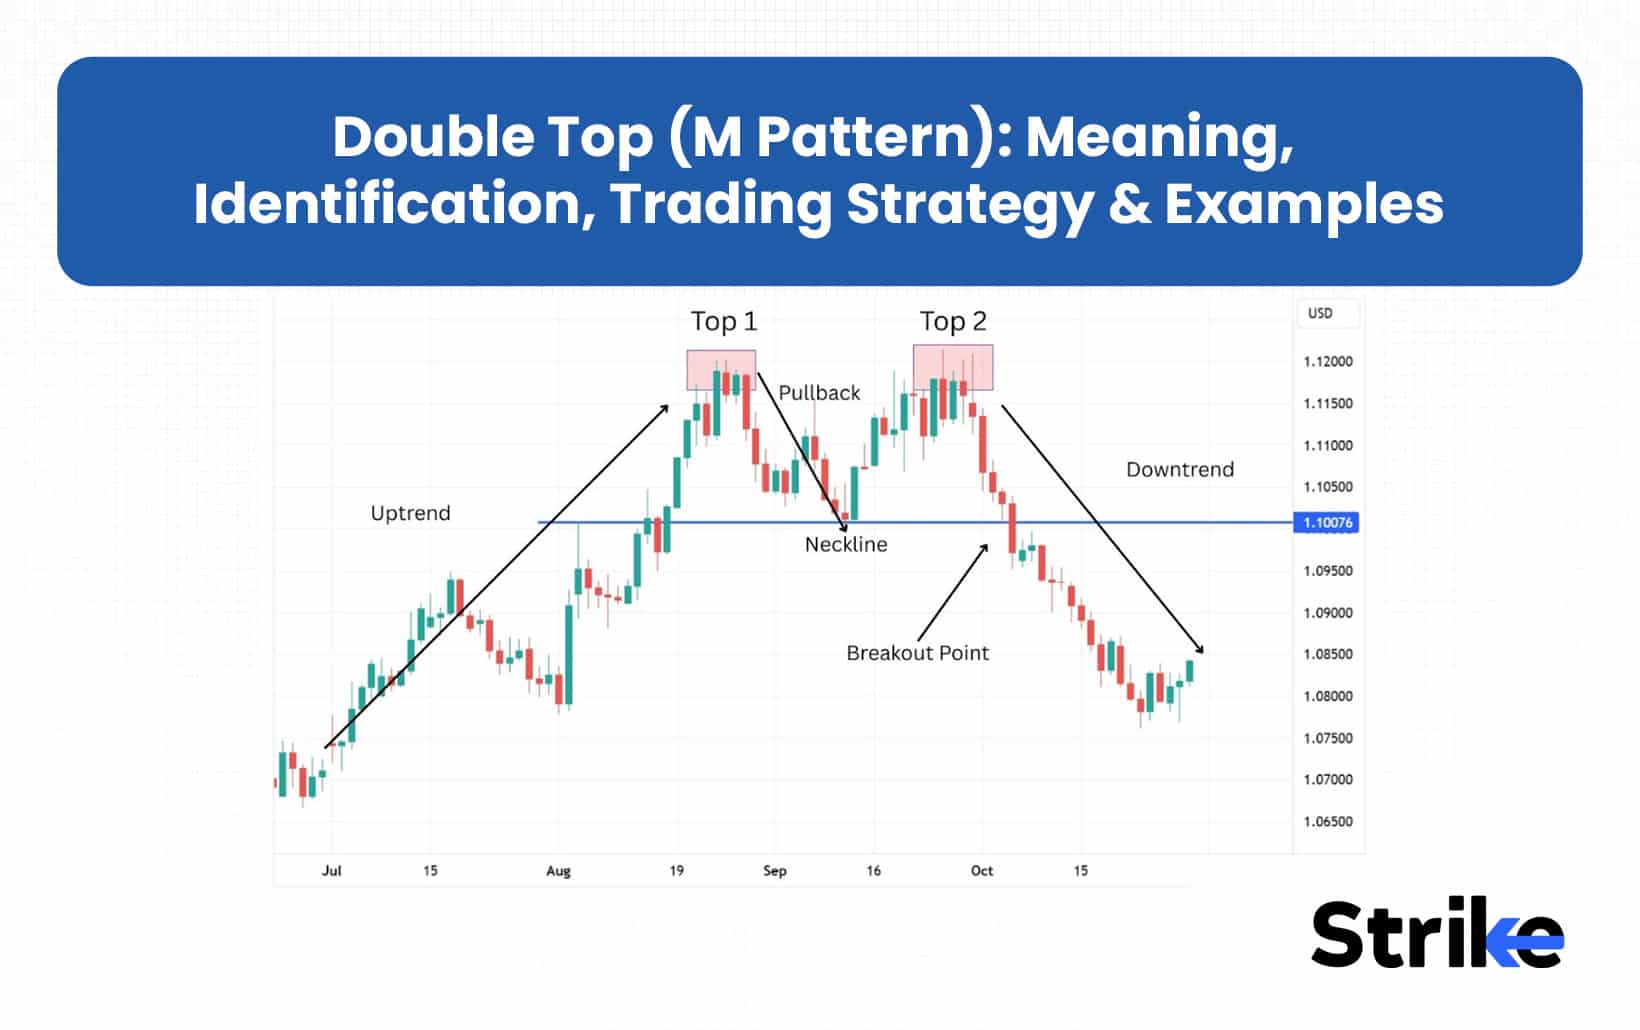
There are five major components of the Double Top pattern. The components are first top, pullback, second top, neckline and breakdown point.
: Meaning, Identification, Trading Strategy & Examples 31")
- First Top: The first peak formed after buyers push the price higher in an uptrend. After hitting a high, momentum slows down and price faces resistance. This is marked as a resistance zone.
- Pullback: After the first top price reverses or corrects due to moderate selling pressure from a resistance zone.
- Second Top: The price rallies again to form a new high, but fails to break the resistance zone or high of the first peak. This signals weakening buying momentum and resistance.
- Neckline (Support): This is the price level of the lowest point of pullback between the two tops. This neckline acts as a key support level that traders watch closely.
- Breakout Below Neckline: Break below neckline confirms the trend reversal to bearish and potential selling opportunity.
The pattern resembles the shape of an “M” formed by these components on the chart, reflecting buyer attempts to push prices higher that ultimately fail, resulting in a likely reversal to a downtrend.
What’s the Psychology behind Double Top Pattern?
The psychology behind the Double top pattern illustrates a gradual shift in momentum from bullish to bearish.
- First Top ( Buyers in Control ): A strong uptrend market driven by optimistic buyers pushing price higher. As price reaches a significant resistance level, some traders book profits creating the first peak.
- Pullback (Profit Booking): As buyers start booking profits, new sellers also step in at higher prices to short the market. This creates a small correction, but buyers still expect the uptrend to continue.
- Second Top ( Failed Buyer Attempt ): Buyers try to push price up again. But this time the move is weaker with less volume and less momentum. This failed attempt shows losing buyers control and strong resistance.
- Break of Neckline ( Sellers Take Control ): Once the neckline support breaks, it hits buyers stop loss and builds selling pressure fueled by short selling, confirming downtrend.
In essence, this pattern marks a psychological transition from confidence and buying enthusiasm to doubt, hesitation, and ultimately selling pressure, making it a reliable bearish reversal indicator.
Do Both Tops have to be Exactly Equal?
No, both the tops in a Double Top pattern do not necessarily have to be of exactly equal size but should be anywhere very close to each other to be counted as a valid pattern. The tops should form within the range of 3% to indicate high and definite resistance. Minor differences like the second top being slightly higher or lower are acceptable and actually have psychological significance.
: Meaning, Identification, Trading Strategy & Examples 32")
- If the second top is a little higher, it might be a failed breakout and buyers were not able to hold momentum above the resistance.
- If the second top is lower, it indicates even more weak buying power on the retest, which can also be an early indication of reversal strength.
What matters most is overall “M” pattern and break below the neckline to confirm the pattern.
What is the Neckline in a Double Top?
The neckline in a Double Top pattern is the support level formed by the swing low (trough) between the two tops. It represents the lowest price point reached after the first peak and the price tries to recover by forming the second peak. This level is important as it becomes the confirmation point of the pattern.
: Meaning, Identification, Trading Strategy & Examples 33")
But, how to find and draw the neckline?
You can find and draw the neckline by following three simple steps. The steps are double top identification, identifying lowest point and drawing the neckline.
- Identify the two peaks of the Double Top pattern at roughly the same high price level.
- Locate the lowest price point between these two peaks (the swing low or trough).
- Draw a horizontal or slightly angled line connecting these low points; this line is the neckline or support level.
The importance of the neckline lies in its role of support, a decisive close below the neckline signals sellers control, confirming the trend reversal.
How to Identify a Double Top Pattern on a Chart?
There are six major steps to identify the Double Top pattern on the chart. The steps are confirmation of prior trend, identifying first top, pullback, second top, neckline and breakdown.
- Confirm Prior Uptrend: Look for the initial strong bullish momentum because this pattern forms after the strong bullish movement.
- Identify First Top: Spot the first peak where price faces resistance after uptrend and starts to pull back. This top reflects buyers reaching strong resistance.
- Identify Pullback/Support: Look for a price to decline after taking resistance to create swing low. This will create the support level which will act as a neck line.
- Identify Second Top Near First Top: Look for the second peak which should be near the level of the first peak. This reflects the failed attempt of buyers to surpass the resistance due to weak buying pressure.
- Draw Neckline: Connect the lowest price points of the trough(s) between the two tops with a horizontal or slightly sloped line. This line serves as the critical support level.
- Await Breakdown: This pattern confirms when price breaks decisively below the neckline with increased volume, signalling a shift in momentum from bullish to bearish.
This sequence visually creates an “M” shape on the chart. Traders use the neckline break as a signal to enter short positions or exit longs in anticipation of downward price movement
How do You Confirm a Double Top?
To confirm a Double Top pattern, traders typically look for major key signals. The signals include break and close below the neckline, volume and supporting signals from indicators.
: Meaning, Identification, Trading Strategy & Examples 34")
- Break and Close Below Neckline: The double top pattern is confirmed when the price breaks and closes below the neckline. This confirms that bears have taken control and uptrend reversal is valid.
- Volume Spike During Breakdown: An increase in volume during the breakdown below the neckline confirms the selling pressure and enhances the reliability of the pattern.
- Supporting Signals Like RSI Divergence: You can get additional confirmation from technical indicators like RSI showing bearish divergence or overbought conditions, and MACD crossover etc.
Together, these rules help avoid false signals and improve confidence that the pattern signals a genuine trend reversal. Waiting for a decisive neckline break with volume and bearish confirmation is essential for effective trading decisions involving the Double Top pattern.
How to Avoid False Double Tops?
To avoid false Double Top patterns, consider these common false signals and how to mitigate them. The signals are price breaking above first top, patterns forming in consolidation and premature entries.
- Price Breaks Above First Top: Avoid trading Double top pattern if the price breaks above the level of the first top, it invalidates the double top pattern. This indicates the strong buying momentum rather than reversal.
- Pattern Forms in Consolidation or Sideways Market: Double Top are reliable usually after clear strong uptrend. If the price is in consolidation range without any strong uptrend, it will give a false signal.
- Premature Entries Before Neckline Break: The Double Top pattern gets confirmed only after price breaks and closes below the neckline. Avoid premature entries before neckline breaks.
Additional safeguards include checking for decreasing volume on tops formation and a volume spike on breakdown, as well as supporting indicators like RSI divergence. Waiting for these confirmations enhances the reliability of the Double Top as a bearish reversal signal and helps avoid costly mistakes.
Does Volume Matter in a Double Top?
Yes, volume is very important in a double top pattern as it increases the reliability of the pattern. During the formation of the second top, volume usually dries out which indicates weakening of buyers. During the breakdown point of the neckline, volume increases confirming the formation of a double top pattern.
That’s how volume plays a crucial part in the Double Top pattern, because without volume this breakout may be false or the pattern can be less reliable.
How to Trade the Double Top Pattern
There are four major steps to trade the Double Top pattern. The steps are pattern identification, entry, stoploss, and target.
- Pattern Identification: Identify a prevailing uptrend before the pattern forms and spot two peaks at roughly the same level creating resistance. Confirm if volume is higher on the first peak and lower on the second. For instance, Asian Paints stock rose from 1127 level to 1261 level within a span of 19 days. Stock tried to break the level of 1261 to create a new high, but it failed to do so and fell by creating a double top pattern.
: Meaning, Identification, Trading Strategy & Examples 35")
- Entry: Wait for price to close below the neckline with a good volume confirming the pattern. Enter the short position when the breakdown is confirmed. Asian brock below the neck line level of 1227 with good volume.
: Meaning, Identification, Trading Strategy & Examples 36")
- Stoploss: Place the stoploss above the high of the second top to avoid fake reversals. You can also place stoploss at breakdown candles high in order to have tight stoploss. For Asian Paints, the stoploss will be above 1261 level.
- Profit Target: Measure the height of the neckline to the peaks and project this distance downward from the neckline break point. Use this projected level as your initial profit target and trail stop loss to lock in profits if price continues downward.
It is important to manage risk by using proper position sizing, stop loss and following proper risk management. Avoid trading weak double tops and overtrading.
Based on entry criteria, we can have three strategies to trade the Double Top pattern. The strategies are neckline break entry strategy, early reversal entry strategy and breakdown and retest entry strategy.
- Neckline Break Entry: Enter immediately once the price breaks and closes below the neckline. Most commonly used setup across intraday and swing trading, because it gives clear confirmation.
- Early Reversal Entry Strategy: This involves entering trade during the formation of the second top without waiting for price to close below the neckline. This is little aggressive setup and requires tighter stoploss
- Break and Retest Entry: This involves entering a trade once price breaks the neckline and retesting it. This setup is for conservative traders and high reliability seekers.
Depending on your risk appetite and style of trading, you can follow one of the entry setups to trade double bottom chart patterns.
Double Top Trading Strategy for Intraday
Double Top trading strategy for intraday is used to capture quick bearish reversals on lower timeframes.
| Element | Details |
| Timeframe | 5-minute to 15-minute |
| Entry | 5–15 min close below neckline with volume |
| Stop Loss | Above second top or breakout candle high |
| Target & RR | Target 1: Neckline projection → RR 1:1Target 2: Full measured move → RR 1:2 to 1:3 |
Due to higher volatility, partial profit booking at 1:1 RR is recommended.
Double Top Trading Strategy for Swing Trading
Double Top trading strategy for swing trading focuses on medium-term trend reversals with higher reliability.
| Element | Details |
| Timeframe | 4-Hour to Daily |
| Entry | 4H or Daily close below neckline |
| Stop Loss | Above second top or HTF breakout candle high |
| Target & RR | Target 1: Neckline projection → RR 1:1.5Target 2: Measured move → RR 1:2 to 1:3 |
Swing trades perform best when risk per trade is fixed and targets are pre-defined.
Double Top Trading Strategy for Forex Trading
Double Top trading strategy for Forex involves identifying and trading double top patterns on a high volume and high liquidity currency pairs such as EUR/USD, GBP/USD, USD/CAD, AUD/USD and USD/JPY.
| Element | Details |
| Timeframe | 1H to Daily |
| Entry | Confirmed neckline break |
| Stop Loss | Above second top or breakout candle high |
| Target & RR | Target 1: Near support → RR 1:1.5Target 2: Full projection → RR 1:2 to 1:4 |
Forex setups offer higher RR when traded during active market sessions.
How Reliable is the Double Top Pattern?
The Double Top pattern is a moderately reliable bearish reversal chart pattern in technical analysis. According to the Samurai Trading Academy, when the double top was tested over 10 years and 200,000 patterns, the double top “success rate” was about 75.01%.
As per Pocketoption study, the success rate varies by timeframe. Longer time frames (weekly, monthly) tend to offer more reliable signals than shorter-term intraday or daily charts where noise is higher.
: Meaning, Identification, Trading Strategy & Examples 37")
The Double Top pattern has a statistically backed reliability range of around 65-75% when used with proper confirmation, volume analysis, and supportive indicators, making it a valuable tool for identifying potential trend reversals in trading.
Is Double Top Strategy Profitable?
Yes, Double Top strategy is profitable trading strategy, but only if executed with proper risk management, confirmation, and in conjunction with other analysis tools. Dobble Top is a structural way to catch trend reversal trades but there are few things to keep in mind before trading the Double Top pattern.
- Wait for the neckline breakdown.
- Combine it with volume.
- Trade it on higher timeframes.
- Use proper stop-loss
- Target the pattern height.
Although this pattern doesn’t appear daily, when it appears it gives high quality reversal trade, specially on a higher timeframe.
What Indicators work Best with Double Top Patterns?
The indicators that work best with Double Top Patterns include RSI, MACD, Stochastic Oscillator, Volume and EMA.
- RSI (Relative Strength Index): RSI helps to increase the reliability of the Double Top pattern by forming RSI bearish divergence. RSI bearish divergence is formed when price makes two equal tops but the RSI makes lower high, signalling weakening strength. Overbought RSI levels near the second top also strengthen the bearish signal.
: Meaning, Identification, Trading Strategy & Examples 38")
- MACD (Moving Average Convergence Divergence): The bearish crossover in MACD near or after the second top indicates sellers gaining momentum, helping confirm the trend shift from bullish to bearish.
: Meaning, Identification, Trading Strategy & Examples 39")
- Stochastic Oscillator: Overbought readings or a stochastic bearish crossover near the second top strengthen the case for a reversal.
: Meaning, Identification, Trading Strategy & Examples 40")
- Volume Indicators: Volume reduces during the formation of the second top, signaling losing buyers strength. During the breakdown of the neckline support, volume indicators usually increases, indicating strong selling pressure.
: Meaning, Identification, Trading Strategy & Examples 41")
- Moving Averages: As moving averages act as a dynamic support and resistance, the Double Top pattern reliability increases when the price breaks below the key EMA such as 20 or 50 after breaking the neckline.
: Meaning, Identification, Trading Strategy & Examples 42")
Using these indicators together with price action improves accuracy, helping traders avoid false signals and better time entry and exit points in Double Top trades.
What is the Best Timeframe for Double Tops?
The best time frame to trade Double Tops is a higher timeframe such as 4hrs, daily, and weekly. Higher timeframes are more reliable because it provides a clear view of significant price action and trend context, while filtering out the market noise common in shorter intervals like intraday charts.
The reliability of the pattern with respect to timeframe is given below in the table.
| Timeframe | Reliability Level | Notes |
| Weekly | Extremely High | Very strong reversal signals; patterns form slowly but are highly dependable. |
| Daily | Very High | Clean structure, strong trend reversals, minimal noise. |
| 4-Hour | High | Good balance between accuracy and trade frequency. |
| 1-Hour | Moderate | Works if confirmed with volume and momentum indicators. |
| 15-Minute | Low | Noisy; higher chance of false patterns and fake breakouts. |
| 5-Minute / 1-Minute | Very Low | Highly unreliable due to volatility and constant noise. |
Trading Double Tops on higher time frames improves pattern reliability and reduces false signals, making daily and weekly charts especially favored among traders to spot strong bearish reversals.
Is Double Top a Leading or Lagging Signal?
A Double Top is primarily a lagging signal, not a leading one because the trend will only be confirmed when the neckline is broken. Until the breakout the two peaks might be just the normal resistance in an existing uptrend. The confirmation comes after price has already shown weakness and broken below neckline, making it reactive rather than predictive.
But there is one leading feature which is the second top. Second top formation may serve as an early warning sign of the declining momentum of buyers and possible formation of second top when Volume declines and RSI/MACD shows bearish divergence.
Benefits vs Limitations of the Double Top Pattern
The benefits and limitations of the double top pattern are mentioned below in the table.
| Benefits | Limitations |
| Easy to identify visually on charts | Can form falsely during strong uptrends |
| Provides early warning of trend reversal | Requires confirmation (neckline break) before acting |
| Works well with volume and momentum indicators | Second top may not always be equal, causing confusion |
| Offers clear entry (neckline break) and stop-loss levels | False breakouts are common without volume support |
| Effective across multiple timeframes (especially daily & weekly) | Pattern can take long to form, causing delays |
| Helps spot reduced buying strength & weakening momentum | Not reliable on low-volume or highly volatile stocks |
The Double Top pattern offers valuable insights for identifying bearish reversals but must be used with confirmation and supporting tools to mitigate risks associated with its limitations.
What are the Other Popular Chart Patterns besides Double Top?
The other chart patterns besides Double Top are mentioned below in the table.
| Pattern | Type | Description |
| Double Bottom | Reversal | Opposite of double top; signals bullish reversal |
| Head and Shoulders | Reversal | Bearish reversal with three peaks |
| Inverse Head and Shoulders | Reversal | Bullish reversal version |
| Cup and Handle | Continuation | Bullish continuation pattern |
| Ascending Triangle | Continuation | Higher lows with resistance; bullish bias |
| Descending Triangle | Continuation | Lower highs with support; bearish bias |
| Symmetrical Triangle | Continuation | Consolidation before breakout |
| Flag | Continuation | Sharp move followed by small correction |
| Pennant | Continuation | Small symmetrical triangle after a strong move |
| Wedge (Rising/Falling) | Reversal | Signals weakening trend and potential reversal |
| Rectangle | Consolidation | Range-bound price before breakout |
These patterns help traders identify potential trend continuations or reversals and improve trading decisions across different markets and assets.
What is the difference between Double Top and Double Bottom?
The difference between Double Top and Double Bottom is mentioned below in the table.
| Feature | Double Top | Double Bottom |
| Type | Bearish reversal pattern | Bullish reversal pattern |
| Trend Before Pattern | Uptrend | Downtrend |
| Structure | Two peaks at similar price levels | Two troughs at similar price levels |
| Key Level | Neckline (support) | Neckline (resistance) |
| Signal Trigger | Breakdown below neckline | Breakout above neckline |
| Psychology | Buyers fail twice → sellers gain control | Sellers fail twice → buyers gain control |
| Volume Behaviour | Often lower volume on second top | Often lower volume on second bottom |
| Outcome Expectation | Downtrend continuation after breakdown | Uptrend continuation after breakout |
Both patterns rely on the breakout or breakdown of the neckline to confirm the reversal and are valuable tools for traders to anticipate significant trend shifts and make informed trading decisions.
Difference between Double Top vs Head and Shoulders vs Triple Top
The difference between Double Top vs Head and Shoulders vs Triple Top are mentioned below in table.
| Feature | Double Top | Head & Shoulders | Triple Top |
| Number of Peaks | 2 peaks at similar levels | 3 peaks (left shoulder, higher head, right shoulder) | 3 peaks at similar levels |
| Shape | “M” shaped | Three-wave structure with central higher peak | Flat, wide structure with three equal highs |
| Reliability | Moderate | High | Higher than Double Top; less common |
| Trend Requirement | Strong prior uptrend | Mature uptrend | Uptrend or sideways-to-uptrend |
| Key Psychology | Buyers fail twice at resistance → exhaustion | Shift from higher highs to lower highs → distribution | Buyers fail three times → strong selling pressure |
| Neckline Type | Single horizontal swing-low support | Can be horizontal, rising, or falling | Horizontal support formed by two swing lows |
| Breakdown Confirmation | Close below neckline | Close below neckline | Close below neckline/support |
| Target Projection | Height from peak to neckline | Height of head to neckline | Height from peak to neckline |
| Frequency in Market | Very common | Common in trends | Less common |
| Strength of Reversal | Moderate reversal potential | Strong reversal potential | Strong but slower reversal |
| Volume Behavior | High volume on breakdown boosts reliability | Left shoulder high → head lower → breakdown high | Volume rises on third rejection and breakdown |
Each pattern has unique characteristics, reliability, and implications for trend reversals, helping traders choose appropriate setups based on market context.


 Previous Article


 2026: Features, Pros vs Cons, Pricing, Reviews, Is It Worth It? 59")
 2026: Features, Pros vs Cons, Pricing, Reviews, Is It Worth It? 60")
 2026: Features, Pros vs Cons, Pricing, Reviews, Is It Worth It? 62")

![85 Common Stock Market Terminologies for Dummies [Updated List for 2025]](https://www.strike.money/wp-content/uploads/2025/04/Popular-Stock-Market-Terms-for-Beginners-Banner.png "85 Common Stock Market Terminologies for Dummies [Updated List for 2026] 64")


? Definition, Formula, Calculation, and Trading, 69")


No Comments Yet.