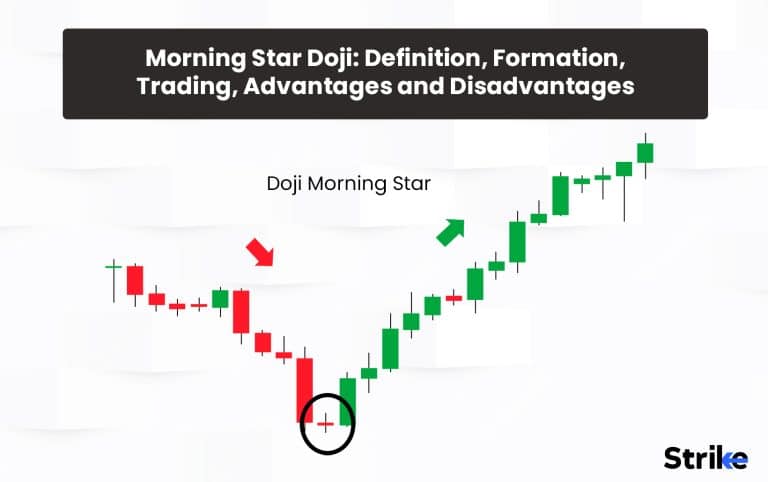
Morning Star Doji is a candlestick pattern used for technical analysis by traders to predict price changes in assets. Morning Star Doji is formed by three candlesticks, and it depicts a reversal of the downtrend. The Morning Star pattern is formed at the bottom of the downtrend; the first candle of the Pattern is bearish, the middle candle depicts a turbulent situation in which the bulls take control of the bears, and the third candlestick is a bullish candle that depicts the control of bulls on the market.
There are no particular calculations required to create a morning star because a morning star is simply a visual pattern. A morning star is a three-candle pattern in which the second candle contains the low point. The low point, however, is not visible until the third candle has closed.
The history of the Morning Star Doji candlestick pattern can be traced back to the early days of Japanese rice trading in the 17th and 18th centuries. The Japanese developed a system of technical analysis using candlestick charts, which allowed them to identify patterns and trends in the market.
The Morning Star Doji pattern is believed to have been named by Steve Nison, a well-known Western expert on candlestick charting, who popularised Japanese candlestick charts in the West in the 1980s. Nison identified the Morning Star Doji pattern as a strong bullish reversal pattern that traders could use to identify potential buy signals in the market.
The Morning Star Doji pattern has become a widely recognized technical indicator used by traders and analysts around the world. Trading with the help of just the visual candlestick patterns is always risky; to avoid false signals, traders should always verify their decisions with the help of other indicators like support level.
What is a Morning Star Doji?
A Morning Star Doji is a candlestick pattern used in technical analysis to identify a potential reversal in the price of an asset. It is formed by three candlesticks:

- The first candlestick is a long, bearish candlestick, indicating that the sellers have dominated the market.
- The second candlestick is a Doji, which means the opening and closing prices are almost the same. This reflects indecision in the market, with neither buyers nor sellers able to take control.
- The third candlestick is a long, bullish candlestick, indicating that the buyers have taken control of the market.
The Morning Star Doji is a prominent example of Triple Candlestick patterns, recognized for its potency as a reversal signal following a downtrend. This pattern indicates a shift in market dynamics, suggesting that the control is transitioning from sellers to buyers.
Traders see Triple Candlestick patterns, such as the Morning Star Doji, as critical indicators of changing market sentiment. The sequence of these three candlesticks—beginning with a long, bearish candlestick showing sellers’ dominance, followed by a Doji signaling their waning momentum, and culminating in a long, bullish candlestick—confirms the buyers’ takeover and the upward price movement.
Observing this pattern, traders often consider it a reliable signal to initiate a long position, anticipating a continued upward trend in the price.
How is a Morning Star Doji Candlestick Formed?
The Morning Star Doji pattern is considered to be a strong bullish reversal pattern, as it suggests that the selling pressure in the market is losing momentum and that the buyers are starting to take control. Below is what the candlestick pattern looks like.

1.The first candlestick is a long bearish candlestick: This represents a period of selling pressure in the market, where the bears have been in control. The opening price is usually at or near the high of the candlestick, while the closing price is at or near the low of the candlestick.
2. The second candlestick is a Doji: This represents a period of indecision in the market, where neither the buyers nor the sellers are in control. The opening and closing prices of the Doji are very close to each other, resulting in a very small candlestick body. The length of the upper and lower shadows may vary.
3. The third candlestick is a long bullish candlestick: This represents a period of buying pressure in the market, where the bulls have taken control. The opening price is usually at or near the low point of the candlestick, while the closing price is at or near the high point of the candlestick. The length of the candlestick is usually about the same as the first candlestick.
The Pattern is confirmed when the price closes above the high of the third candlestick, which signals that the bullish momentum is likely to continue. Traders often use this Pattern to identify potential entry points for long positions in the market.
What does Red Morning Star Doji Candlestick indicate?
The Red Morning Star Doji Candlestick pattern is formed when the value of securities is falling (downtrend). The Red Morning Star Doji Candlestick pattern is formed by three candlesticks. The first candlestick is a long, red, bearish candle, indicating the dominance of sellers in the market. The second candlestick is a Doji having a relatively smaller real body, indicating no particular direction of price movement. The Doji candlestick typically gaps up between the first and the third candle, indicating a possible shift in market sentiment. The third candlestick is again a red candle that closes below the midpoint of the first red candlestick.
The Red Morning Star Doji pattern suggests that after a period of bearishness (dominated by sellers), there is a brief period of indecision represented by a smaller (Doji) candlestick, followed by a renewed bearish momentum. This indicates that sellers have regained control of the market, which increases the chances of a potential reversal in trend.
What does Green Morning Star Doji Candlestick tell?
The Green Morning Star Doji is a three-candlestick pattern that can appear when the price of stocks is rising and is considered a bullish reversal pattern.
It is formed by a long green candle, which is followed by a small Doji candlestick that gaps down, and then completed by a third long green candlestick that closes above the midpoint of the first green candlestick, which means that the third candlestick is at least longer than half the length of the first candlestick. The most important point is that both the first and second candlesticks are bullish in the case of Green Morning Star Doji.
The Green Morning Star Doji pattern indicates that after a period of bullishness, there is a brief period of indecision (represented by the Doji candlestick), which is then followed by a renewed bullish momentum. This indicates that buyers have gained control of the market again, and a potential reversal in trend can occur.
Does It Matter if A Morning Star Doji Candlestick Is Red or Green?
Yes, it matters if a Morning Star Doji Candlestick is Red or Green. The general differences between a green Morning Star Doji and a red Morning Star Doji are as follows:
- Color: The primary difference between the two is the color of the Doji candle. The Doji candle is green; in a green Morning Star, Doji indicates that the opening and closing prices are higher than the previous day’s closing price. The Doji candle is red, In a red Morning Star Doji, meaning that the opening and closing prices are lower than the previous day’s closing price.
- Sentiment: The color of the Doji candlestick plays a major role in understanding the sentiment of the market. In the case of Green Morning Star Doji, the market sentiment is bullish, whereas in the case of Red Morning Star Doji, the sentiment is bearish.
- Strength: A green Morning Star Doji is considered stronger than a red Morning Star Doji as the bullish sentiment is more prominent in the former.
The color of the doji plays a major role in determining the sentiments of the market, and the colors in both types are different. Hence, the market condition of occurrence of both types of candlestick is highly different.
When does Morning Star Doji Candlestick happen?
The Morning Star Doji is a three-candlestick bullish reversal pattern that typically occurs at the end of a downtrend. The Pattern consists of the following three candles:
- The first candlestick is a red or black candlestick that depicts the dominance of sellers in the market; when the market is dominated by sellers, the price of security drops. This downtrend is denoted with the help of long red or black candles. This Pattern starts appearing at the end of the downtrend.
- The second candlestick is a Doji because it does not have a long real body; it shows the turbulence in the market. This happens when the market does not have a particular direction of price movement.
- The third candlestick is a bullish candle denoted by green or white color. This candlestick indicates that buyers have gained control of the market; whenever this happens, the price of the security increases. The Pattern typically occurs at the end of a downtrend and suggests that a bullish trend is starting.
This three-candlestick Pattern is verified when the price of the security moves above the high of the third candlestick in the Pattern. The Pattern can occur in any timeframe, from minutes to days or weeks.
How often does Morning Star Doji Candlestick occur?
The Morning Star Doji Candlestick is very common in the market, and it occurs from time to time in all the time frames. The Morning Star Doji pattern’s occurrence is not consistent, and it can be influenced by the asset’s volatility, liquidity, and other market dynamics.
The Morning Star Doji pattern occurs after a longer duration of falling prices, as it is a bullish reversal pattern. The Pattern is considered more reliable when it appears on longer time frames, such as daily or weekly charts, but still, The Morning Star Doji can also appear on comparatively shorter time frames, such as hourly and minute charts.
In a highly volatile and dynamic market such as foreign exchange, the Morning Star Doji pattern can occur more often than in less volatile and liquid markets such as stocks.
How do you read Morning Star Doji Candlestick in Technical Analysis?
Traders look for three specific candlesticks that appear in a specific order to read the Morning Star Doji Candlestick in Technical Analysis. Following are the four steps required for reading Morning Star Doji Candlestick:
- Identify the First Candle: The first candlestick in the Morning Star Doji pattern is a long red or black bearish candlestick. This implies that the sellers have been in control of the market, and the price has been declining (downtrend).
- Identify the First Candle (Doji): The second candlestick is a Doji, having a very small real body, and the opening and closing prices are almost equal. The color of the Doji can be either red or green, depending upon the market conditions.
- Identify the Third Candle: The third candlestick is a bullish candlestick, which is white or green in color. This candlestick appears just after the Doji and indicates the beginning of a new uptrend. This candle indicates strong buying pressure and a potential trend reversal.
- Confirmation: After identifying all three candlesticks signifying trend reversal, it is highly recommended to confirm this with the help of other patterns or volume indicators to avoid false signals.
The following three points should be kept in mind to identify The Morning Star Doji Candlestick pattern easily in the charts:
- The Doji candlestick should have a relatively smaller body and longer shadows than the other two candles. This can be imagined as a game of tug of war between bulls and bears, and neither side won.
- The Morning Star Doji Candlestick pattern is more reliable when it appears after a downtrend of a particular asset, and there is a sufficient gap between the first and second candlesticks of the Pattern.
- The third bullish candlestick should have a real body, which is at least twice as long as that of the Doji candlestick. This directly implies strong buying pressure and potential trend reversal opportunities.
In the realm of Technical Analysis, the Morning Star Doji pattern is a highly regarded signal, indicating a potential trend reversal from bearish to bullish. Practitioners of Technical Analysis pay close attention to this pattern, understanding that it suggests a shift in market dynamics. Traders, upon identifying this pattern and confirming that the specific conditions align with their analytical criteria, often consider it an opportune moment to buy the asset, expecting a bullish momentum to follow.
How accurate is the Morning Star Doji Candlestick in Technical Analysis?
The Morning Star Doji candlestick pattern is considered one of the best bullish reversal patterns in technical analysis, but like all technical analysis tools, it also does not always produce completely accurate results. The accuracy of the Morning Star Doji pattern depends on the following three factors:
- Assets: The accuracy of the results produced by the Morning Star Doji Candlestick pattern is highly dependent on the kind of assets used for Trading. The Morning Star Doji, for example, works more efficiently for high-liquidity assets like forex as they have more consistent price movements in a specific direction as per the trend, while assets with low liquidity can be subject to more volatility and irregular price movements. The choice of assets highly impacts the accuracy of outcomes from such candlestick patterns.
- Timeframes: The preciseness of the Morning Star Doji pattern depends on the timeframe being used for Trading. The Pattern is more effective on bigger timeframes, such as weekly and monthly charts, as opposed to shorter time frames, like daily or hourly charts. This is because longer timeframes provide a better representation of the overall trend, while shorter timeframes may be subject to more noise and fluctuations.
- Factors for Trading Decision: Traders should analyze other candlestick patterns, technical patterns and tools, and fundamental analysis to get a more accurate condition of the market direction.
The accuracy of the Morning Star Doji pattern can vary depending on uncontrollable factors like news, market crashes, geopolitical issues, etc.; traders should analyze such things as well to make informed trading decisions and manage risk.
How reliable is a Morning Star Doji Candlestick in Technical Analysis?
Technical analysts all over the world regard the Morning Star Doji Candlestick as a trustworthy pattern, but like all technical tools, it is not perfect. The Pattern depends upon uncontrollable factors like market circumstances, the timeframe under consideration, and the traded asset; these can heavily affect how reliable a pattern is:
- Volume: The reliability of the Morning Star Doji pattern also depends on the volume accompanying the Pattern. When the Pattern is accompanied by high trading volume, it is more reliable as it suggests that there is significant buying interest.
- Price Action: The effectiveness of the Morning Star Doji pattern also depends on the price action leading up to the Pattern. For example, the Morning Star Doji pattern will be more effective and precise when it appears after a heavy downtrend of an asset or when there is a clear support level that the price has bounced off.
- Time of Day: The effectiveness of the Morning Star Doji pattern also depends on the time of day it appears. For example, the Pattern is more reliable when it appears at the end of the trading day, as it may indicate that investors are planning for the upcoming day.
Traders should always use the Morning Star Doji Candlestick pattern in combination with additional evaluation tools, patterns, and indicators to manage risk and confirm possible trend reversals.
When is the best time to Trade using Morning Star Doji Candlestick?
The best time to trade using the Morning Star Doji Candlestick pattern depends upon factors like market trends, the timeframe being analyzed, the asset being traded, etc.
The traders should consider relevant time frames before using Morning Star Doji to get appropriate outputs. The Pattern can be more reliable on longer timeframes, such as weekly or monthly, as compared to shorter daily or hourly timeframes. This is because longer time frames provide a better representation of the overall trend, while shorter timeframes may be subject to more noise and fluctuations.
The best time to trade using the Morning Star Doji candlestick pattern is when it appears at the end of a downtrend. This means that the Pattern is more likely to signal a trend reversal, as the bears have been in control of the market, and the Pattern indicates that the bulls are taking over.
Traders can use the Morning Star Doji pattern to identify potential buy signals in the market. When the Pattern appears, traders will often look for confirmation that the bullish trend is continuing. This may include looking for other technical indicators, such as moving averages or oscillators, to confirm the signal.
What is an example of a Morning Star Doji Candlestick used in Trading?
Suppose a trader is analyzing the price action of ABC Company’s stock, which has been in a downtrend for several weeks. The trader notices a Morning Star Doji pattern on the daily chart, which is formed by the following three candlesticks:
- The first candlestick is a long, bearish candlestick, which represents the selling pressure in the market. The stock opened at Rs.50 and closed at Rs.45.
- The second candlestick is a Doji, which represents the indecision in the market. The stock opened at Rs.45 and closed at Rs.44, with a small body and long shadows.
- The third candlestick is a long bullish candlestick, which represents the buying pressure in the market. The stock opened at Rs.44 and closed at Rs.48.
The trader recognizes that the Morning Star Doji pattern is a strong bullish reversal pattern, which indicates that the selling pressure in the market is losing momentum and that the buyers are taking control. The trader decides to go long on ABC Company’s stock, anticipating that the bullish trend will continue.
The trader sets a stop-loss order at $43, just below the low of the Doji candlestick, to limit potential losses if the bullish trend fails to materialize. The trader also sets a profit target at $55, depending on the length of the first bearish candlestick.
As the trader predicted, the bullish trend continues, and the stock rises to $55 over the next few weeks. The trader takes profits and exits the position, realizing a substantial gain.
The Morning Star Doji candlestick pattern helped the trader identify a potential buying opportunity in the market and make a profitable trading decision in the above example.
Where is the Morning Star Doji commonly used?
The Morning Star Doji candlestick pattern is commonly used in technical analysis by traders and analysts in the financial markets, including stocks, bonds, commodities, and forex.
It is a popular tool for identifying potential trend reversals and entry points in the market, particularly in conjunction with other technical indicators and analyses. The Pattern is often used by traders who follow the principles of Japanese candlestick charting, which has become a widely recognized method of technical analysis in the Western world.
The Morning Star Doji pattern is also used by traders who follow a variety of trading strategies, including swing trading, position trading, and day trading. It is particularly useful for swing traders who aim to capture medium-term trends in the market, as the Pattern often signals a shift in market sentiment and can provide an early indication of potential buying opportunities.
How do you trade with Morning Star Doji Candlestick in the stock market?
Trading with the Morning Star Doji candlestick pattern in the stock market involves identifying potential buying opportunities and using appropriate risk management strategies to maximize profits and minimize losses. Following are the three general steps for trading with the Morning Star Doji candlestick pattern:
- Identify the Morning Star Doji pattern: The Morning Star Doji pattern is a bullish reversal pattern that consists of three candlesticks. The first candlestick is a long bearish candle, the second candlestick is a Doji, and the third candlestick is a long bullish candle. It indicates that the selling pressure in the market is losing momentum and that the buyers are taking control.
- Confirm the Pattern: It is important to confirm the Pattern using other technical indicators or chart patterns before taking a trading position based on the Morning Star Doji pattern. This can include looking for bullish confirmation signals, such as a bullish divergence in the Relative Strength Index (RSI), a break above a resistance level, or a bullish crossover in a moving average.
- Enter the trade: A trader can enter a long position in the stock market once the Morning Star Doji pattern is confirmed. The entry point can be the opening price of the third bullish candlestick or a break above a resistance level. The stop-loss order can be placed just below the low of the Doji candlestick or a support level to limit potential losses.
- Manage the trade: It is important to manage the trade and adjust the stop-loss and profit targets as the price of the stock changes. Traders can also use trailing stops to lock in profits and limit potential losses.
It is crucial to keep in mind that trading with the Morning Star Doji candlestick chart pattern is just one trading approach and should be used in combination with other types of technical analysis and risk management guidelines.
Is a Morning Star Doji in An Uptrend a Sell Signal?
Yes, a Morning Star Doji is a candlestick pattern that usually appears during a downtrend and is considered a bullish reversal pattern. This indicates that the market sentiment has changed from bearish to bullish, which means that the buyers have taken control of the market. The price of assets increases when the market is bullish (controlled by the buyers), which means it is the most appropriate time for traders to buy assets. This would ensure that the traders buy that particular asset at a lower price, and then they would be able to sell the same asset at a much higher price, which would ultimately help them earn profit.
What are the advantages of a Morning Star Doji Candlestick Pattern?
The Morning Star Doji Candlestick Pattern is a widely used three-candlestick pattern that appears during a downtrend and is considered a bullish reversal signal. Here are four advantages of the Morning Star Doji pattern:
- Indicates a possible trend reversal: The Morning Star Doji pattern suggests that the selling pressure has been exhausted, and the bulls are taking control. It is a signal that the trend is likely to reverse, and the price may start to move up.
- Provides a clear entry signal: Traders can take it as a clear signal to enter a long position, expecting the price to rise when the Morning Star Doji pattern forms.
- Offers a good risk-reward ratio: Traders can set a tight stop-loss order below the low of the Pattern since the Morning Star Doji pattern is a clear signal of a trend reversal. This allows for a good risk-reward ratio, as the potential profit is higher than the potential loss.
- Works on different timeframes: The Morning Star Doji pattern can be observed on different timeframes, from minute charts to daily or weekly charts, and can be used by traders with different trading styles and preferences.
The Morning Star Doji Candlestick Pattern is a reliable and popular technical analysis tool used by traders to identify potential trend reversals and take advantage of the subsequent price movements.
What are the disadvantages of a Morning Star Doji Candlestick?
The Morning Star Doji Candlestick is a very popular indicator, but just like other technical indicators, it also has some shortcomings. Following are some of the disadvantages of a Morning Star Doji Candlestick:
- False signals: The Morning Star Doji pattern can generate false signals, which means that a trader could potentially enter a trade based on this Pattern only to see the market move against them.
- Ambiguity: A Morning Star Doji pattern is generally considered to be a bullish reversal signal; it can sometimes be difficult to interpret the Pattern, especially if there are other indicators or factors at play in the market.
- Lagging indicator: The Morning Star Doji pattern is a lagging indicator, which means that it only provides information about past price action and may not accurately predict future price movements.
- Limited applicability: The Morning Star Doji pattern is most effective in certain market conditions and may not work well in other situations, such as during periods of high volatility or when there is significant market news or events that can affect price action.
The above-mentioned limitations can be overcome by using Morning Star doji with other relevant indicators to confirm its outputs.
What is the Opposite of Morning Star Doji Candlestick?
The opposite of a Morning Star Doji candlestick pattern is the Evening Star Doji pattern. The Evening Star Doji is also a three-candlestick pattern that typically appears during an uptrend and signals a potential trend reversal to the downside. A bearish reversal indication is given when the Evening Star doji forms during a trading session at the peak of an asset’s uptrend. The big green bullish candlestick at the beginning of the Pattern denotes the market’s predominance by buyers.
A Doji candlestick with nearly equal opening and ending values is the following candlestick. The middle Doji candlestick has a very tiny real body, representing the market’s turbulence and uncertainty. The third and final candlestick is a lengthy red bearish candle that symbolizes the market’s predominance by sellers. The Evening Star Doji is the name given for this full arrangement of three candlesticks. It denotes a change in the market’s upward tendency for a specific security. When these three candles appear in quick sequence, it means that an uptrend is about to end and that a downtrend will soon start. The appearance of the Evening Star Doji is interpreted by traders as a sell indication, and they may attempt to take profits or open short positions.
What are other types of Doji Candlestick Patterns besides Morning Star Doji?
Candlestick patterns are widely used technical analysis tools used by traders and analysts all around the world.
Among all the different kinds of patterns used by traders in the market, the doji candlestick pattern is unique. Doji candlesticks are identified by their very small real body, having opening and closing values that are almost the same. Because of these characteristics, the Doji candles are denoted by a cross-like pattern in the chart, having long upper and lower shadows indicating volatile prices in the market. Doji indicates a market condition where the market is neither dominated by sellers nor buyers; also, in such a condition, the price is not influenced by any particular trend direction.
Following are six different types of Doji candlestick patterns, each having their own unique characteristics and potential implications for the market:
- Gravestone Doji
- Dragonfly Doji
- Long-Legged Doji
- Four-Price Doji
- Northern Doji
- Southern Doji
When using Doji candlestick patterns, it is important to pay attention to the overall market context and conditions. A Doji candlestick that appears during a period of high volatility and uncertainty may have a different interpretation compared to a Doji candlestick that appears during a period of low volatility and stable market conditions. Additionally, traders should also consider the volume of trading activity during the period in which the Doji candlestick appears. The higher trading volume during the period can provide additional confirmation of a potential trend reversal.
It is also worth noting that Doji candlestick patterns can sometimes be unreliable, particularly in volatile market conditions where price movements can be erratic and unpredictable. False signals can occur, leading to potential losses if traders rely solely on Doji candlesticks for their trading decisions. Therefore, it is essential to use other technical analysis tools and indicators to confirm potential trend reversals and minimize risks.
Doji candlesticks are a widely used and important tool in technical analysis for identifying potential trend reversals in financial markets. The different types of Doji candlestick patterns each have their own unique characteristics and implications for the market. However, traders should use Doji candlestick patterns in combination with other technical analysis tools and indicators and consider the overall market context and conditions to confirm potential trend reversals and minimize risks.
What Candlestick Pattern is Similar to Morning Star Doji Candlestick?
The Morning Star Doji candlestick is similar to the Morning Star Pattern. The Morning Doji pattern is similar to the Morning Star Doji candlestick as both are bullish reversal signals. The Morning Star pattern is also formed with the help of three candlesticks; the first candlestick is a long red or black candle that shows the dominance of bears in the market. The second candle is a small candlestick that shows the indecision in the market. It can be imagined as a game of tug of war between bears and bulls, where the middle candle depicts the position at which both are equally dominant in the market. The third candlestick is a long white or green bullish candle that closes above the midpoint of the first bearish candle. This candle depicts the dominance of bulls, who are pushing the price of securities upwards in the market.
Following are five similarities between the Morning Doji Star and Morning Star candlestick patterns:
- Both Morning Doji Star and Morning Star candlestick patterns are bullish reversal patterns that signal a potential trend reversal from bearish to bullish.
- Both patterns contain three candlesticks, the first being black or red, for signaling the dominance of bears in the market.
- The second candle in both patterns is a small-bodied candle creating a Doji or spinning top. The middle candle in both patterns indicates indecision in the market.
- The third candle in both patterns is an extended green or white candle that closes well above the midpoint of the first candle. This candle signals the existence of bulls in the market and indicates that the trend is reversing.
- Both patterns are rarely observed in the market, and their arrival on a chart can be a significant signal for traders and analysts.
Is Morning Star Doji a bullish reversal pattern?
Yes, The Morning Star Doji is a bullish reversal pattern. This Pattern denotes the change in the market sentiment from bearish to bullish. This Pattern is formed at the end of the downtrend of a particular security. It is formed with the help of three candlesticks; the first one is a long, bearish candlestick representing the dominance of sellers, who are pushing the price of the particular security downwards. The bearish candlestick is followed by a Doji with a small real body. The Doji fills the gap between the first and third candlestick, and the last candlestick forms a bullish pattern, marking the dominance of buyers who are pushing the price of the security upwards.
The Morning Star Doji pattern is a bullish reversal pattern because it suggests that the previous downtrend of a particular security is losing momentum, and a new uptrend may be starting, marking the dominance of bulls.
It is important to consider the context in which the Morning Star Doji pattern appears. For example, when the Pattern appears after a long uptrend, it may not be a strong bullish reversal signal, but it may be a more reliable signal of a bullish reversal if the Pattern appears after a long downtrend.
What is the difference between Morning Star Doji and Evening Star Doji?
The Morning Star doji and Evening Star doji are both used by traders to identify opportunities for trend reversal. Both Morning and Evening Star Doji are composed of three candlesticks each, but their relative positions in the chart are different.

The Evening Star doji provides a bearish reversal signal, and it is formed at the top of the uptrend of a particular security during a trading session. The Pattern starts with a long green bullish candlestick that represents the dominance of buyers in the market. The next candlestick is a Doji, which has almost equal opening and closing values. The middle candlestick has a very small real body; this candle indicates the uncertainty and turbulence in the market.
The (third) last candlestick is a long red bearish candle representing the dominance of sellers in the market. This complete setup of three candlesticks is known as Evening Star Doji. It signals a change or uptrend of a particular security in the market. It indicates that an uptrend is dying; when these three candles occur in succession, it indicates that a reversal in the form of a downtrend will occur. Traders interpret the appearance of Evening Star Doji as a sell signal and try to take profits or enter into short positions.
The Morning Star Doji is a commonly used candlestick pattern for technical analysis used by traders to predict price movements for a particular security in the market. The Morning Star Doji is also a three-candlestick pattern, which occurs during the end of the downtrend and predicts a bullish reversal. The first candle of the Morning Star Doji pattern is a bearish candle, indicating that the sellers are in control of the market and hence, the value of the security is falling (downtrend). The second candlestick is a Doji with a smaller real body and both opening and closing values that are almost equal. This shows that there is uncertainty in the market, and neither the bulls nor the bears are able to push the price of the security significantly in either direction. The third candle is a long bullish candle, showing that the bulls have returned to the market and are pushing the price of security upwards. The Morning Star Doji is also a potential reversal signal as it indicates that the bears have lost control over the market, and bulls have taken over the market.
The main difference between the Morning Star and Evening Star Doji is the direction of the trend they appear in and the potential reversal they signal. The Morning Star Doji signals a potential bullish reversal after a downtrend (falling price), while the Evening Star Doji signals a potential bearish reversal after an uptrend (rising price).


 Previous Article


![15 Investing.com Alternatives [Free+Paid] You Should Use in 2026](https://www.strike.money/wp-content/uploads/2026/04/Investing.com-Alternatives.jpg "15 Investing.com Alternatives [Free+Paid] You Should Use in 2026 40")
![15 TradeStation Alternatives [Free+Paid] You Should Use in 2026](https://www.strike.money/wp-content/uploads/2026/04/TradeStation-Alternatives.jpg "15 TradeStation Alternatives [Free+Paid] You Should Use in 2026 41")
![15 Chartink Alternatives [Free+Paid] You Should Use in 2026](https://www.strike.money/wp-content/uploads/2026/04/Chartlink-Alternatives.jpg "15 Chartink Alternatives [Free+Paid] You Should Use in 2026 42")
: Overview, 10 Types of Indicators, Settings for Different Markets 43")


 : Definition, Formula, calculation, Uses, Advantages Vs limitations 46")


No Comments Yet.