The three black crows have a bearish candlestick pattern that indicates an uptrend reversal. The three black crows pattern occurs when bears outnumber bulls in three consecutive trading sessions. The three black crows have long-bodied, bearish candlesticks that close at or near the period’s low price. They are only considered during an uptrend since they are an uptrend reversal pattern.
One advantage of using the three black crows pattern is that it signals traders that a trend change is imminent, allowing them to make informed trading decisions. A disadvantage of relying solely on this pattern is that it is only sometimes accurate, as market conditions can quickly change, and the pattern needs to hold true only sometimes.
What is a Three Black Crows Candlestick?
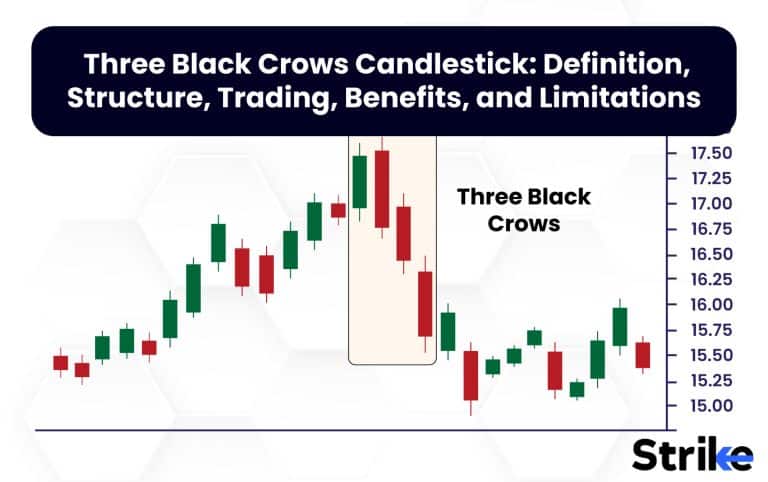
The Three Black Crows Candlestick pattern is a bearish reversal pattern consisting of three consecutive long-bodied candles with lower and lower highs. Three black crows occur after an uptrend and are characterized by a strong shift in market sentiment from bullish to bearish. The three candles open near the previous candle’s high and close near the low, indicating consistent selling pressure in the market. Take a look at the image below.
The above pattern is identified as three black crows for three reasons. The reasons are listed below.
- The pattern is formed during an uptrend. The stock is clearly bullish below the pattern.
- Three long candles are formed, with each one having a lower height than the one before.
- The candles opened near the previous candle’s high and closed near the low.
Three black crows here show the reversal of an uptrend. The stock was pushed to bearish territory from a clear uptrend in the chart as well.
The Three Black Crows candlestick pattern has a counterpart known as the Three White Soldiers, the characteristics of which aid in identifying a bullish reversal or market upswing.
Is a Three Black Crows a Triple Candlestick Pattern?
Yes, the Three Black Crows Candlestick pattern is a triple candlestick pattern that signals a bearish reversal in the market. The pattern consists of three long-bodied candles in a row, with each candle opening near the previous candle’s high and closing near the low. Take a look at the picture below.

Three black crows is a visual-focused pattern and is often seen as a strong signal for traders to sell their positions and take profits before the market falls further.
What is the Significance of Three Black Crows Candlestick Patterns?
The Three Black Crows Candlestick pattern is significant because it signals a strong shift in market sentiment from bullish to bearish. A market sentiment shift could have many reciprocations and is also used to profit from them. A trader could use the appearance of the three black crow patterns as a sell signal, for instance. The pattern occurs after an uptrend, indicating that buyers are no longer willing to buy at higher prices and sellers are taking control of the market.
How Are the Three Black Crows Candlestick Pattern Structured?
The Three Black Crows Candlestick pattern is structured with three consecutive long-bodied candles, each with lower highs and lower lows. Take a look at the image below.

The first candle opens near the previous candle’s high and closes near the low.
The second candle opens near the previous candle’s high but closes even lower, indicating a stronger selling pressure.
The third candle opens near the high of the second candle but closes even lower, confirming the bearish trend.
When do Three Black Crows Candlestick Patterns occur?
The Three Black Crows Candlestick pattern appears following an uptrend and indicates a significant shift in market sentiment from bullish to bearish. The pattern frequently occurs following a period of consolidation or a price breakout, indicating that buyers are no longer willing to buy at higher prices and that sellers are gaining market control. Take a look at the below picture, for example.

The above is a price chart of Maruti Suzuki India Ltd. for a specific time period. Look at the highlighted part to see the pattern formation. The price action before the pattern formation underlines that the pattern occurs during an uptrend.
What are the criteria for Recognizing the Three Black Crows Candlestick Pattern in Technical Analysis?
Traders should look for three consecutive long-bodied candles with lower highs and lower lows to identify the Three Black Crows Candlestick pattern in technical analysis.
- The candles should open near the previous candle’s high and close near the previous candle’s low, indicating consistent selling pressure in the market.
- Traders should also look for high trading volumes during the pattern’s formation, which indicates a shift in market sentiment.
- The pattern could give false signals if the volume is low, as even a few trades could create a pattern to form, but it need not have any significant effect on the current trend.
Traders should consider the market situation as well when trying to recognize the three black crow patterns. The pattern is valid only when it appears during an uptrend, essentially because it is an uptrend reversal pattern. Traders, hence, should discard the pattern’s appearance during the bearish time period.
How accurate are Three Black Crows Candlestick Patterns?
The three Black Crows Candlestick pattern is considered to be a strong signal for traders to sell their positions and take profits before the market falls further. However, the accuracy of the pattern could depend on the individual scenarios as well. The accuracy depends on the market conditions and the trading time frame. Traders should hence consider the particular situation in hand to gauge the accuracy of the pattern.
Can you improve the accuracy of the Three Black Crows Candlestick?
Yes, traders improve the accuracy of the Three Black Crows Candlestick pattern by confirming the signal with other technical indicators and analysis methods. Traders, for example, can confirm the bearish trend by using trend lines, moving averages, and support and resistance levels. They also confirm the shift in market sentiment by using oscillators such as the Relative Strength Index (RSI) and the Moving Average Convergence Divergence (MACD).
Traders also use volume to confirm the accuracy of the pattern formed. The pattern is sometimes formed by giving a false signal during low-volume periods, impacted by a few substantial traders. However, the sentiment needs not always be shared by the rest of the traders in these situations.
Traders, hence, improve the accuracy of the three black crows’ pattern significantly by considering the volume and using a technical indicator.
What is the success rate of Three Black Crows Candlestick Patterns?
The Three Black Crows pattern is generally regarded as a reliable indicator of a possible trend reversal when it appears after an extended uptrend. The Three Black Crows pattern has a success rate of approximately 78% when it occurs in a bearish market, according to veteran investor and financial analyst Thomas Bulkowski.
How to Trade Using Three Black Crows Candlestick in the Stock Market?
Traders should wait for the pattern to form after an uptrend to trade in the stock market using the Three Black Crows Candlestick pattern. Let us look at an example to understand this better.

The above is a price chart of Bank Nifty for a particular time period. There are three important things to note here.
- The stock is in an uptrend at the beginning of the price chart
- The three black crow pattern formation criteria are met.
- The stock enters bearish territory after the formation of the pattern.
A trader should always look for this pattern in an uptrend, especially stretched ones. Traders do either of the below two things during the formation of the pattern.
- Sell their stocks to avoid loss. Three black crows are considered a sell signal because of the same.
- Short the stock to gain from the possible downtrend. Shorting, also known as short selling, is the act of selling a financial asset that is not owned by the seller with the hope of buying it back at a lower price to make a profit.
Traders should sell their positions and take profits once the pattern is confirmed before the market falls further. Traders should confirm the signal using additional technical indicators and analysis methods before entering trading positions.
What are some examples of a Three Black Crows Candlestick Pattern used in trading trading?
Let us assume a trader is watching the daily chart of a stock that has been steadily rising for several weeks. The trader observes three successive long red candles, each closing around the day’s bottom, producing the Three Black Crows pattern. This indicates to the trader that the upswing is losing steam and that a reversal is approaching. The trader chooses to open a short position with a stop-loss order right above the pattern’s high after closing the third candle. The trader will then maintain the position until the price hits a preset profit objective or the stop-loss is hit.
Can You Trade Three Black Crows Candlestick Patterns with RSI?
Yes, traders make trading decisions using the Relative Strength Index (RSI) and the Three Black Crows candlestick pattern. The RSI is a technical indicator that evaluates the strength and velocity of a market trend. The RSI scales from 0 to 100 and is commonly used to determine overbought and oversold market conditions. Traders use the RSI with the Three Black Crows pattern to check for confirmation of a trend reversal. For example, it indicates that the market is due for a correction if the Three Black Crows pattern appears after a long uptrend and the RSI is overbought (typically above 70).
The Three Black Crows pattern forms after a prolonged downtrend, and the RSI is in the oversold zone (typically below 30), which is a sign that the market is due for an upside reversal.
Can you trade Three Black Crows Candlestick Pattern with MACD?
Yes, traders make trading choices using the Moving Average Convergence Divergence (MACD) indicator in combination with the Three Black Crows candlestick pattern. The MACD is a common technical indicator that indicates a trend’s momentum. It comprises two lines, the MACD line, and the signal line, as well as a histogram that shows the difference between the two lines.
Traders use the MACD to determine trend direction, momentum, and probable trend reversals. Traders can search for confirmation of a trend reversal when employing the MACD with the Three Black Crows pattern. The Three Black Crows pattern appears after an extended rally, and the MACD lines begin to cross over and move lower, indicating that the market is poised for a correction.
The Three Black Crows pattern appears after a protracted downturn, and the MACD lines begin to cross over and move upward, indicating that the market is set for an upside turnaround.
What are the benefits of the Three Black Crows Candlestick Pattern?
The benefits of the Three Black Crows Candlestick pattern are that it provides a trading signal for traders to sell their positions and take profits. Below are the top four advantages of three black crows in Trading.
High Precision
According to certain research, the success rate of three Black Crows is more than 70%. This suggests that the price will likely fall further if a trader notices the Three Black Crows pattern.
The Three Black Crows pattern is a helpful tool for traders seeking trustworthy signals because of its high accuracy rate.
Simple to identify
The Three Black Crows pattern’s continuous bearish candles make this pattern easily identifiable on a candlestick chart. Beginner traders profit from adopting the Three Black Crows pattern since it is a basic and easy indicator.
Used in a variety of markets
Three Black Crows are not limited to a single market or asset. Therefore, traders apply it to stocks, forex, and other markets. The Three Black Crows pattern is a helpful tool for traders trying to diversify their portfolios.
It is important to exercise caution and to supplement technical analysis with fundamental analysis and risk management techniques when using three black crow patterns for the best results.
What are the limitations of the Three Black Crows Candlestick Pattern?
The limitations of the Three Black Crows Candlestick pattern are that it is a relatively rare pattern and may not occur frequently in the market. Below are the other three disadvantages of using the three black crows candlestick pattern.
False Signals
A signal from the pattern is considered false when the pattern occurs, but the price does not continue to decline. This can occur due to including a rapid shift in market mood or unexpected news. Traders employing the Three Black Crows pattern should be mindful of the likelihood of erroneous signals and take precautions to reduce their influence. Setting stop-loss orders or utilizing additional indicators to validate the signal are examples of this.
Delay in Confirmation
Another possible disadvantage of the Three Black Crows pattern is the delay in confirmation. This pattern necessitates the formation of three successive bearish candles, which might take some time. The Three Black Crows pattern requires traders to be patient and wait for the pattern to completely emerge before making a choice. This wait could be inconvenient for some traders who want immediate indications, but it is crucial to remember that patience is essential for effective Trading.
Traders need to be aware of the possibility of false signals, confirmation delay, and the limited timeframe of this pattern. Traders can determine if the Three Black Crows pattern is right for their trading strategy by weighing the pros and cons.
Is Three Black Crows Candlestick Profitable?
Yes, the Three Black Crows candlestick pattern is profitable when used correctly in conjunction with other technical indicators and proper risk management techniques.
Are Three Black Crows Bullish?
No, the Three Black Crows pattern is not bullish. It is a bearish reversal pattern that typically forms at the end of an uptrend.
What is the difference between Three Black Crows Candlestick and Three White Soldiers Candlestick?
The Three Black Crows and Three White Soldiers candlestick patterns are diametrically opposed patterns that signal a shift in market mood. Three Black Crows is a bearish reversal pattern that appears toward the end of an upswing. It consists of three long-bodied candles with successively lower highs and lower lows, indicating that the bears have assumed control of the market and that a price reversal is possible. The Three White Soldiers pattern, on the other hand, is a bullish reversal pattern that occurs toward the end of a downtrend. It comprises three long-bodied candles with successively higher highs and lower lows, indicating that the bulls have seized control of the market and that a price reversal is possible.


 Previous Article


![15 Investing.com Alternatives [Free+Paid] You Should Use in 2026](https://www.strike.money/wp-content/uploads/2026/04/Investing.com-Alternatives.jpg "15 Investing.com Alternatives [Free+Paid] You Should Use in 2026 52")
![15 TradeStation Alternatives [Free+Paid] You Should Use in 2026](https://www.strike.money/wp-content/uploads/2026/04/TradeStation-Alternatives.jpg "15 TradeStation Alternatives [Free+Paid] You Should Use in 2026 53")
![15 Chartink Alternatives [Free+Paid] You Should Use in 2026](https://www.strike.money/wp-content/uploads/2026/04/Chartlink-Alternatives.jpg "15 Chartink Alternatives [Free+Paid] You Should Use in 2026 54")
: Overview, 10 Types of Indicators, Settings for Different Markets 55")


 : Definition, Formula, calculation, Uses, Advantages Vs limitations 58")


No Comments Yet.