Market breadth is a key technical indicator that provides valuable insights into the underlying strength and momentum of stock market trends. Market breadth helps gauge the level of participation across different companies and sectors. Strong and improving breadth confirms an uptrend has solid foundations while deteriorating breadth warns of potential weakness beneath the surface.
Market breadth indicators have been developed to measure changes in supply and demand influencing the market. Oscillators like the McClellan Summation Index and Advance/Decline ratio track the daily difference between rising and falling stocks. The number of new 52-week highs and lows reveals the breadth of stocks joining trends or exhibiting fresh momentum. Other tools incorporate volume flow and moving averages to smooth data.
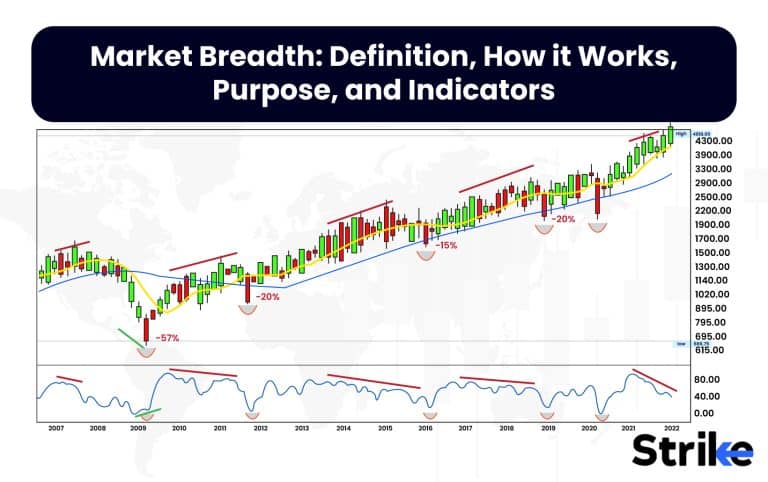
In this quick video analysis, we will learn about Market Breadth.
Monitoring these breadth numbers offers technical traders and investors important clues. Confirming breadth validates the primary trend, while divergent breadth sometimes leads to trend changes. Spikes in new highs signal growing optimism, whereas surges in new lows reflect capitulation. Extreme readings near overbought or oversold levels sometimes foreshadow short-term reversals.
What is the meaning of Market breadth?
Market breadth refers to the number of stocks participating in a market move, measuring how widespread the buying or selling is across different sectors and stocks. Market breadth indicators track the ratio of advancing to declining stocks and new highs versus new lows. This reveals the conviction and momentum behind a trend.
What is the background History of Market Breadth?
The concept originated in the early 20th-century United States markets. Indian market experts have adapted breadth indicators over the past few decades to specifically suit analysis of the Indian indices and stocks. In India, awareness and use of market breadth metrics grew primarily in the 1990s and 2000s as the markets modernized and expanded. With the establishment of the National Stock Exchange (NSE) in 1992, India had a nationwide electronic exchange for the first time. This led to a surge in trading volumes as more participants across the country could access the markets.
In these early NSE years, the benchmark index was the Nifty 50, comprising the top 50 large-cap stocks. However, market veterans soon realized that tracking only the Nifty 50 was not enough to gauge overall market sentiment and strength. The Nifty 50 could be making new highs, but the rally sometimes might not be broad-based if most mid-cap and small-cap stocks were not participating. Leading market experts like Ramesh Damani, Nirav Shah, Devina Mehra, and Ashwani Gujral began emphasizing the importance of analyzing market breadth specific to the Indian indices. They introduced Indian investors to breadth metrics like the NSE Advance-Decline ratio and the NSE Free Float Market Capitalization index.
How does Market Breadth function?
Market breadth metrics function by tracking the number of stocks participating in a market move in order to gauge the conviction and broadness of participation behind the move. Breadth indicators analyze advancing/declining data, new highs/lows, trading volumes, and other statistics to provide insights into the vitality of a trend. The key process behind market breadth analysis is comparing the price action of the overall market with the number of stocks confirming the move. For example, while analyzing an uptrend, market breadth statistics reveal whether large numbers of stocks are rising or if the gains are concentrated in just a handful of names.
What is the purpose of Market Breadth in the Stock Market?
One of the main purposes of market breadth is to gauge the underlying strength or weakness in the broader market. While major indexes track the overall market, they are disproportionately influenced by the largest market cap companies. Market breadth metrics track the performance of a wider swath of stocks across various sectors and market caps. This divergence between market breadth and major indexes foreshadows a potential correction or shift in the market.
On the other hand, strong market breadth with a high ratio of advancing stocks indicates broad market strength across different sectors and caps. Strong breadth numbers signal resilience and support for further gains even if the major indexes are flat or down. Analyzing breadth helps ascertain true market strength beyond just index levels. Market breadth also provides useful insights into overall investor sentiment and participation. Measuring the number of advancing and declining stocks reveals how bullish or bearish investors are behaving in aggregate.
For example, extremely negative breadth with far more decliners signals high levels of bearish sentiment and a lack of buying interest across the market. It sometimes indicates investors are turning cautious and broadly pulling back on risk-taking. Conversely, strongly positive market breadth implies high bullish optimism and willingness to buy stocks across sectors. Monitoring changes in breadth helps gauge shifts in sentiment and whether investors are becoming more bullish or bearish overall. It adds valuable sentiment context beyond volatility measures like the VIX.
What other words are used to describe market breadth?
In addition to the common term “market breadth,” the other associated words and phrases used to describe the technical condition of market internals are market participation, internal strength/weakness, momentum, traffic, inflows/outflows, accumulation/distribution, rotation, divergence, confirmation, and oscillation.
How can we analyze the breadth of the market?
Market breadth analysis involves monitoring advancing/declining issues, new highs/lows, moving average crossovers, momentum oscillators, volume trends, and divergences between indicators to gauge the underlying health and participation across the broader market. Focus on the advance-decline line, which plots the difference between the number of advancing and declining stocks on an exchange each day. An upward-sloping advance-decline line indicates positive breadth. Watch for divergences where the advance-decline line trends differently than major indexes, which are significant warning signals.
Compare the number of new 52-week highs to new lows. More new highs show a strong risk appetite. More new lows indicate growing risk aversion. New high/low data provides a pulse on market sentiment. Also, monitor how many total stocks are hitting new highs – fewer than 100 reflects weak breadth. Look at the percentage of stocks above their 50-day and 200-day moving averages. Readings above 70% indicate an overbought breadth extreme, while levels below 30% are oversold. Breadth becomes stretched at overbought extremes and vulnerable at oversold extremes.
What does Market Breadth indicate about Stocks?
Market breadth indicates the conviction behind a market trend by tracking the ratio of advancing and declining stocks. Strongly positive breadth shows broad participation in an uptrend, signaling the bull move has solid momentum. Negative breadth reflects widely distributed selling pressure, revealing weakness in a downtrend. Breadth often reverses direction ahead of prices, foreshadowing a shift in the trend. Analyzing breadth reveals true strength or weakness beyond index levels. The ratio of new 52-week highs to lows provides a useful breadth measure of market sentiment. Surging new highs indicate greed and euphoria dominate while spiking new lows reflect pervasive fear. Shifts in this ratio flag changes in psychology before manifesting in prices.
Observing breadth trends by sector highlights which segments are strongest or weakest. For example, robust technology breadth reflects leadership in that group. Tracking value versus growth stock breadth identifies favored styles. Breadth rotations emerge before price movements.
What are Market Breadth Indicators and their Uses?
Market breadth indicators are technical analysis tools that measure the number of advancing and declining stocks or securities over a given period. They provide insights into the overall health and direction of the stock market by analyzing the proportion of stocks that are participating in a market move.

1.On-Balance Volume
The on-balance volume (OBV) is a technical indicator that uses cumulative volume flow to analyze market participation and predict stock price trends. It adds volume when the price rises and subtracts when it falls. Rising OBV confirms uptrends as more buyers participate. Falling OBV confirms downtrends as more sellers participate. Divergences between OBV and price signal potential trend changes ahead as volume leads to price. Traders analyze OBV patterns like divergences and spikes at tops/bottoms to gain insights into emerging shifts in crowd psychology and identify reversal opportunities early.
2. Cumulative Volume Index
The Cumulative Volume Index (CVI) tracks net volume flowing into advancing or declining stocks over time. It helps determine if volume confirms price trends or signals reversals. Rising CVI shows accumulation exceeds distribution, validating uptrends. Falling CVI reveals distribution outweighing accumulation, confirming downtrends. Divergences between CVI and price warn of weakening participation that can presage trend changes.
Extreme CVI highs/lows reflect potential capitulation points. Traders analyze CVI patterns like divergences and extremes to identify opportunities and gauge shifts in crowd psychology. Rising CVI reinforces rallies, while declining CVI supports bear markets. The CVI filters out volatility and leads to price, providing early insight into emerging trend changes.
3. Advance/Decline Index
The Advance/Decline Index measures the daily difference between advancing and declining stocks. It confirms trends when rising with an uptrend or falling with a downtrend. This shows broad participation across multiple stocks and sectors. Divergences, where the A/D Index moves opposite the overall market, warn of waning momentum and signal potential trend shifts. Readings above +400 or below -400 reflect overbought or oversold conditions. Crossing the zero line signals changes from bullish to bearish momentum or vice versa. Traders gauge conviction behind market moves, and exhaustion signals with the A/D Index to help identify signs of impending trend reversals or shifts in internal market strength.
4. S&P 500 200-Day Index
The S&P 500 200-Day Index measures the percentage of stocks trading above their 200-day moving average. Readings above 50% show more upside participation, confirming uptrends. Readings below 50% reveal downside strength, validating downtrends. Levels over 70% are overbought, while under 30% signify oversold extremes. The 200-Day Index helps identify trend sustainability – rising confirms momentum while falling signals distribution. Divergences between it and the S&P 500 warn of weakening participation that can anticipate trend shifts. Traders analyze overbought/oversold levels and divergence signals using this breadth indicator to identify potential trend exhaustion and reversal opportunities.
5. Periodic High and Low
The Periodic Highs and Lows indicator counts stocks making new 1-week, 1-month, etc. highs or lows daily. Rising new highs confirm uptrend momentum as participation expands. Falling new highs warn of weakening momentum. Spikes in new lows signal panic selling and potential bottoms. Divergences between new highs/lows and indexes reflect waning participation that can anticipate reversals. For example, the S&P 500 made new highs, but new periodic highs failed to confirm, foreshadowing a correction. Traders analyze confirmation, divergence, and capitulation signals to identify strong trends or spot early signs of impending trend exhaustion. This breadth gauge helps assess conviction behind moves.
6. Percent/Number of Stocks Above Moving Average
The Percentage/Number of Stocks above a Moving Average measures market participation by calculating the stocks trading above a 50, 150, or 200-day average. High readings confirm uptrends have broad support as buying expands. Declining percentages validate weakening momentum and signal diverging internal strength that can anticipate trend exhaustion. Readings above 70% reflect overbought conditions prone to bull trap pullbacks, while sub-30% signifies oversold bottoms.
Breakouts above resistance levels or below support levels display accelerating participation that often initiates new bull or bear phases. Traders analyze overbought/oversold levels, divergences between the percentage and indexes, and momentum surges/failures using this breadth gauge to identify buying pressure shifts.
7. Net New High and Net New Lows Index
The Net New Highs/Lows Index measures daily momentum by subtracting new 52-week lows from highs. Rising Net New Highs confirms participation in uptrends, while falling Net New Lows signal to expand downside pressure. Divergences between the net new highs/lows and indexes warn of weakening momentum that can foreshadow reversals. Spikes in Net New Lows signify potential capitulation bottoms from panic selling. Crossovers, like new lows surpassing new highs, indicate shifts from bullish to bearish conditions. Traders analyze confirming signals, divergences, spikes, and crossovers using this breadth tool to identify sustainable trends or early signs of trend exhaustion and potential trend changes.
8. Percent/Number of Stocks above Relative Strength 55
The Percentage/Number of Stocks above Relative Strength 55 measures participation by calculating stocks with 12-month RS over 55. High readings confirm broad momentum, validating uptrends. Declining levels signal weakening breadth, corroborating downtrends. Divergences between the RS55 and indexes warn of waning participation that can foreshadow trend exhaustion. Readings over 70% denote overbought conditions prone to reversals, while under 30% reflect oversold bounces. Breakouts above resistance or below support exhibit accelerating conviction, usually initiating new phases. Traders utilize overbought/oversold breaches, divergences, and momentum shifts using this gauge to comprehend trend strength transitions.
Market breadth indicators analyze advancing/declining stocks, trading volumes, new highs/lows, moving averages, and momentum oscillators to evaluate the technical health and participation across a stock index.
What is an example of Market Breadth?
Examples of market breadth indicators include the Advance/Decline Index, Cumulative Volume Index (CVI), Breadth Thrust Indicator, McClellan Summation Index, and Absolute Breadth Index. The Advance/Decline Index shows the difference between the number of advancing and declining securities within an index. It can be used to determine the overall strength or weakness of the market. The Cumulative Volume Index (CVI) shows the direction of a market or index, such as the New York Stock Exchange or S&P 500 index.
The Breadth Thrust Indicator is a momentum indicator that identifies periods of extraordinary market breadth. It is calculated based on the number of advancing issues over the total number of issues. The Absolute Breadth Index is calculated by taking the absolute difference between the advanced and declining stocks. Large numbers usually suggest volatility is increasing.
What are the Benefits of Market Breadth?
Broad market breadth provides a comprehensive gauge of the underlying health and sustainability of stock trends, facilitating decisions on risk appetite, sector selection, and timing of entries and exits.
1.Confirms price trend follow-through
Strong market breadth numbers validate that a price trend has solid foundations and is participatory across a wide swath of stocks. Rising price trends coinciding with broad momentum measures like a high percentage of stocks above key moving averages, large advance-decline ratios, and expanding new highs suggest sustainable trend follow-through versus a narrow rally in a handful of stocks.
2. Signals divergence and reversals
Weakening breadth diverging from index price trends acts as an early warning of potential reversals. For example, a declining advance-decline line, waning new highs, or fewer stocks above moving averages alert to underlying weakness and heightened risk of a trend reversal, even as the overall index posts new highs. The divergence between breadth and prices flags a loss of momentum participation.
3. Gauges sentiment extremes
Very high or low breadth readings are able to identify overbought or oversold conditions. Spikes in new highs to extreme levels indicate euphoric sentiment, while surges in new lows signal high panic selling. These extremes tend to precede reversal points after breadth becomes exhausted.
4. Assesses risk appetite
Tracking breadth numbers like sector and capitalization participation shows how broadly investors are willing to take on risk. Broad participation across small-caps, mid-caps, and cyclical sectors signifies risk-on appetite and supports the uptrend. Narrowing to defensive and large-cap stocks warns of waning risk appetite.
5. Monitors sector opportunities
Analyzing breadth numbers by industry groups and sectors determines which are showing internal strength or weakness. This allows capitalizing on rotating sector leadership and strong industry groups while avoiding lagging sectors.
6. Confirms technical signals
Combining breadth data with technical indicators like overbought/oversold oscillators provides robust signals for entry and exit timing. Solid breadth aligns with technical signals and improves confirmation and follow-through.
Analyzing breadth improves understanding of market fundamentals and supplements technical analysis for higher probability strategic and tactical moves. Rather than just following price levels, utilizing breadth allows seeing underneath the market surface.
What are the Limitations of Market Breadth?
Market breadth indicators have limitations in timing reversals, volatility spikes, range-bound markets, sector rotations, black swans, and interpreting signals.
1.No precise timing indicator
Breadth indicators are best used for assessing the prevailing momentum and health of trends rather than providing precise reversal signals. Deteriorating breadth often indicates a greater probability of a trend reversal but does not pinpoint exactly when it will occur.
2. Vulnerable to volatility spikes
Large intraday volatility spikes are able to generate extreme one-day breadth readings that rapidly mean revert. For example, capitulation selloffs produce intense new low spikes that mark climactic exhaustion more so than durable weakness. Using short-term smoothing averages of breadth indicators avoids whipsaws.
3. Open to interpretation
There are no definitive threshold levels that reliably signal overbought or oversold conditions using breadth data. Analyzing trendlines, moving averages, and prior extremes provides context for interpreting current breadth readings.
4. Fails in range-bound markets
Breadth indicators perform best when prices exhibit directional trending conditions. During extended range-bound, choppy markets, breadth metrics are able to whipsaw with little sustained directional movement.
5. Requires supporting technical
Breadth numbers confirming price trends are only part of the equation. Utilizing technical indicators on the price chart itself, such as moving averages, support/resistance levels, candlestick patterns, and momentum oscillators, allows for complementing breadth data.
Breadth is most powerful when combined with price chart analysis, relative strength rankings, sentiment measures, and fundamental drivers. Incorporating breadth properly improves odds, but it is important to stay aware of its limitations.
How do Investors use Market Breadth for Investment?
Investors use market breadth indicators like advance-decline lines and breadth oscillators to gauge the overall health and participation across the market when making investment decisions.
Look at the advance/decline line.
Investors use the advance/decline ratio, for instance. This divides the advancing issues into the declining issues. An advance/decline ratio above 1 indicates more stocks rose than fell for that period. Readings above 2 or 3 suggest bullish enthusiasm. Meanwhile, a ratio below 1 shows more decliners, reflecting bearish breadth. Track how the ratio changes over time to spot shifts.
How to use Market Breadth in Technical Analysis?
Market breadth is a technical analysis method of analyzing the stock market.
Is it hard to use Market Breadth?
No, it is not hard to use market breadth in stock market analysis. Market breadth metrics are easy to calculate. The main indicators like advance/decline line, advance/decline ratio, new highs/lows, and McClellan Oscillator have simple formulas that are not complex or computationally intensive. The data inputs of advancing/declining issues or volume are also readily available.
Is Market Breadth an effective indicator for analyzing the Market/Index?
Yes, market breadth is an extremely effective indicator for analyzing the overall stock market and major indexes. Market breadth gauges the health of market internals. The advance/decline data and new highs/lows show the number of stocks participating in the move. Strong participation confirms the sustainability and broad conviction behind trends. Weak participation diverges and puts the trend at risk.
What are the other Market Breadth Indicators?
Commonly used market breadth indicators are the McClellan Oscillator, Summation Index, Breadth Thrust, Tick Index, TRIN, Put/Call Ratio, Percent of Stocks Above Moving Averages, New Highs/Lows, and Up/Down Volume compare advancing/declining stocks.
1.McClellan Oscillator
The McClellan Oscillator analyses the difference between two exponential moving averages of the daily net advances and declines. It fluctuates above and below zero to indicate overbought and oversold conditions. Positive readings show breadth momentum favoring advancers, while negative readings indicate decliners are dominant.
2. McClellan Summation Index
The McClellan Summation Index is a longer-term version of the McClellan Oscillator. It is a cumulative total of the daily McClellan Oscillator values. It helps identify major turning points, overbought/oversold conditions, and overall trends in market breadth. Divergences between the Summation Index and major indexes signal major market shifts.
3. Breadth Thrust Indicator
The Breadth Thrust Indicator looks at advancing and declining volume over a four-day period. It signals a potential continuation of the trend when at least 80-90% of volume comes from advancing stocks for two consecutive days. Strong thrusts indicate broad momentum.
4. Tick Index
The Tick Index tracks the number of stocks trading on an uptick versus a downtick in a given minute. It provides useful intraday insight into market strength and sentiment. High positive tick readings indicate strong intraday momentum, while very negative ticks signal intraday weakness.
5. TRIN Index
Also known as the ARMS Index, TRIN compares advancing/declining stocks with their respective volumes. Readings above 1.0 indicate more volume in declining stocks and bearish sentiment. Readings below 1.0 reflect more volume in advancing stocks and bullish sentiment.
6. Equity Put/Call Ratio
This ratio measures trading volume in equity put options relative to call options. High put/call ratios indicate negative sentiment and bearish outlooks. Low put/call ratios signal positive sentiment and bullish demand.
7. Major Market Index
The percentage of stocks above their 200-day moving average. Readings above 70% indicate broad participation and a bullish environment. Readings below 30% reflect weak participation and bearish conditions.
8. 52-week Highs/Lows Ratio
This ratio divides the number of stocks hitting 52-week highs by those hitting 52-week lows. Higher readings reflect bullish breadth and sentiment, while lower readings indicate bearish sentiment. Divergences are able to signal shifts.
9. Percentage of Stocks Above 50-day MA
Measures the percentage of stocks whose price is higher than the 50-day moving average. Higher percentages reflect strong breadth and participation. Lower percentages indicate weakening momentum.
10. Bullish Percent Index
Shows the percentage of stocks exhibiting bullish Point & Figure chart patterns. Higher readings reflect bullish sentiment, while lower readings indicate bearish sentiment and are able to be applied to various indexes.
11. NYSE Up Volume/Down Volume
The ratio of advancing volume to declining volume on the NYSE. Readings above 1.0 reflect more volume in advancing stocks, while readings below 1.0 indicate more volume in decliners. Gauges bullish/bearish breadth.
These versatile indicators aid in identifying overbought/oversold conditions, market tops/bottoms, risk appetite, and potential shifts. Breadth is a critical complement to analyzing indexes and sectors.
What is the difference between Market Breadth and Market Depth?
Market breadth refers to how many stocks are participating in a market move, while market depth refers to the number of buy and sell orders at different prices for a given stock.
Market breadth refers to the number of securities advancing versus the number declining in a particular market, usually a stock exchange like the National Stock Exchange of India. Breadth statistics measure the overall health and directional movement of a securities market. Common market breadth metrics include the Advance/Decline line, Advance/Decline Ratio, the number of new 52-week highs/lows, the Arms Index, and the McClellan Oscillator.
By analyzing the number of stocks rising and falling, market breadth helps traders understand if the market is strong or weak if the trend is up or down, and if the market is overbought or oversold. Breadth indicators also find divergences between price and internal momentum. This sometimes occurs when major indexes show bullish price action, but breadth indicators turn bearish, signaling potential weakness ahead. Traders use market breadth to gauge if a trend is broad-based and has widespread participation or if the trend is being propelled by a relatively small number of stocks. In essence, market breadth focuses on the overall market’s internal health and strength by analyzing the performance of a wide swath of securities. It aims to measure the scope and sustainability of a trend or reversal.


 Previous Article


![15 Investing.com Alternatives [Free+Paid] You Should Use in 2026](https://www.strike.money/wp-content/uploads/2026/04/Investing.com-Alternatives.jpg "15 Investing.com Alternatives [Free+Paid] You Should Use in 2026 16")
![15 TradeStation Alternatives [Free+Paid] You Should Use in 2026](https://www.strike.money/wp-content/uploads/2026/04/TradeStation-Alternatives.jpg "15 TradeStation Alternatives [Free+Paid] You Should Use in 2026 17")
![15 Chartink Alternatives [Free+Paid] You Should Use in 2026](https://www.strike.money/wp-content/uploads/2026/04/Chartlink-Alternatives.jpg "15 Chartink Alternatives [Free+Paid] You Should Use in 2026 18")
: Overview, 10 Types of Indicators, Settings for Different Markets 20")

 : Definition, Formula, calculation, Uses, Advantages Vs limitations 22")


No Comments Yet.