Top Insurance Stocks to Invest in Jun, 2026
Insurance stocks offer long-term investment potential due to the growing demand for financial protection and risk management. Insurance stocks can benefit from factors such as rising disposable incomes, increasing awareness about insurance, and favorable government policies.
| Stock Name | Share Price | Change % | Buy/Sell | Dow Trend | Volume | 52 Week Range | 1M Return | 3M Return | 6M Return | 1Y Return |
|---|---|---|---|---|---|---|---|---|---|---|
| LICI | 399.35 6.15 | 1.56% | 20,44,734 | 360.75 490.00 | 2.30% | 0.26% | -7.94% | -15.37% | ||
| CANHLIFE | 138.68 -0.65 | -0.47% | 3,05,328 | 106.00 159.00 | 1.74% | -4.93% | 13.82% | - | ||
| STARHEALTH | 519.60 -0.35 | -0.07% | 6,00,719 | 412.60 586.25 | 1.64% | 12.39% | 11.84% | 14.11% | ||
| NIVABUPA | 83.96 0.99 | 1.19% | 7,88,362 | 67.50 92.90 | 0.24% | 19.84% | 11.38% | 2.14% | ||
| GICRE | 379.25 8.85 | 2.39% | 2,22,257 | 350.25 417.95 | -0.82% | 2.69% | -0.81% | -3.76% | ||
| GODIGIT | 301.05 4.45 | 1.50% | 3,06,906 | 290.80 381.40 | -2.64% | -12.61% | -11.97% | -11.57% | ||
| MEDIASSIST | 373.00 26.10 | 7.52% | 5,72,612 | 293.00 594.10 | -4.11% | 19.32% | -20.51% | -24.94% | ||
| NIACL | 152.80 5.87 | 4.00% | 6,37,119 | 116.97 214.74 | -4.28% | 10.81% | -11.12% | -20.16% | ||
| MFSL | 1,579.00 16.90 | 1.08% | 5,29,818 | 1433.60 1892.50 | -4.52% | -6.91% | -8.14% | 4.27% | ||
| ICICIGI | 1,695.70 -16.70 | -0.98% | 7,02,448 | 1629.50 2068.70 | -4.89% | -8.60% | -12.50% | -10.84% | ||
| SBILIFE | 1,706.00 -13.10 | -0.76% | 14,38,254 | 1700.40 2132.00 | -6.97% | -12.03% | -15.79% | -3.40% | ||
| HDFCLIFE | 555.35 10.10 | 1.85% | 29,66,637 | 543.00 820.75 | -7.72% | -13.99% | -28.57% | -26.39% | ||
| ICICIPRULI | 468.15 7.75 | 1.68% | 8,87,258 | 459.50 706.80 | -13.55% | -21.05% | -27.70% | -25.88% |

List of Top Insurance Stocks
1 . Life Insurance Corporation of India
Life Insurance Corporation of India is currently trading at ₹399.35. It has a daily trading volume of 20,44,734. Life Insurance Corporation of India touched a 52-week high of ₹490.00, while the 52-week low stands at ₹360.75. While Nifty delivered 1.04% return over the 1 year, Life Insurance Corporation of India underperformed with a -15.37% return.
2 . Canara HSBC Life Insurance Company Ltd.
Canara HSBC Life Insurance Company Ltd. is currently trading at ₹138.68. It has a daily trading volume of 3,05,328. Canara HSBC Life Insurance Company Ltd. touched a 52-week high of ₹159.00, while the 52-week low stands at ₹106.00. While Nifty delivered 1.04% return over the 1 year, Canara HSBC Life Insurance Company Ltd. outperformed with a 0.00% return.
3 . Star Health and Allied Insurance Company Ltd.
Star Health and Allied Insurance Company Ltd. is currently trading at ₹519.60. It has a daily trading volume of 6,00,719. Star Health and Allied Insurance Company Ltd. touched a 52-week high of ₹586.25, while the 52-week low stands at ₹412.60. While Nifty delivered 1.04% return over the 1 year, Star Health and Allied Insurance Company Ltd. outperformed with a 14.11% return.
4 . Niva Bupa Health Insurance Company Ltd.
Niva Bupa Health Insurance Company Ltd. is currently trading at ₹83.96. It has a daily trading volume of 7,88,362. Niva Bupa Health Insurance Company Ltd. touched a 52-week high of ₹92.90, while the 52-week low stands at ₹67.50. While Nifty delivered 1.04% return over the 1 year, Niva Bupa Health Insurance Company Ltd. outperformed with a 2.14% return.
5 . General Insurance Corporation of India
General Insurance Corporation of India is currently trading at ₹379.25. It has a daily trading volume of 2,22,257. General Insurance Corporation of India touched a 52-week high of ₹417.95, while the 52-week low stands at ₹350.25. While Nifty delivered 1.04% return over the 1 year, General Insurance Corporation of India outperformed with a -3.76% return.
6 . Go Digit General Insurance Ltd.
Go Digit General Insurance Ltd. is currently trading at ₹301.05. It has a daily trading volume of 3,06,906. Go Digit General Insurance Ltd. touched a 52-week high of ₹381.40, while the 52-week low stands at ₹290.80. While Nifty delivered 1.04% return over the 1 year, Go Digit General Insurance Ltd. underperformed with a -11.57% return.
7 . Medi Assist Healthcare Services Ltd.
Medi Assist Healthcare Services Ltd. is currently trading at ₹373.00. It has a daily trading volume of 5,72,612. Medi Assist Healthcare Services Ltd. touched a 52-week high of ₹594.10, while the 52-week low stands at ₹293.00. While Nifty delivered 1.04% return over the 1 year, Medi Assist Healthcare Services Ltd. underperformed with a -24.94% return.
8 . The New India Assurance Company Ltd.
The New India Assurance Company Ltd. is currently trading at ₹152.80. It has a daily trading volume of 6,37,119. The New India Assurance Company Ltd. touched a 52-week high of ₹214.74, while the 52-week low stands at ₹116.97. While Nifty delivered 1.04% return over the 1 year, The New India Assurance Company Ltd. underperformed with a -20.16% return.
9 . Max Financial Services Ltd.
Max Financial Services Ltd. is currently trading at ₹1,579.00. It has a daily trading volume of 5,29,818. Max Financial Services Ltd. touched a 52-week high of ₹1,892.50, while the 52-week low stands at ₹1,433.60. While Nifty delivered 1.04% return over the 1 year, Max Financial Services Ltd. outperformed with a 4.27% return.
10 . ICICI Lombard General Insurance Company Ltd.
ICICI Lombard General Insurance Company Ltd. is currently trading at ₹1,695.70. It has a daily trading volume of 7,02,448. ICICI Lombard General Insurance Company Ltd. touched a 52-week high of ₹2,068.70, while the 52-week low stands at ₹1,629.50. While Nifty delivered 1.04% return over the 1 year, ICICI Lombard General Insurance Company Ltd. underperformed with a -10.84% return.
| Companies | Return % |
|---|---|
| LICI | 2.30% |
| CANHLIFE | 1.74% |
| STARHEALTH | 1.64% |
| NIVABUPA | 0.24% |
| GICRE | -0.82% |
Upgrade Your Toolkit
Access powerful tools for smarter, data-driven stock analysis.
Why Should You Invest in Insurance Stocks?
You should invest in insurance stocks because they offer stability, consistent dividends, and significant growth potential in an underpenetrated market. The insurance sector is inherently resilient, as it thrives on steady premium collections, making it less vulnerable to economic downturns. In India, the sector has shown remarkable growth, with gross written premiums exceeding $130 billion and an 11% CAGR from FY2020 to FY2023.
Non-life insurers alone posted a 27.5% year-on-year premium growth in October 2024, driven by health and motor insurance segments.
Insurance companies are known for their consistent dividend payouts, offering investors reliable income streams. For instance, General Insurance Corporation of India boasts a high dividend yield of 2.11%. Additionally, the industry’s recession-proof nature ensures that demand remains stable even during economic slowdowns, as insurance is a necessity for individuals and businesses alike.
Moreover, the sector is undergoing rapid technological transformation and regulatory support, enhancing its long-term growth potential. With private insurers gaining market share and innovations like digital platforms simplifying customer journeys, the Indian insurance industry is poised for sustained expansion. For investors seeking stability amidst market volatility, insurance stocks offer a unique blend of defensive characteristics and growth opportunities.
What Factors Affect Insurance Stock Prices?
The stock prices of insurance companies are influenced by critical factors, reflecting their financial health, market positioning, and adaptability to external conditions. Key determinants include the below.
- Financial Strength and Solvency Ratio: The solvency ratio is a vital indicator of an insurer’s ability to meet long-term liabilities. A higher ratio signifies robust financial health and reassures investors about the company’s capacity to pay claims. For example, Bajaj Allianz Life Insurance had the highest solvency ratio of 5.16% in March 2023, compared to LIC’s 1.87%, showcasing stronger financial stability.
- Dividend History and Yield: A consistent dividend yield reflects a company’s profitability and commitment to shareholder returns. Insurers like General Insurance Corporation of India offer a high dividend yield of 2.11%, making them attractive for income-focused investors. However, dividend policies can also impact stock prices; for instance, restrictions during economic crises may lead to temporary price drops.
- Market Capitalization (Market Cap): The size of an insurer—whether large-cap or mid-cap—affects its stock stability and growth potential. Large-cap insurers like LIC (₹6,31,962 crore market cap) often provide stable returns, while mid-cap insurers may offer higher growth but with increased risk.
- Business Model and Product Range: Companies with diversified offerings across life, health, and general insurance are better positioned to withstand market fluctuations. This diversification enhances resilience and revenue streams.
- Industry Trends and Regulatory Compliance: Adherence to evolving regulatory compliance standards ensures operational stability. Regulatory bodies like IRDAI mandate a minimum solvency ratio of 1.5, which all Indian insurers currently meet. Additionally, trends such as digital transformation and insurtech adoption strengthen market competitiveness.
Together, these factors shape investor confidence and drive the valuation of insurance stocks in the equity markets.
What are the Top Insurance Companies of India?
Below is the list of the ten best life insurance, general insurance, and health insurance sector.
Life Insurance Stocks
| Company | Solvency Ratio | Claim Settlement Ratio (CSR) | Annual Premiums (₹ Crores) |
| LIC of India | 1.8 | 98.74% | 4,74,668.14 |
| Max Life Insurance | 2.0 | 99.34% | 25,341.91 |
| HDFC Life Insurance | 1.9 | 98.66% | 57,533.42 |
| ICICI Prudential Life Insurance | 2.0 | 97.82% | 39,932.78 |
| Kotak Mahindra Life Insurance | 2.6 | 98.82% | 15,320.46 |
| Aditya Birla Life Insurance | 1.9 | 98.07% | 15,069.69 |
| Tata AIA Life Insurance | 1.9 | 98.53% | 20,503.50 |
| SBI Life Insurance | 2.1 | 97.05% | 67,315.60 |
| Bajaj Allianz Life Insurance | 6.1 | 99.02% | 19,461.43 |
| PNB MetLife Life Insurance | 1.9 | 97.33% | 8,785.21 |
General Insurance Stocks
| Company | Solvency Ratio | Incurred Claim Ratio (%) | Network Hospitals |
| ICICI Lombard General Insurance | 2.51 | 77.33 | 7,500+ |
| New India Assurance Co. Ltd | 1.82 | 103.33 | 2,055+ |
| United India Insurance Co. Ltd | 0.15 | 89.57 | 6,500+ |
| National Insurance Co. Ltd | 0.16 | 102.35 | 3,000+ |
| Bajaj Allianz General Insurance | 3.68 | 74.27 | 11,000+ |
| Go Digit General Insurance | 1.96 | 71.87 | 16,400+ |
| HDFC ERGO General Insurance | 1.75 | 79.04 | 12,000+ |
| Tata AIG General Insurance | 3.9 | 78.33 | 10,000+ |
| Cholamandalam MS General Insurance | 2.07 | 67.88 | 10,000+ |
| Acko General Insurance Co | 4.26 | 83.88 | 14,300+ |
Top Health Insurance Stocks in India
| Company Name | Claim Settlement Ratio (CSR) | Solvency Ratio | Network Hospitals | Incurred Claim Ratio (%) |
| Star Health & Allied Insurance | 99.21% | 2.14 | 14,000+ | 65 |
| Care Health Insurance | 100% | 1.82 | 11,400+ | 53.82 |
| Niva Bupa Health Insurance | 100% | 1.67 | 10,000+ | 54.05 |
| HDFC ERGO Health Insurance | 98.59% | 1.81 | 12,000+ | 79.04 |
| ICICI Lombard Health Insurance | 98.53% | 2.5 | 7,500+ | 77.33 |
| Aditya Birla Health Insurance | 99.01% | 2.63 | 11,000+ | 64.48 |
| ManipalCigna Health Insurance | 99.96% | 1.56 | 8,700+ | 64.66 |
| TATA AIG Health Insurance | 95.46% | 3.9 | 10,000+ | 78.33 |
| Acko General Insurance | 97.68% | 4.26 | 14,500+ | 83.88 |
These top companies have continuously shown strong growth and created stock holder value.
What are the Key Metrics to Track Insurance Stocks?
Tracking the right metrics is essential for evaluating the performance and potential of insurance stocks. Here are the key indicators.
- Premium Revenue Growth: This measures the year-over-year increase in revenue from premiums, reflecting an insurer’s ability to attract new customers and retain existing ones. A steady rise in premium revenue indicates market competitiveness and strong demand for products.
- Claims Settlement Ratio: This metric assesses the efficiency of an insurance company in settling claims. A higher ratio reflects customer trust and operational effectiveness, while a lower ratio may indicate delays or inefficiencies that could harm reputation and profitability.
- Return on Equity (ROE): ROE is a critical measure of an insurer’s financial performance, showing how effectively it generates profit from shareholders’ equity. An ROE above 10% is generally considered healthy, with mid-teen percentages being ideal for well-run companies.
- Investment Income: Insurance companies invest premium funds in financial markets to generate additional income. Strong investment performance can significantly boost profitability, especially during periods of low claims payouts.
- Debt-to-Equity Ratio: This evaluates financial stability by comparing total liabilities to shareholder equity. A lower debt-to-equity ratio indicates a more stable financial structure, while higher ratios may signal increased risk but could also amplify returns if managed effectively.
- Market Valuation Metrics: Price-to-Book (P/B) ratio and other valuation measures help assess whether an insurance stock is overvalued or undervalued compared to its peers. A P/B ratio near 1 is considered favorable, while values above 2 may indicate overpricing.
Focusing on these metrics—premium revenue, claims settlement, ROE, and market valuation— helps investors make informed decisions about the financial health, growth potential, and risk profile of insurance stocks.
How to Analyze Stocks Sector Stocks Before Investing
To choose the best insurance stocks, we will analyse fundamental and technical parameters and data using strike.money.
The first step before choosing the best insurance stocks is to analyze the technical parameters of insurance stocks like HDFCLIFE Ltd and its peers or competitors functioning in the insurance sector.
We will go through 8 data points on a weekly time frame and study the readings of 20 MA, 50 MA, RSI, stochastics, ADX, Rohit Momentum Indicator (RMI) and Dow Trend.
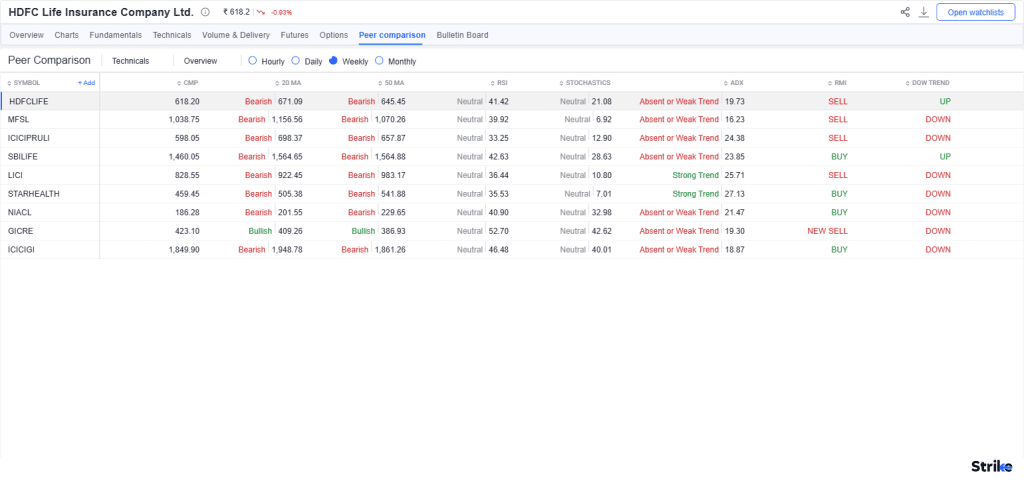
While studying the technical parameters of the insurance stocks on a weekly time frame, it is studied that Starhealth Ltd is one of the few stocks that has maintained a ‘strong trend’ reading on the ADX indicator.
While RSI and stochastic indicators, which are momentum oscillators, also suggest neutral characteristics. Starhealth Ltd. is one of the stocks which is showing ‘Buy’ readings on the RMI indicator and the price on the technical chart is also around the lowest levels because of which the moving averages are showing baearish trend, which could eventually change if the stock undergoes trend reversal towards upside.
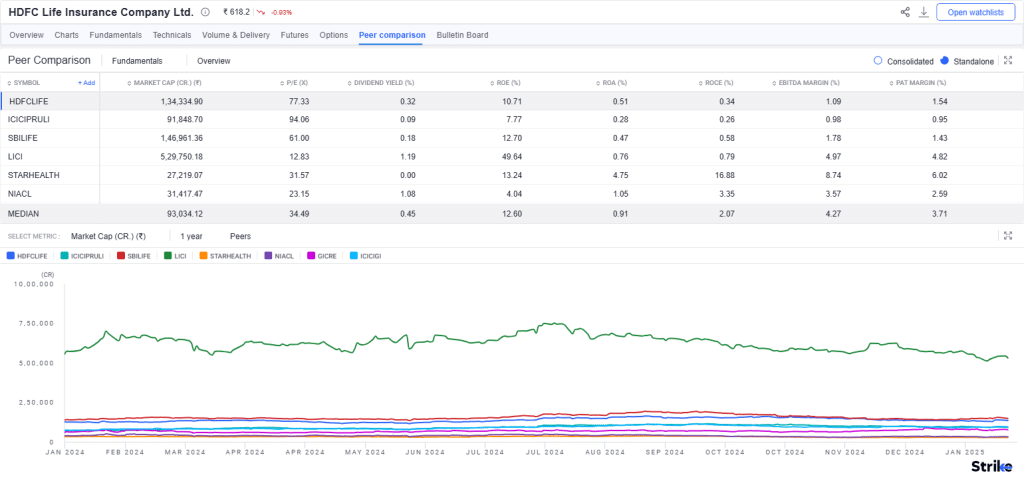
The second step before selecting an Insurance Stock is to analyze the fundamental data points of these stocks.
ITC, its peers and the overview of their major fundamental data points like Market Cap, PE Ratio, Dividend Yield (%), ROE (%) , ROA (%), EBITDA Margin (%) and PAT Margin (%) are studied.
Study the image above; choosing StarHealth Ltd from the technical comparison;
The data points of Starhealth are interesting.The Return on Assets (ROA %) stands at 4.75% which is highest in the category. EBITDA Margin stands around 8.74% which is also the highest figures in the category. The PAT Margin % is 6.02% which is leading amongst the peers in the Insurance Sector.
The ROCE % (Return on Capital Employed) is staggering 16.88% which is really positive amongst the peers.
Aligning the findings from fundamental and technical comparison; Starhealth is fitting the criteria to become a pick.
This is how investors can use strike to select, analyse and compare Insurance Sector Stocks with precision and various useful tools to select the appropriate stock.
What are the Advantages of Investing in Insurance Sector Stock?
The main advantage of investing in insurance sector stock is that the sector demonstrates economic resilience, with steady demand for insurance products even during downturns, protecting investments from severe market fluctuations.
Insurance companies generate consistent premium revenue and often provide dividends, offering reliable income streams alongside capital appreciation.
Insurance stocks are considered defensive investments, helping diversify portfolios by reducing overall risk due to their low correlation with volatile sectors.
The sector benefits from a strong regulatory framework, ensuring claims settlement reliability and operational stability, which enhances investor confidence and long-term profitability.
What are the Risks of Investing in Insurance Sector Stocks?
The main risk of investing in insurance sector stocks is economic uncertainties such as interest rate fluctuations, inflation, and global market volatility can significantly impact insurers’ investment returns and market valuation, leading to reduced profitability.
Second, regulatory compliance challenges, including evolving legal frameworks and stricter scrutiny, can increase operational costs and create uncertainty for investors.
Risks like data breaches, cyberattacks, and mis-selling practices can result in reputational damage, financial losses, and lower consumer trust, further affecting the performance of insurance stocks.
The Best Trading App Forever
Maximise your potential investment with our all-in-one tool
Start Your 7-Day Free Trial
