Return on Equity, also known as ROE, is a key financial ratio that measures how efficiently a company is generating profits from its shareholders’ Equity. ROE indicates how well a company uses investments from its shareholders to produce profits. It is calculated by dividing net income by shareholders’ Equity and helps investors analyze a company’s profitability and compare it to its peers.
ROE is an important metric for investors to analyze as it shows how effectively the company is utilizing shareholder capital and generating returns. A higher ROE suggests a more efficient use of equity financing to generate profits.
The article will explore ROE in depth – what it is, how it is calculated, how DuPont analysis provides additional insights, limitations of relying solely on ROE, how ROE can be used to evaluate companies and stocks, and key factors that influence a company’s ROE. The article analyzes ROE from different perspectives to give readers a comprehensive understanding of this important financial ratio.
What is the return on Equity (ROE)?
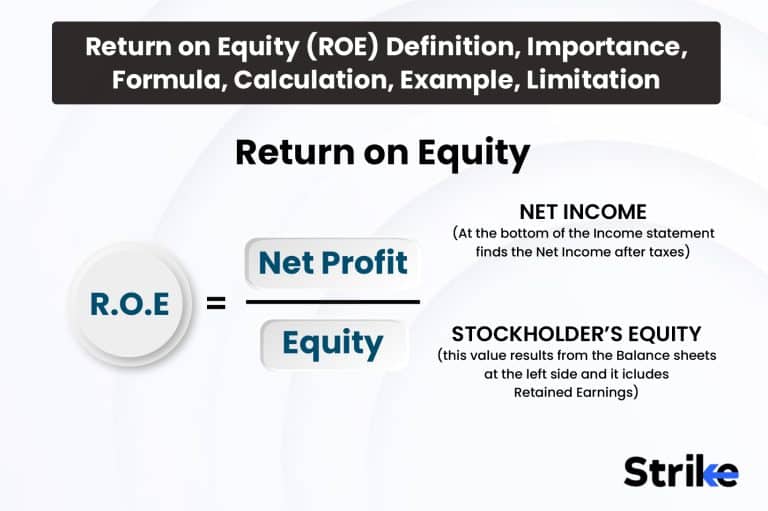
Return on Equity (ROE) is a measure of financial performance calculated by dividing net income by shareholders’ Equity. ROE tells investors how effectively a company is using its capital to generate profits and is expressed as a percentage. A higher ROE indicates a company is generating more profits from its shareholders’ investments.
There are factors that influence a company’s ROE, such as profit margin, asset turnover, financial leverage, and tax burden. Profit Margin measures how much net profit a company generates for each rupee of revenue. A higher profit margin leads to a higher ROE if other factors are constant. Companies with pricing power and low costs tend to have high margins. Asset Turnover evaluates how efficiently a firm uses its assets to produce revenue. Companies that generate more revenue from existing assets have higher asset turnover. High turnover and margins boost ROE.
Why is ROE important?
Return on Equity is an important metric for investors to evaluate a company’s financial vitality, internal growth capacity, peer profitability comparison, and management efficiency in utilizing capital to produce income. ROE shows how effectively a company generates income from shareholders’ investments, demonstrating financial strength and efficient use of capital to make profits. Higher ROE indicates a greater ability to reward shareholders through growth and dividends.
ROE reveals how much profit a company produces from internal resources. High ROE enables faster growth without needing external financing. Investors use ROE to estimate future earnings growth capacity based on reinvested profits.ROE allows comparison between companies in the same industry. Since capital structure differs between sectors, investors use ROE to compare banks to banks, retailers to retailers, etc. ROE shows which firms generate more profits per rupee invested within a sector.
A rising ROE indicates a company is becoming more efficient at using capital to generate income. Management teams that improve margins, asset turnover, or leverage drive ROE higher. Tracking ROE over time shows improvement or worsening in internal operations. Return on Equity provides a vital look into a company’s profit engine relative to shareholder equity. Investors examine ROE trends over time and against industry averages to identify well-run businesses.
What is the formula for ROE?
The formula for return on Equity (ROE) is net income divided by shareholders’ Equity, which shows a company’s profitability and efficiency in generating profits from shareholders’ invested capital in the context of stock market analysis.
The formula for calculating return on Equity (ROE) is as stated below.
ROE = Net Income / Shareholders’ Equity
Here, Net Income is the total net profit earned by a company during a specific time period after accounting for all expenses, taxes, and other charges. This metric comes directly from the company’s income statement.
Shareholders’ Equity refers to the amount of assets attributable to a company’s shareholders. Also known as stockholders’ Equity, it represents the value of all shares outstanding plus retained earnings. Shareholders’ Equity is found on the balance sheet.
By dividing net income by shareholders’ Equity, ROE shows how much profit is generated for each rupee of equity capital invested by shareholders. It measures management’s ability to efficiently convert shareholder investments into net profit.
How does DuPont analysis help analyze ROE?
DuPont analysis breaks down Return on Equity (ROE) into component ratios like net profit margin, asset turnover ratio, and financial leverage to provide insights into what’s driving changes in a company’s ROE over time.
Net profit margin measures how much net income a company generates per rupee of sales. Asset turnover measures how efficiently a company uses its assets to generate sales. The equity multiplier measures financial leverage, or how much debt a company uses to finance its assets. Multiplying these three ratios together results in a company’s ROE. DuPont analysis enhances the interpretation of ROE for stock analysis.
Looking at these three components individually provides greater insight into a company’s operations and capital structure. For example, a high net profit margin indicates the company is good at controlling costs and generating profits from its sales. However, a low asset turnover ratio suggests inefficiencies in asset utilization. The equity multiplier reflects the use of financial leverage – a high ratio indicates a company is funding growth with debt, which amplifies returns but also increases financial risk.
DuPont’s breakdown reveals a company’s strengths and weaknesses in profitability, operating efficiency, and use of financial leverage – key factors that drive stock returns. It allows easier comparison between companies in the same industry by isolating the effects of capital structure. For example, Company A and Company B have similar ROEs, but DuPont analysis could show that Company A has a higher net profit margin but a lower equity multiplier, while Company B has a lower margin but higher financial leverage. This provides stock analysts with a more nuanced view of each company’s financial health.
How to calculate ROE?
ROE is calculated by dividing net income by average shareholders’ Equity. Net income is the bottom-line profit on the income statement after all expenses and taxes. Shareholders’ Equity represents assets minus liabilities – essentially the amount invested by shareholders along with retained profits. The formula is as stated below.
ROE = Net Income / Average Shareholders’ Equity
The denominator is based on average Equity over the year rather than point-in-time Equity to account for capital changes over the year. A higher ROE indicates a greater ability to generate profits from invested capital.
ROE is a measure of a company’s profitability that is sometimes used to compare them while assessing equities. It also shows how well management is able to allocate resources. Generally, stocks with higher ROEs warrant higher valuations like price-to-earnings multiples. Comparing ROEs over time or against industry peers gives context for interpreting the ratio. A sustainable ROE above 15% is considered good by market standards.
However, ROE alone has limitations in stock analysis. A distortedly high ROE could result from excessive financial leverage rather than core operating efficiency. Comparing ROE to net profit margin provides a perspective on profitability from actual business activities versus financial engineering. Also, capital-intensive industries like manufacturing tend to have lower ROEs than service businesses, making peer comparisons essential.
DuPont analysis provides deeper insight into the drivers of a company’s ROE. The DuPont formula is as stated below.
ROE = (Net Income/Revenue) x (Revenue/Assets) x (Assets/Equity)
Where net profit margin measures profitability on sales, asset turnover reflects productivity of assets, and equity multiplier shows financial leverage.
Breaking down ROE into these elements through DuPont analysis allows stock investors to pinpoint a company’s strengths. For example, a high ROE sometimes stems from an exceptionally high net margin, indicating strong cost controls and pricing power. Or it is sometimes driven by asset turnover, suggesting efficient utilization of property, plants, and equipment to generate sales. The equity multiplier also impacts ROE – a higher ratio implies greater use of debt financing, which magnifies returns but also increases risk.
Conducting DuPont analysis facilitates comparison of the drivers of profitability across different stocks. For example, Company A and Company B both have ROEs of 25%. But DuPont’s breakdown could reveal Company A’s ROE is driven by a high equity multiplier of 2.0x stemming from aggressive debt financing, while Company B’s ROE comes from a strong net profit margin of 15% due to operational efficiency. This provides a crucial perspective for investment decision-making.
What is an example of ROE?
Let’s take the hypothetical company “ABC Ltd.,” based in India, with the following financial figures.
Net Income (Profit after Tax): ₹500 crores
Shareholders’ Equity: ₹2,500 crores
To calculate the ROE, we’ll use the formula:
ROE = Net Income / Shareholders’ Equity
Plugging in the numbers:
ROE = ₹500 crores / ₹2,500 crores
ROE = 0.20
To express ROE as a percentage, we multiply by 100:
ROE = 20%
Interpretation:
This means that for every ₹1 of shareholders’ Equity, ABC Ltd. generated ₹0.20 in net income.
An ROE of 20% is generally considered good, indicating that the company is using its shareholders’ investments effectively to generate profits.
How does a stock’s performance depend on ROE?
The performance of a stock tends to improve when the company has a higher return on Equity, as this metric shows the firm is proficiently utilizing shareholders’ invested capital to produce profits. A stock’s return on equity ratio offers limited insight into performance without holistic analysis of debt levels, earnings per share growth, return on capital, and other indicators that determine if high profits are sustainable or stem from financial engineering.
Stocks of companies with higher ROEs tend to outperform the broader market. This is because a high and rising ROE signals that the company is efficiently compounding capital and generating growth in profits. As profits grow, the company has more capital to reinvest back into the business to drive further growth. Rising profits also allow the company to return more cash to shareholders via dividends and buybacks.
For growth-oriented companies, investors tend to favor higher ROEs as this indicates earnings compound at a faster rate without requiring additional equity financing. Younger companies often have higher ROEs as they are in growth mode and have lower equity bases. Mature companies with high ROEs demonstrate an ability to continue growing earnings efficiently despite their larger size.
How do we compare the ROE of a company with its peers?
To make an apples-to-apples comparison of a company’s profitability against peer firms in the equities market, juxtapose its return on equity ratio, computed as net income divided by shareholders’ Equity, with the analogous ROE metrics of rival companies over identical periods. Each industry has different characteristics that impact average profitability and ROE. For example, large manufacturers tend to have capital-intensive operations and lower ROE. High-growth technology companies often have higher ROEs due to lower capital requirements.
Given these structural factors, an ROE of 15% could be below average in one industry but above average in another. Therefore, investors should compare a company’s ROE to its direct competitors and overall industry averages to gauge if it is generating outlier returns. Sources for industry benchmark ROE data include the company’s annual report, industry research reports, and financial websites. Assessing the company’s position in relation to peers and placing it in the top, medium, or bottom quartile is important. Outlier high ROE compared to competitors indicates a potential competitive advantage in operational efficiency or growth prospects. Anyone can compare the ROE of a company with its peers on Strike.
What is a good ROE?
A company with a good ROE consistently generates net income higher than industry averages through business cycles via an efficient asset-light model, disciplined management, and sustainable high-quality earnings sources that enable steady reinvestment for growth without sacrificing margins.
ROE varies significantly across industries, so the first step is comparing a company’s ROE to its industry peers. Capital-intensive sectors like manufacturing, transportation, and energy require large investments in property, plants, and equipment, resulting in lower ROE, typically 15-20%. Meanwhile, technology and financial services firms have far lower capital needs, enabling ROE above 20% in strong years.
What does a positive ROE indicate?
A positive return on Equity indicates that a company is efficiently using shareholders’ capital to generate profits in the stock market. A positive ROE is a favorable sign that shows a company taking its shareholders’ invested capital and generating strong returns. The higher the ROE, the greater the profits the company earns relative to shareholder equity. A consistently positive ROE points towards five important strengths such as efficient operations, prudent financial leverage, asset turnover, able capital allocation, and strong market positioning.
What does a negative ROE indicate?
A negative return on Equity (ROE) indicates that a company is not generating a profit from its shareholders’ investments. A negative ROE suggests poor management of capital and indicates the company is not utilizing shareholders’ funds effectively to drive growth. There are five main reasons why a company has a negative ROE, such as operating losses, high debt levels, overvalued assets, poor capital allocation, and deteriorating competitiveness.
The most common reason behind a negative ROE is that the company is facing operating losses over a period of time. Persistent operating losses eat into shareholders’ Equity and eventually lead to an ROE dipping into the negative territory. Operating losses stem from the company’s inability to generate revenues greater than its operating costs and expenses. Prolonged operating losses result in shareholder equity reduction and turn the ROE negative. For investors, it is a major red flag as it shows the company’s core operations are not profitable.
What can be the reason for the ROE increase?
ROE increases due to higher profit margins, optimal leverage, improved asset turnover, strengthened market position, accretive acquisitions, economies of scale, and cyclical upswings. The most straightforward driver of ROE growth is expansion in operating profit margins. This indicates the company is either growing revenues faster than expenses, controlling costs better, or enjoying a mix of both effects. Widening operating margins boost overall net income earned on the same amount of shareholder capital. Thus, net income growth outpaces equity growth, increasing the ROE ratio. For stock investors, margin-led ROE increase reflects core business efficiencies.
What are the high ROE stocks of the stock market?
A high ROE in the stock market indicates that the company is generating substantial profits from relatively little shareholder investment. In the stock market, equities exhibiting superior profitability relative to capital invested, as quantified by elevated return on equity ratios, are prized by discerning investors. These investors are seeking corporations adept at generating shareholder value from internal operations rather than relying on external financing or accounting machinations. This focus on ROE is a critical aspect of evaluating a company’s performance and potential for growth within the stock market.
What are the limitations of ROE?
Though widely used to evaluate profitability, return on Equity has limitations as a standalone metric for stock analysis since it does not account for factors like capital intensity, asset utilization, growth prospects, and accounting policies.
ROE is a backward-looking metric that shows how profitable a company was in the past. A high ROE does not necessarily mean that a company will be highly profitable in the future. Industry dynamics, competition, regulations, management changes, and other factors could negatively impact future returns even if past ROE was high. Investors should complement the analysis of past ROE with forward-looking assessments of a company’s competitive position, growth opportunities, and risk factors that affect future profitability.
ROE ignores how much financial leverage or debt a company uses. A company sometimes artificially inflates ROE by taking on excessive debt. This increases the amount of Equity against which profits are compared even if overall net income does not rise proportionately. Two companies with similar net incomes will show very different ROEs if one utilizes far more debt financing than the other. Investors must make sure they are comparing “apples to apples” and take debt-to-equity ratios into account when comparing equities using ROE.
ROE overlooks capital intensity and asset turnover. Companies in capital-intensive industries like manufacturing, telecom, or oil & gas require large investments in plants, equipment, and other fixed assets to generate profits. They tend to have lower ROE than those in less capital-intensive industries like consulting or software services, even though both have similar profit margins. ROE also does not account for how efficiently a company uses assets to generate sales. A retailer with skinny margins but fast inventory turnover has a higher ROE than a manufacturer with fatter margins but slower turnover. Investors should factor in capital intensity and asset turnover ratios when interpreting ROE across diverse industries.
There are accounting limitations to ROE. It is calculated using net income from the income statement and shareholders’ Equity from the balance sheet. However, accounting rules offer flexibility in how income and Equity are measured. Choices like LIFO vs FIFO inventory costing, depreciation methods, treatment of intangibles, etc., affect both income and book value of Equity, thereby impacting ROE. Unless accounting policies are standardized, ROE does not facilitate an ‘apples to apples’ comparison and could be manipulated by accounting policy choices. Investors should scrutinize the footnotes to account for controversial accounting treatments that could inflate ROE.
ROE is distorted by changes in capital structure. Events like equity issuances, buybacks, and dividends alter shareholders’ Equity, thereby impacting ROE even if a company’s core profitability is unaffected. For example, a company shows an artificially high ROE in a year when it has not issued new shares or repurchased stock but a lower ROE the following year after raising new capital despite having similar net income. Investors should look at profitability metrics like return on assets (ROA) or return on invested capital (ROIC) to filter out such capital structure effects.
There are businesses where ROE is less relevant. For example, high-growth companies often have low ROE because they intentionally sacrifice short-term returns to invest heavily in the future. Young technology, biotech, or internet companies with negative earnings also have meaningless ROE. Additionally, the DuPont formula shows that ROE is determined by profit margin, asset turnover ratio, and financial leverage ratio. However, firms like investment holding companies generate returns differently through portfolio appreciation rather than asset utilization.
What is the difference between ROE & ROCE?
Return on Equity (ROE) measures a company’s net income returned as a percentage of shareholders’ Equity, while return on capital employed (ROCE) measures a company’s earnings before interest and taxes (EBIT) returned as a percentage of the capital employed in the business, and both are used by investors to evaluate a stock’s profitability.
ROE measures a company’s net income generated as a percentage of shareholders’ Equity. Equity refers to the funds invested by shareholders, including both common and preferred stock. ROE shows how well a company utilizes investments by shareholders to generate profits and growth. A higher ROE indicates a more efficient use of shareholder capital.
ROCE, on the other hand, measures a company’s earnings before interest and taxes (EBIT) as a percentage of capital employed. Capital employed refers to both Equity and debt capital invested in the company. It is calculated as shareholders’ equity plus long-term debt. So, ROCE considers capital from both shareholders and lenders and shows a company’s overall efficiency in using capital from both sources to generate operating profits.
The key difference between ROE and ROCE lies in the definition of capital used. ROE looks solely at returns from shareholder capital, while ROCE looks at returns from total capital, including debt. As such, ROE only reflects how well shareholders’ investments are rewarded, while ROCE shows returns to all capital providers, including creditors.
In analyzing financial stocks like banks, ROE and ROCE diverge significantly. Banks tend to utilize high financial leverage, funding operations with large amounts of debt. For banks, ROE will be much higher than ROCE since the former only measures returns against shareholder equity while the latter considers Equity plus debt. The high leverage amplifies returns to shareholders as measured by ROE.
For non-financial stocks, ROE and ROCE tend to converge since non-financials use less debt financing. For these companies, Equity makes up most of the capital employed, so returns against Equity or total capital are similar. However, even for non-financials, ROCE provides a more complete picture of capital efficiency as it includes debt financing.
ROE is more affected by financial leverage since it only considers shareholder equity. A company increases ROE by taking on more debt without actually improving operating efficiency. The debt amplifies returns to shareholders, but piles on too much leverage, and the risk of bankruptcy rises. ROCE, on the other hand, is relatively unaffected by leverage since it measures returns against total capital, including debt. As such, ROCE is generally a more reliable metric of core operating profitability.
However, ROE remains an important ratio because shareholders are mostly concerned with returns generated on their specific investments rather than total capital, including debt, which carries less risk. For shareholders assessing stock investments, ROE shows the rate of return flowing to their Equity, while ROCE shows returns to all capital. So, ROE and ROCE provide complementary perspectives.
Investors sometimes wish to take both ROE and ROCE into account when assessing equities. Comparing ROE to ROCE ratios shows how financial leverage impacts shareholder returns. Leverage is increasing returns to shareholders if ROE significantly outpaces ROCE, but it also suggests very high debt levels and financial risk. Investors should look for stocks with both high and steady ROE and ROCE rather than a widening gap, showing the companies generate returns from operating efficiency rather than artificial leverage.
What is the difference between ROE & ROA?
Return on Equity (ROE) measures the net income returned as a percentage of shareholders’ Equity, while return on assets (ROA) measures the net income returned as a percentage of total assets, and both ratios are utilized by stock market investors to gauge a company’s profitability relative to the required capital investment.
ROE specifically measures the net income returned as a percentage of shareholders’ Equity and shows how efficiently a company generates profit from every rupee of shareholders’ Equity. Equity represents the residual ownership funds invested by shareholders after accounting for all liabilities. As shareholders take on the highest risk by investing their capital, ROE reveals how well their investment is being rewarded. For stock investors, a higher ROE ratio is desirable as it means the company is efficiently using its capital to create profits.
On the other hand, ROA measures the net income returned as a percentage of total assets. Assets are all the economic resources controlled by the company, including both debt and equity financing. ROA thus shows how well a company utilizes what it controls to generate earnings. From an investor’s perspective, ROA indicates how capable the company’s assets are in producing profits. A higher ROA is preferred as it means the company’s assets are more productive in creating income.
While both measure profitability, ROE and ROA differ fundamentally in what they each compare net income to. ROE only considers shareholders’ Equity in the denominator, whereas ROA considers total assets which includes both Equity and debt. So, ROE focuses specifically on profit generated from shareholders’ funds, while ROA looks at profit generated from all invested capital, including borrowed funds.
This leads to key insights that stock investors should be aware of. For starters, ROE will always be higher than ROA for a company that uses debt alongside equity financing. This is because ROE only accounts for Equity in the denominator, which boosts the ratio. ROA, conversely, considers debt, so it will be lower for leveraged firms. Investors should keep this in mind when comparing firms with different debt levels.
Furthermore, a rising ROE along with a falling ROA signal that the company is taking on more financial leverage, i.e., debt financing. While this leverage amplifies ROE, it sometimes does not necessarily translate into higher shareholder returns if the borrowed capital is not used efficiently. So, investors should dig deeper to check if the rising ROE is due to smart leverage or just excessive borrowing. A similar trend for ROA indicates improving asset utilization.
The ratios also offer insight into management effectiveness. A rising ROA suggests management is using assets more efficiently to generate profits. However, an increasing ROE could mean management taking on greater financial risk rather than operating efficiency. To assess true managerial performance, investors need to consider both ratios together, along with debt levels and leverage.
How is ROE used in the fundamental analysis?
Fundamental analysts pay close attention to ROE for five reasons. ROE allows analysts to compare the profitability and efficiency of companies within the same industry. For example, analysts compare the ROEs of Apple and Microsoft to see which tech giant generates higher returns from shareholders’ investments. The higher the ROE, the better the company is at generating income from capital provided by shareholders.
ROE enables analysts to track changes in a company’s profitability over time. A company’s growing return on Equity (ROE) is a sign that management is successfully maximizing earnings from shareholders’ money. However, a declining ROE over the years is a red flag for fundamental analysts, signaling problems in how efficiently the company is deploying shareholders’ money.
ROE helps analysts evaluate whether a stock is under or overvalued. Stocks with high and growing ROEs are considered undervalued because they generate higher returns on shareholder capital. On the other hand, low or declining ROEs imply a stock is currently overpriced relative to its profit potential. Comparing a stock’s ROE to its industry average or competitors helps determine if its valuation aligns with its earning power.
ROE allows fundamental analysts to screen for stocks that meet their minimum investment criteria. Analysts look for stocks with ROEs above 15-20%, which signals a company with strong profitability. Stocks with very high ROEs of over 40% are extremely efficient at generating income from shareholder capital.
However, analysts must be careful when interpreting ROEs in isolation. A high ROE results from excessive debt rather than operational efficiency. Therefore, fundamental analysts also consider the company’s debt levels and compare the ROE to ROA (return on assets), which measures profitability without factoring in financial leverage.
Analysts also ensure the high ROE is sustainable by examining why it is high. ROE is broken down into three components: net profit margin, asset turnover ratio, and financial leverage multiplier. Analyzing these underlying drivers provides greater insight into the sources of the company’s profitability. For instance, a high ROE driven purely by financial leverage is seen as more risky than an ROE boosted by growing profit margins.
Furthermore, analysts, in the practice of fundamental analysis, account for variations in asset composition, capital structure, and accounting practices when comparing ROEs across businesses. Fundamental analysis involves adjusting the inputs to make the ratios more comparable. Analysts also calculate ROE using invested capital rather than just shareholders’ equity, a technique rooted in fundamental analysis, which provides a more complete picture of capital deployed. This approach ensures a more accurate and fair comparison of companies’ financial performance, highlighting the importance of fundamental analysis in financial assessment.
Is ROE an important financial ratio?
Yes, ROE (return on Equity) is an important financial ratio for investors to assess a company’s profitability and efficiency in generating profits from shareholders’ Equity.
The importance of ROE stems from the insight it provides into a company’s profitability and financial health. At a high level, ROE shows how well a company’s management is able to generate returns for shareholders using the capital provided. Investors want to put their money into companies that deliver strong returns, so ROE is a key metric to evaluate.
Specifically, ROE is calculated as net income divided by average shareholders’ Equity. Net income is the company’s bottom line profit after accounting for all revenues, expenses, taxes, and other charges. Shareholders’ Equity represents the amount invested by shareholders plus retained earnings. So, in simple terms, ROE tells you what percentage of profit a company earns on each rupee of shareholders’ investment.
Investors use ROE to compare the profitability and efficiency between companies, even across different industries. A higher ROE indicates a company is better at generating profits from its equity capital. However, ROE should not be looked at in isolation. It needs to be compared to competitors in the same industry and analyzed in relation to other important ratios.
For example, Company A has a ROE of 20% while Company B has a ROE of 15%. On the surface, Company A seems more profitable. However, assuming the industry average ROE for businesses is 25%, Company B is exceeding its peer group while Company A is falling behind. An intelligent stock investor would dig deeper to understand why.
ROE is also compared historically for the same company over time to spot trends. A declining ROE could signal problems like declining sales, increasing expenses, poor inventory management, or the inability to control costs. A rising ROE indicates the company is managing its operations and finances more efficiently over time.
While a higher ROE is generally better, investors should also look at the drivers of a company’s ROE to ascertain whether its profits are supported by sustainable factors. The Du Pont analysis breaks down ROE into three components – net profit margin, asset turnover ratio, and financial leverage.
Net profit margin shows the company’s profitability on each rupee of sales. Asset turnover rate measures how efficiently assets are used to generate sales. The financial leverage ratio indicates the role of debt financing. This provides color on how the company is achieving its ROE. For example, a high ROE driven purely by increasing financial leverage is riskier than a high ROE achieved through operating efficiency improvements.
For stocks, ROE also helps investors evaluate whether the share price correctly reflects the company’s value and earning potential. Comparing a stock’s ROE to its price-to-earnings (P/E) ratio is insightful. A stock with a high ROE but low P/E is sometimes undervalued, making it attractive for investment. Conversely, a stock with low ROE and high P/E is sometimes overpriced.
ROE, a crucial financial ratio, also plays an important role in dividend investing strategies. Companies with higher and stable ROEs, indicative of strong financial performance as reflected by this financial ratio, have a greater capacity for paying dividends. Investors looking for dividend stocks analyze ROE trends over time, using this key financial ratio to gauge the reliability of future dividend payments. This approach ensures that their investment choices are backed by a solid understanding of a company’s ability to sustain and possibly increase its dividend payouts.


 Previous Article


![15 Investing.com Alternatives [Free+Paid] You Should Use in 2026](https://www.strike.money/wp-content/uploads/2026/04/Investing.com-Alternatives.jpg "15 Investing.com Alternatives [Free+Paid] You Should Use in 2026 4")
![15 TradeStation Alternatives [Free+Paid] You Should Use in 2026](https://www.strike.money/wp-content/uploads/2026/04/TradeStation-Alternatives.jpg "15 TradeStation Alternatives [Free+Paid] You Should Use in 2026 5")
![15 Chartink Alternatives [Free+Paid] You Should Use in 2026](https://www.strike.money/wp-content/uploads/2026/04/Chartlink-Alternatives.jpg "15 Chartink Alternatives [Free+Paid] You Should Use in 2026 6")
: Overview, 10 Types of Indicators, Settings for Different Markets 7")


 : Definition, Formula, calculation, Uses, Advantages Vs limitations 10")


No Comments Yet.