The Klinger Oscillator was developed by Stephen Klinger in the 1960s as a volume oscillator to identify trends and potential reversals. Unlike traditional momentum oscillators, the Klinger Oscillator incorporates volume into the indicator to confirm price movements. The Klinger Oscillator measures the strength of volume flow over a 34-day exponential moving average (EMA) of volume, making it better at detecting major shifts in volume.
To calculate the Klinger Oscillator, the 34-day EMA of volume is subtracted from the current volume and then divided by the 34-day EMA. This creates an oscillator that fluctuates above and below a zero line. Positive readings indicate volume is higher than the EMA, suggesting increased buying pressure and an uptrend. Negative readings show volume is below the EMA, indicating increased selling pressure and a potential downtrend. Crossovers of the oscillator through the zero line from below or above gives indications regarding trend changes. foreshadows trend changes.
The main advantage of the Klinger Oscillator is its ability to identify intermediate and major trend changes more reliably compared to price-only indicators. Incorporating volume strengthens the signals, as significant increases or decreases in volume typically precede meaningful price movements. Traders analyze divergences between the oscillator and price action as well as monitor zero line crossovers for potential buy or sell entry opportunities. Combined with price charts, the Klinger Oscillator gives a comprehensive view of overall market momentum and participation.
What is the Klinger Oscillator?
The Klinger Oscillator is a technical analysis indicator used to measure the long-term trend of security prices and determine when money flow is positive or negative. Klinger Oscillator was developed in the 1990s by Stephen J. Klinger, a trader and author who wrote the book Technical Analysis for the Trading Professional.
The Klinger Oscillator uses two indicators – price movements and volume – to assess whether money flow is entering or leaving a security.

It is calculated by subtracting the 34-period exponential moving average of volume multiplied by the 13-period exponential moving average of absolute price change from the 34-period exponential moving average of volume multiplied by the 34-period exponential moving average of absolute price change.
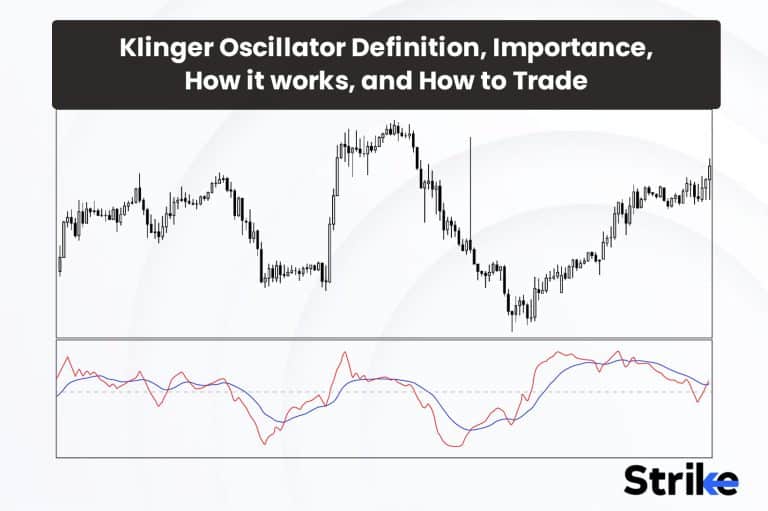
The oscillator fluctuates above and below a zero line. It shows strong money flow and indicates an upward trend when the oscillator is above zero. It indicates a downward trend when it is below zero. The farther the oscillator is above or below the zero line, the stronger the uptrend or downtrend.
Divergences between the oscillator and price also generate trade signals. For example, it indicates weakening momentum that could foreshadow a price pullback, if the prices are making new highs but the oscillator fails to exceed its previous highs. The Klinger Oscillator uses long-term exponential moving averages to filter out short-term noise, identifies divergences between price and momentum to anticipate trend reversals, acts as a lead-lag indicator for future price movements, accounts for volatility to avoid false signals, identifies overbought and oversold levels indicating exhaustion, and incorporates absolute price change in its formula to prevent distortion, making it a useful and versatile indicator for traders.
The main limitations of the oscillator are that it produces false signals and whipsaws during trading ranges and lags other indicators at major turning points. It should be used in conjunction with other technical analysis tools. The Klinger Oscillator provides a comprehensive view of money flow and long-term price trends. Its use of volume makes it more insightful than many other momentum indicators. The Klinger Oscillator offers a powerful method for identifying shifts in the balance of power between bulls and bears when it is combined properly with price analysis.
What is the term for the Klinger Oscillator?
The “Klinger Volume Oscillator” is another common name for the technical analysis indicator known as the Klinger Oscillator. The formal name is simply the “Klinger Oscillator”, but adding “Volume” helps differentiate it from other types of oscillators that do not incorporate volume.
What is the history of the Klinger Oscillator?
The Klinger Oscillator was developed by technical analyst and trader Stephen J. Klinger in the early 1990s. Klinger first introduced the concept in his 1991 book Technical Analysis for the Trading Professional. The oscillator was part of a broader trading strategy meant to time entries and exits by identifying turning points in price trends. Stephen Klinger was an experienced market technician who started trading in 1977. He believed traditional price analysis could be improved by also studying volume flows. In his book, Klinger made the case that volume provides important clues about developing trends. He realized price should not be analyzed in isolation. This philosophy led him to create the indicator now known as the Klinger Oscillator.
The oscillator was designed to identify long-term trends and signal when those trends are potentially reversing. It does this by comparing two exponential moving averages of volume multiplied by absolute price change. One key innovation by Klinger was using absolute price change rather than standard price change in the calculation. Absolute price change keeps volume flows positive and prevents distortion. This accounts for volatility in a more meaningful way.
The inventor Klinger back-tested his oscillator formula extensively to validate its effectiveness. He found it identified trend reversals sooner than many other indicators. It also produced fewer false signals during trading ranges. Over time, the Klinger Oscillator gained popularity among analysts and traders because of how it encompasses volume, price and moving averages under one roof. It is available on all the charting platforms and is used across all the traders trading in different types of capital markets.
Some technicians have modified the original two-EMA formulation to experiment with additional combinations of settings. For example, using a faster 5-period EMA versus a slower 34-period EMA. However, the standard 13/34-period combination publicized by Klinger remains the most common. Over 30 years since its inception, the Klinger Oscillator remains appreciated for its incorporation of volume, focus on money flow, and smooth crossover signals. Klinger’s innovations have inspired other volume-based technical indicators over the years. But his original oscillator formula has stood the test of time and continues to provide traders with unique insights into developing trends across all tradable markets.
What is the importance of the Klinger Oscillator?
The Klinger Oscillator is an important technical indicator as it incorporates volume for more insight, uses absolute price change, tracks dual exponential moving averages, filters noise with smoothing, identifies divergences and overbought/oversold levels, works across markets, provides trade signals, and serves as a sentiment indicator. It incorporates volume in its calculation which provides more insight into developing trends than only analyzing price. Volume confirms the conviction behind price movements and reveals information on supply and demand dynamics.
The Klinger Oscillator quantifies absolute price change rather than just standard price change. This accounts for volatility in a more meaningful way and prevents distortion in the calculation. Smooth price trends are analyzed rather than raw price fluctuations. The dual exponential moving average construction tracks both short-term and long-term money flow momentum. Comparing the faster 13-period EMA versus slower 34-period EMA identifies turning points sooner than single timeline indicators.
The EMA smoothing filters out market noise and volatility to generate high-quality, reliable trading signals. Smooth oscillator movements ensure traders are not whipsawed by insignificant price swings and minor fluctuations. The Klinger Oscillator is lead-lag, meaning it could foreshadow future price movements rather than simply react to them. Momentum shifts show up in the interaction between the EMAs before translating to actual price trends.
The oscillator is proficient at identifying bullish and bearish divergences between price and momentum. These divergences often precede significant trend reversals as momentum loses heat before prices turn. Overbought and oversold levels become clearly defined using the Klinger formula. Readings considered highly excessive help time counter trend trades anticipating exhaustion reversals. The Klinger Oscillator works well across all markets and asset classes, including equities, forex, commodities, and indexes. It adapts well to different trading vehicles and conditions.
It provides effective trade signals via zero line crossovers, swing highs/lows, and divergence setups. These high-probability signals give traders an edge in timing profitable long and short trades. It serves as a valuable sentiment indicator revealing the balance of power between bullish and bearish forces. Sustained positive readings reflect optimism, while sustained negative readings reflect pessimism.
How does a Klinger Oscillator work?
The Klinger Oscillator works by comparing two exponential moving averages (EMAs) of volume multiplied by price change. The interaction between these two EMAs produces oscillator patterns that traders analyze to measure momentum and time trades.
The Klinger Oscillator is calculated using four key measurements:
the Trend Confirmation Index (TCI) which compares long-term money inflows and outflows;
the Volume Force Index (VFI) which monitors volume versus price change;
the short-term Volume Force Index (VFIs) which analyzes short-term volume surges; and
the long-term Volume Force Index (VFIl) which looks at longer-term volume trends.
The TCI shows whether volume confirms price direction. The VFI identifies if volume is driving the price. The VFIs help spot potential turning points. The VFIl smoothes volatility and reveals stronger trends. Together, these four components provide comprehensive volume and money flow analysis for generating tradable oscillator signals.
The Klinger Oscillator takes these four measurements and processes them into a single oscillator that fluctuates above and below zero. The crossing of zero indicates a change in the overall money flow for a security. There are five main strategies for analyzing the oscillator – positive readings show buying pressure supporting uptrends while negative readings indicate selling pressure reinforcing downtrends; divergences warn of potential reversals ahead; zero crossings signal major shifts in accumulation/distribution; more frequent zero crossings reflect choppy money flow; and the distance from zero displays the strength of conviction behind the accumulation or distribution. Using these interpretive principles provides insight into money flow, trends, reversals, conviction, and volatility.
What differentiates Klinger Oscillator from other Volume Oscillators?
The Klinger Oscillator is differentiated from other volume oscillators by uniquely analyzing the interaction between price and volume using dual smoothed absolute price change timeframes, providing more responsive momentum insights than other volume-only oscillators. It also quantifies absolute price change rather than standard price change to better account for volatility. Specifically, the Klinger Oscillator calculates the difference between two exponential moving averages of volume multiplied by smoothed absolute price change. This approach provides a dual-timeline perspective on money flow based on both volume and price trends.
In contrast, the Chaikin Oscillator simply compares a short-term EMA and long-term EMA of accumulation/distribution. The On Balance Volume indicator adds or subtracts each period’s volume depending on whether prices rose or fell. The Volume Oscillator calculates the difference between short-term and long-term volume EMAs. While these indicators track volume flows, they do not look at the interaction between price and volume like the Klinger Oscillator does. Volume confirms the conviction behind price movements. Analyzing both elements together provides deeper insights.
Additionally, the Klinger formula uses absolute price change rather than standard price change. Absolute price change keeps the numbers positive and prevents distortion when taking the average. This accounts for volatility and normal price fluctuations more effectively. The Klinger Oscillator effectively incorporates price and volume data into a smoothed dual time frame momentum indicator. This comprehensive approach provides earlier, more valid signals with less noise than other volume oscillators. Smoothing the price-volume interaction filters out isolated spikes to focus on meaningful swings. The result is well-defined momentum insights for timing trend changes, with fewer false signals and whipsaws.
What is the formula of the Klinger Oscillator?
The formula for kilnger oscillator is below.
KO = EMA(Vol x EMA(|Price Change|), 34) – EMA(Vol x EMA(|Price Change|), 13)
Where,
KO = Klinger Oscillator
Vol = Volume
|Price Change| = Absolute Price Change
EMA = Exponential Moving Average
This multi-step process produces an oscillator that fluctuates based on the interaction between volume-adjusted price change over two different time horizons. The end result is an indicator that smoothly reflects the balance between long-term and short-term money flow.
How to calculate the Klinger Oscillator?
The Klinger Oscillator is calculated by subtracting a 34-period exponential moving average of volume multiplied by price changes from a 13-period exponential moving average of volume multiplied by price changes. The steps are:
- Calculate the absolute price change for each period. Do this by taking the closing price for the current period and subtracting the prior period’s closing price.
- Then take the absolute value of that difference. This quantifies the raw price change while keeping it positive. Smooth the absolute price change by applying a 13-period exponential moving average. This filters out noise and produces a smoother trend of the underlying price change.
- Multiply the volume for each period by the smoothed absolute price change. This gives volume-weighted price change, also known as money flow.
- Apply a longer 34-period exponential moving average to the volume multiplied by smoothed price change values. This acts as a slower moving average that captures the longer-term trend.
- Apply a faster 13-period exponential moving average to the volume multiplied by smoothed price change values. This tracks the shorter-term trend. Take the difference between the two EMA values for each period, having calculated the longer 34-period EMA and the shorter 13-period EMA using the volume-adjusted price change data.
- Plot this difference as an oscillator fluctuating above and below a zero line. The final result is the Klinger Oscillator.
The oscillator will be positive, indicating increasing upward momentum, when the faster EMA is above the slower EMA. The oscillator will be negative, indicating increasing downward momentum, when the faster EMA is below the slower EMA.
The calculation remains a mathematical and theoretical concept as the indicator is widely available on all sorts of charting platforms like Strike.money, tradingview.
How to trade with the Klinger Oscillator?
The Klinger Oscillator generates trade signals through zero line crossovers, overbought/oversold readings, and divergence analysis that should align with the overall trend and are filtered for reliability by using smooth oscillator moves and confirmation from other indicators when timing entries and exits. Below is an example of how a bullish crossover between the signal line and the blue line can be taken as a signal.

The most basic Klinger Oscillator signal comes from a zero line crossover. Whenever the oscillator crosses above zero and into positive territory, it signals upside momentum is strengthening and creates a buy signal. Traders would look to go long on any bullish crossover. As a sell signal, however, the oscillator indicates that downside momentum is increasing as it goes below zero into negative territory. Traders would look to sell or go short on bearish crossovers below zero. In the chart uploaded below, one can observe how the bullish and bearish momentum kicked in when the kingler oscillator crossed the 0 level into positive and negative territories respectively.

The crossover signals work best when confirmed by an acceleration in price and volume. For example, a bullish crossover is more potent if accompanied by a surge in upside price momentum and heavy trading volume. This validates the signal. Overbought and oversold levels also generate trades. Readings above +100 or below -100 indicate excess optimism or pessimism. This shows conditions are overextended and due for a reversal.
Traders would consider going short on any overbought reading above +100 as it signals potential exhaustion of an uptrend. Oversold readings below -100 would prompt bottom fishing long trades anticipating a bounce. Additionally, bullish and bearish divergences between the Klinger Oscillator and price sets up the trades. A bullish divergence forms when price makes a lower low but the oscillator forms a higher low, signalling waning downside momentum. This creates a buy signal on the subsequent upswing.
A bearish divergence forms when price reaches a higher high but the oscillator tops out at a lower high, signalling fading upside momentum. This prompts a short sale on the subsequent decline. An example of bullish divergence between the indicator and the price is shown in the chart uploaded below.

What are the settings for the Klinger oscillator?
The commonly used settings for the Klinger oscillator are a 34-period exponential moving average of Klinger Volume subtracted from a 55-period exponential moving average of Klinger Volume.
The original standard settings for the Klinger Oscillator formula utilize a 13-period exponential moving average (EMA) for the faster signal line and a 34-period EMA for the slower signal line. The 13-period EMA acts as the faster signal line applied to the volume multiplied by smoothed absolute price change values. This tracks short-term money flow. The 34-period EMA acts as the slower signal line applied to the volume multiplied by smoothed absolute price change. This captures the longer-term trend. The 13 and 34 periods are then used to calculate the two EMAs before taking the difference to derive the final oscillator reading.
The 13-period setting captures a shorter-term two week trend. The 34-period setting captures a longer-term one month trend. Comparing one month versus two week money flow allows the Klinger Oscillator to identify subtle shifts in momentum trends ahead of price reactions. The relatively smooth EMA constants used for the settings also filter out market noise and prevent false signals. More extreme settings would make the oscillator too reactive while more conservative settings would reduce responsiveness.
In addition to the standard 13 and 34 period exponential moving averages, the baseline Klinger Oscillator settings also typically use a Commodity Channel Index (CCI) period of 14 for the absolute price change calculation component. Another standard baseline setting is a period of 10 for the initial exponential moving average smoothing applied to the Smoothed Price Change Value.
The final key default setting is a zero level signal line for identifying crossover signals when the oscillator crosses above or below the baseline. These accompanied parameters optimize the oscillator’s sensitivity and smoothness for robust trading signals. They were meticulously tested by Klinger across equities, commodities, currencies, and indexes.
Traders sometimes experiment with more responsive 5/13 or 3/10 periods, but this risks excess sensitivity and whipsaws. The original standard 13/34 settings remain the most widely used with proven effectiveness across all markets and timeframes.
What trading strategies work best with Klinger Oscillator?
The Klinger Oscillator works best with trend-following strategies that use crossovers to identify changes in the direction of the overall market trend. The Klinger Oscillator also works well with swing trading, momentum, and breakout strategies. The Klinger Oscillator manages to identify short-term turning points and overbought/oversold levels ideal for swing trades which is known as swing trading. Traders go long on bullish crossovers and oscillator lows, and go short on bearish crossovers and oscillator highs. Smooth oscillator moves verify conviction.
The inherent momentum focus of the oscillator makes it ideal for timing entries in the direction of accelerating price moves which is known as momentum trading. Bullish crossovers signal rising momentum on the long side, while bearish crossovers signal building momentum on the short side. The momentum surge accompanying oscillator zero line crossovers propels strong breakouts. New upside breakouts are bought on bullish crossovers, while new downside breakouts are shorted on bearish crossovers.

In the above uploaded chart, we will uncover the numerous ways the oscillator can be used to take trades. The first instance focuses on the bullish and bearish crossovers the indicator produces. The second instance showcases how an oscillator gives signals of momentum shift when it reaches extreme lows and highs. The third methodology is the cross of the oscillator through the 0 line. The zero line crossing is taken as potential buy and short signals. Divergences occur between price and oscillator to generate trade signals.
One must use the oscillator in conjunction with multi-time frame analysis, price action, candlestick patterns and different indicators to confirm a trade setup. Appropriate risk management must be incorporated during the trade as it gives an edge to the trader to stay longer in the game of uncertainty.
What are the limitations of Klinger Oscillator?
The Klinger Oscillator has limitations which include lag, false signals, volume distortion, parameter dependence, hard-to-read signals, context dependence, volatility linkage, excessive signal frequency, divergence subjectivity, and whipsaw tendencies that traders should incorporate into usage and analysis.
- Lagging Signal
The extensive smoothing in the Klinger Oscillator construction, especially the slow 34-period EMA, contributes to lagging signals. Rapid trend changes begin before a crossover signal occurs.
- False Signals
Smoothing helps reduce false signals but crossovers and divergences still occur prematurely, leading to bad trades during choppy periods.
- Volume Fluctuations
The volume input makes the indicator vulnerable to erratic readings during periods of extreme volume surges or contractions.
- Optimising Parameters
The standard settings are not ideal for all markets. Optimising the shorter and longer EMA periods is required to improve relevancy.
- Subjective Interpretation
Reading divergences and momentum shifts requires practice and subjectivity. Not all divergences translate into trades.
- Confirmatory Indicators
The oscillator is best used with other indicators like RSI to confirm crossover and divergence signals before trading.
- Defining Extremes
Unlike banded oscillators, upper and lower extremes are not precisely defined, making overbought/oversold levels more ambiguous.
- Harder to Read
Visually interpreting a single oscillating signal line is more difficult than banded or centred oscillators. Momentum shifts are subtler.
- Context Dependence
Signals must be analyzed in relation to the bigger price action context. No signal is universally tradable.
Relying solely on the Klinger Oscillator without any confirmation leads to uncertain outcomes. Using the oscillator in conjunction with other techniques allows traders to validate signals and avoid whipsaws. As with all technical indicators, the Klinger Oscillator is most effective when integrated as part of a broad trading strategy.
Can Klinger Oscillator be used with Stochastic Oscillator?
Yes, the Klinger Oscillator is used in conjunction with the Stochastic Oscillator to confirm trend signals and crossover points. Both the indicators can give complimentary signals and the divergences created between price and both the indicators can add confirmation to an existing trade setup. This way, traders could time the entries and manage risk appropriately. Below is an attached example of how the indicators can be used together.

Is Klinger Oscillator a leading indicator?
No, the Klinger Oscillator is not considered a leading indicator. It is classified as a lagging indicator since it relies on historical price and volume data in its calculation.
Leading indicators forecast future price action, typically turning before the actual market tops or bottoms. They attempt to measure momentum and strength in advance of trend changes. Common leading indicators include the Relative Strength Index (RSI), Stochastic Oscillator. In contrast, lagging indicators generate signals after the market has already begun moving in a new direction. They confirm trends that are already underway rather than predicting reversals ahead of time. Moving averages are probably the most popular lagging indicator.
Is the Klinger Oscillator better than the OBV?
No, the Klinger Oscillator is not better than On Balance Volume (OBV). The two indicators have differing constructions and are used to measure different aspects of volume, making direct comparisons difficult. Each indicator has unique strengths and limitations.


 Previous Article


![15 Investing.com Alternatives [Free+Paid] You Should Use in 2026](https://www.strike.money/wp-content/uploads/2026/04/Investing.com-Alternatives.jpg "15 Investing.com Alternatives [Free+Paid] You Should Use in 2026 40")
![15 TradeStation Alternatives [Free+Paid] You Should Use in 2026](https://www.strike.money/wp-content/uploads/2026/04/TradeStation-Alternatives.jpg "15 TradeStation Alternatives [Free+Paid] You Should Use in 2026 41")
![15 Chartink Alternatives [Free+Paid] You Should Use in 2026](https://www.strike.money/wp-content/uploads/2026/04/Chartlink-Alternatives.jpg "15 Chartink Alternatives [Free+Paid] You Should Use in 2026 42")
: Overview, 10 Types of Indicators, Settings for Different Markets 44")

 : Definition, Formula, calculation, Uses, Advantages Vs limitations 46")


No Comments Yet.