The island reversal pattern is a technical analysis chart pattern that signals a potential reversal in the prevailing trend of a security’s price. The island reversal pattern forms when the price trends in one direction, experiences a sharp move against the trend, and then consolidates sideways before continuing in the original direction. This creates what appears as an “island” on the chart.
The island reversal pattern consists of a sharp drop followed by a sideways movement and a break above resistance at Gap 2. Island reversal pattern is a fairly accurate technical analysis tool that can be used to anticipate changes in the market’s direction. One advantage of the pattern is that it provides clear entry and exit points for traders. The main limiation of the pattern is that it is not foolproof and can sometimes result in false signals.
What is the Island Reversal pattern?
The Island Reversal is a candlestick pattern that signals a potential trend reversal. The Island Reversal is formed when there is a gap up or down in price followed by a few days of trading in a tight price range, creating the visual effect of an “island” separated from the mainland of price action. See the picture below.
This pattern represents an exhaustion of the prior trend. The confirmation signal comes when price breaks out of the island in the opposite direction of the original gap, indicating the prior trend is reversing.
For example, it would be considered an Island Reversal top pattern, if prices were in a downtrend then gapped up sharply, traded sideways for a few days, and then broke down out of the island below the original gap. This would signal the downtrend is resuming again. The Island Reversal pattern offers traders a chance to take a counter-trend position at an opportune time when the prior trend shows signs of exhaustion before reversing direction.
How Island Reversal form?

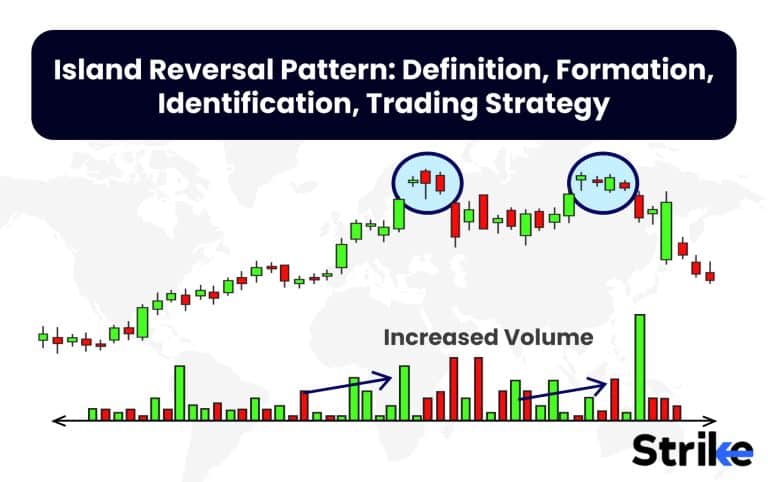
Above is how the island reversal pattern forms. The stock price initially trends upwards, forming the left side of the island. It then reverses direction and falls sharply, creating the bottom portion of the isolated area. After hitting a low point, the price stabilizes and moves sideways for a time between support and resistance levels. This middle section is the island part of the pattern. Eventually, the price breaks through the resistance level and resumes the original uptrend, closing the right side of the island. This completes the reversal formation on the chart.
How to identify Island Reversal pattern?
To identify Island reversal patterns, first look for an island gap that stands out on the chart. The gap will usually be large, anywhere from 2-5% or more from the previous closing price. After the gap, there should be a flat tight trading range for at least 1-2 weeks, often longer. This price consolidation creates the “island”, disconnected from prior action. Look for heavy volume on the gap day, indicating strong conviction in the initial move.
Watch for prices to break out of the island in the opposite direction. For example, watch for a downside breakout back below the island low, if prices gapped up. This signals sellers have overpowered buyers, despite the strong initial gap up. The downside breakout confirms reversal of the uptrend. Similarly, watch for an upside breakout back above the island’s high, if prices gapped down initially. This signals renewed buying interest and potential reversal of the downtrend.
Prices breakout in the reversal direction, volume should spike, showing conviction behind the emerging new trend. The size of the island reversal indicates how significant the trend shifts are. Larger islands with bigger gaps suggest a more substantial trend change. Look for a test of support or resistance around the island price levels following the breakout. This adds further confirmation of the reversal. There are a few variations of the Island Reversal to watch for.
A Breakaway Gap Island Reversal occurs after a breakaway gap, marking the start of a new trend. An Exhaustion Gap Island Reversal happens after an exhaustion gap near the end of a trend. Testing the island lows or highs after the reversal provides a secondary entry point. Island reversals most commonly occur at major market turning points and mark the start of a new uptrend or downtrend.
What happens after the Island Reversal pattern?
Island reversal pattern is followed by a change in the prevailing trend. This pattern is formed when there is a gap up followed by a price move and then another gap down. After forming, there are six common outcomes traders typically see following an Island Reversal pattern.
First, in the short term after an Island Reversal, price volatility tends to increase. The large gap between the Island cluster and previous trading range shows a break in equilibrium between buyers and sellers. This implies that the trend is losing momentum and likely nearing exhaustion. With the uptrend or downtrend destabilised but not fully reversed yet, prices often swing back and forth with large price swings as the trend struggles to continue.
Second, volume will usually surge as the Island Reversal forms then remain elevated afterwards. The spike in volume confirms a sharp shift in market psychology powering the trend shift. Heavy turnover reflects increased disagreement between buyers and sellers about the direction forward. High volume after the pattern signals traders are active in repositioning, defending breakout levels, and initiating new entries for the emerging trend.
Third, following an Island Reversal bottom, prices will often retest support around the lows of the Island cluster. This offers a second chance to enter long positions at a key support level before confirmation of a new uptrend. Conversely, after an Island Reversal top, prices revisits the Island’s peak, allowing short sellers another opportunity to initiate trades if the reversal is valid. Failed breakouts are common as old support or resistance levels are tested.
Secondary confirmation indicators like moving average crosses, overbought/oversold oscillators turning, and positive price action patterns give further evidence an Island Reversal is succeeding. Directional indicators like the RSI or MACD strengthening in the direction of the new trend validate the Island signal.
How to trade Island Reversal pattern?
To trade island reversal pattern correctly identify the Island Reversal on the chart. Look for a cluster of candles that have gaps above and below, separating them from the rest of the price action. The gaps create an ‘island’ effect on the chart. Typically you want to see at least 2-3 candles in the island cluster for it to be valid. The gaps indicate a dramatic shift in sentiment that traps traders on the wrong side.
Next, determine the context around the Island Reversal. Is it forming at support or resistance which makes it more significant? What is the trend leading into the pattern – up, down or range-bound? The Island Reversal is strongest after a sustained trend when it signals a powerful shift is underway. Be wary of island reversals in choppy or range-bound conditions which are less reliable.
Wait patiently for the Island Reversal pattern to complete. Do not anticipate the breakout before the pattern has fully formed. Often the second gap down or up does not happen until some consolidation after the first gap. Sitting tight avoids getting faked out on false breaks while giving you confirmation when the actual reversal occurs.
Plan your trade including entry, stop loss and take profit levels. Once the Island Reversal completes, prepare to enter a new position in the direction of the breakout. Go long after an island bottom or short after an island top. Place a stop loss order just outside the high or low of the island, allowing for some wiggle room. Set a risk-reward ratio of at least 2:1 or higher favouring profits over potential loss.
Time the entry properly when initiating the new position. Most often, the best opportunity comes on the first pullback or consolidation after the initial breakout surge. This allows you to get in at a better price with the trend re-confirmed. Entering on pullbacks also identifies logical areas for stop losses and profit targets.
Manage risk accordingly as the pattern often leads to fast, volatile moves. Use a stop loss order on every trade, placed just outside the island based on your criteria. Be prepared to get stopped out if the breakout fails. Limit position size to keep losses small on any single trade. Consider scaling out of large profits once targets are reached.
What is an example of a trading Island Reversal pattern?
Below is an example of a trading Island Reversal pattern.

The stock price was initially trending upwards, forming the left side of the island. There was a sharp price drop at Gap 1, creating the bottom portion. After Gap 1, the price stabilized and moved sideways for some time. This middle section shows the “island” part of the pattern.
Eventually at Gap 2, the price broke through resistance and resumed the original uptrend, closing the right side of the island and completing the reversal pattern. One should look for an island reversal pattern on the chart with a sharp drop followed by a sideways movement.
Once there is a break above the resistance level at Gap 2, indicating a resumption of the uptrend, one can enter a long position. It is important to wait for confirmation in the form of a close above the resistance level. The trade position should be maintained as long as the price trend continues upwards with sufficient volume supporting the movement. A stop loss should be placed below the resistance level to limit potential losses if the pattern fails.
How to confirm Island Reversal pattern before trading?
The best way to confirm an Island Reversal is to analyse the magnitude of the gap that forms the island. Larger gaps indicate intense emotion and a stronger potential reversal. Gaps that are a significant percentage of the stock price suggest good odds of continuation. Small gaps still reverse, but have a higher chance of failing.
You should also examine the volume signatures on both ends of the island. High volume on the gaps indicates panic and capitulation. The highest volume should occur on the second gap at the island’s shore, showing climatic selling or buying. Low volume shows a lack of commitment to the pattern. Contextual volume analysis compared to past activity is best.
Analyse the preceding trend to determine if the Island Reversal makes sense on the chart. For a top, check that the uptrend was strong and mature. For a bottom, confirm a deep selloff preceded it. The durability of the prior trend gives credence to the exhaustion the island represents. Avoid trading islands within congestion zones. The time duration of the pattern itself provides clues. Longer-lasting islands with several candlesticks building the base show more robustness. Short islands with only a few candles lack substance and fizzle out on breakouts. Time allows the panic highs or lows to set up.
The slope and shape of the island itself should be assessed. Ideal islands will slope slightly against the breakout direction, showing the last vestiges of the old trend. Avoid flat or v-shaped islands. For tops, descending islands are best. For bottoms, look for ascending profiles.
How to set up a stop loss while trading Island Reversal pattern?
A stop loss is set up while trading Island Reversal pattern by strategically placing risk control points below or above the island formation to exit positions if the anticipated trend reversal fails to materialize. Trailing stops, channel lines and technical indicators help identify effective stop levels. Stop losses help limit potential losses by exciting positions if the pattern breaks down.
The most straightforward stop loss placement is below the low or high of the island formation itself. For island bottoms, placing a stop just below the low of the pattern protects capital if it turns out to be a false breakdown. For island tops, a stop above the peak of the island guards against upside failures. This isolates the risk to the range of the island pattern itself.
The only caveat is that stops placed too tightly increase the odds of being stopped out prematurely before the new trend gains traction. Therefore, it helps to place stops a bit wider, using round numbers or key support and resistance levels below or above the island. This provides some wiggle room for volatility while still limiting losses if the reversal fails.
Trailing stops are also an effective technique. Once an island reversal breaks out, the stop trials the trend at a safe distance, locking in open profits. For long trades, the trailing stop follows below the price action, moving up with upside advances. For shorts, the trailing stop follows above the price, ratcheting down as the stock declines. This allows riding extended moves while protecting against reversals.
How to choose a profit target for Island Reversal pattern trading?
The most logical profit target while trading using island reversals is the top of the previous trading range before the gap down occurred. This represents the ceiling where sellers previously took control and pushed the asset lower. It signals buyers are now in control and have their sights set on that former range high, when the Island Reversal breaks out above the gap up day’s high.
Traders set their profit target just under this prior support-turned-resistance level. The expectation is that bullish momentum will carry the price up to test the range high, allowing gains to be captured as it approaches this area. It encounters selling pressure as it nears the old range ceiling which makes exiting a bit prematurely prudent.
The size of the potential profit target depends on how much of a trading range existed before the Island Reversal formed. The bigger the pre-gap down range, the more upside potential exists post breakout. Sometimes the range high profit target implies gains of 10-15% or more from the Island Reversal entry point.
Beyond the technical range high target, other potential profit areas include Fibonacci retracements of the prior downtrend. The 50%, 61.8% and 70% retracement levels are popular upside targets to take partial or full profits. For an extended downtrend, even a 38% or 40% retracement could prove lucrative.
Traders have to adjust lower, if the Island Reversal breakout stalls or struggles to reach the initial profit target. The top of the actual island pattern is an alternative take profit spot. Or if a significant moving average lines up within the formation, it represents an interim upside level to consider.
Which timeframe is best for trading Island Reversal pattern?
The daily chart is generally seen as the best timeframe for trading Island Reversals. Daily charts provide a good balance between giving the pattern enough room to form, while also allowing traders to identify completions and enter positions in a timely manner. The multi-candle structure of the Island Reversal means it requires adequate candlestick data to take shape. Lower time frames like the 15 minute or hourly charts often don’t provide enough data for a clear Island Reversal to materialize.
At the same time, higher time frames like the weekly or monthly charts cause entries to be delayed too much after pattern completion. The daily chart hits the sweet spot between pattern clarity and prompt execution. While evaluating Island Reversals on daily charts, it’s ideal to examine at least 2-3 months of prior price activity.
This provides sufficient context to understand the existing trend the patterns are reversing. Daily charts also allow traders to identify key support and resistance levels that add confluence to the Island Reversal setup. Clear levels on either side of the pattern provide additional confidence in the validity of the signal.
How accurate is the Island Reversal pattern?
The Island Reversal pattern is considered a fairly reliable indicator of trend reversal. According to a statistical study by Thomas Bulkowski, an expert in chart pattern analysis, the island reversal was able to predict the direction of the next price move correctly 58% of the time. The study examined a total of 241 island reversals across various markets over multiple decades. Specifically, Bulkowski found that downside island reversals (where prices gapped below a trading range) predicted continued downward moves 58% of the time. Meanwhile, upside island reversals (where prices gapped above a range) predicted upside moves 58% of the time as well.
So the island reversal pattern, one of the many candlestick patterns, was accurate slightly better than half the time overall based on this quantitative study. An accuracy of 58% is considered relatively low compared to other chart patterns like head and shoulders or double tops/bottoms, which tend to test in the 65-70% accuracy range in studies. However, this accuracy rate, while not as high as some other candlestick patterns, is still statistically better than a random 50/50 guess.
What are the advantages of the Island Reversal pattern?
One of the main advantages of the Island Reversal pattern is it provides confirmation that a downtrend is potentially reversing into an uptrend. The island gap down represents extreme pessimism, while the island gap up reflects a burst of optimism and suggests the prior downtrend has ended. The Island Reversal’s breakout above the island high confirms buyers have regained control and provides a buy signal for traders to go long. This pattern gives traders greater confidence that the preceding downtrend’s power has been lost and an uptrend is starting.
The Island Reversal often forms after a significant market correction or period of consolidation. The island gap down represents panic selling to new lows, while the island gap up reflects eager buying and a sharp change in market sentiment. This pattern signals the extreme pessimism of the correction has been exhausted and the market is ready to resume its overall uptrend. The Island Reversal marks the end of the pullback and gives traders a low-risk opportunity to buy back into the primary trend.
The Island Reversal provides an advantageous entry point to go long with a favourable risk/reward profile. The protective stops are placed just below the low of the island gap. This defines the risk on the trade. The upside potential is much greater than the downside risk, as the stock keeps trending higher if the new uptrend continues. Traders are getting in early enough to capitalise on a potential major trend reversal. The obvious separation from the prior downtrend also makes the stop less likely to be hit.
It has a high probability of success, if the Island Reversal forms in a stock or market index that is in a long-term uptrend. The preceding downtrend is likely just a correction in the bigger bullish trend. The Island Reversal signals the correction has run its course and the uptrend is resuming its primary direction. This makes the pattern a high probability setup, as the major trend has a strong tendency to continue. Traders buy at the new uptrend’s beginning and hold for potential big gains.
The Island Reversal exhibits powerful breakout momentum, with prices gapping up through resistance. This demonstrates strong commitment from the buyers. Instead of testing resistance, the market gaps above the island’s high and surges higher. This swift breakout reflects urgency among buyers and usually leads to follow-through buying. The rapid breakout provides strong confirmation of the new uptrend. Traders buy the breakout for a high probability entry point. Stops are placed under the island low to limit risk.
The Island Reversal pattern, a concept in technical analysis, often shakes out weak or impatient traders before reversing. The island gap down traps bullish traders who don’t cut losses short enough or try to pick a bottom too early, demonstrating the importance of technical analysis in identifying potential reversals. The further selling on increasing volume washes out weak longs. This resets market sentiment and clears the deck for the uptrend to start with the island gap up. Much of the prior scepticism and selling pressure has been alleviated, allowing prices to rise with little overhead resistance, highlighting the value of technical analysis in understanding market movements.
What are the limitations of the Island Reversal pattern?
The main limitation of the island reversal pattern is that the Island Reversal tends to be an infrequent formation. It requires very specific criteria of a gap down and then gap up just to create the “island”. The gaps need to open well above or below the prior day’s range without filling in the gap during the day. These demands mean the Island Reversal requires just the right volatility and price action to take shape. Traders only come across this pattern a few times a year in a given stock. Its rarity makes it an exciting formation when it does occur, but unreliable for regular signals.
Island Reversals tend to mark major trend exhaustion more often than the start of a new trend. A high percentage of Islands end up as price reversals that quickly fail and fade back into the prior trend. The initial burst of optimism often stalls quickly. This means traders need to be cautious when interpreting Islands as major bottoms or tops, as follow-through is not guaranteed. Acting too early on an Island signal leads to losses if the prior trend resumes.
The Island Reversal is prone to false breakouts, where prices gap up above the island high but quickly reverse back into the island range. A gap up signals urgency among buyers but this fades fast. The initial spike in momentum often lacks substance leading to a breakout trap. Traders buy the breakout only to get stopped out if follow-through buying doesn’t materialise. False breakouts above or below the island present a tricky pitfall with this pattern.
The island gaps that form the price shocks surrounding an Island Reversal are inherently risky as stop gaps. The initial island gap down triggers cascading stop losses, while the island gap up runs stops of shorts. This increases volatility but also uncertainty as the gaps are news or event driven outside normal market forces. Traders are often caught off guard by the twin gaps around an Island formation. Defined risk management is essential when trading this pattern.
It is difficult to gauge how large of a reversal an Island formation will spark or how long it will last. Measure moves based on the island height face uncertainty. The Island Reversal leads to a multi-month new uptrend or failure after two days. The reliability of the pattern as a major bottom or top is situational. Traders cannot assume an Island will fully reverse the previous trend. Flexible exit strategies are required when trading Islands to account for different scenarios.
The logical stop loss on an Island Reversal is below the island low, which is often close by. This tight stop leads traders to prematurely exit positions on normal pullbacks or volatile whipsaws following the initial burst. Stopping out too early on normal consolidation after an Island entry leads to lost opportunity. Wider stops add more risk. The close-by nature of the island makes setting stops a balancing act.
It is easy for traders to miss buying the actual island gap up that forms the ideal entry point. The market gaps up sharply and are extended at the open. Chasing a gap into resistance lacks precise risk control. Traders not paying close attention to overnight action miss the initial island gap entry. Late entries after a gap lead to greater risk and poorer reward potential.
Trading an Island Reversal solely based on the pattern itself is a blind entry without sufficient context. Looking for corroborating price action, indicator signals and overall market conditions strengthens the pattern’s validity. Without added confirmation, traders buy into false Islands or get faked out by failures. Blindly buying gaps without analysing the current market backdrop increases risk.
What are the other chart patterns available?
Chart patterns are visual formations in price charts that traders use to predict future price movements. The most common chart patterns besides head and shoulders include triangles, flags, ascending/descending channels, double tops/bottoms, cup and handles, wedges, and gaps.


 Previous Article


![15 Investing.com Alternatives [Free+Paid] You Should Use in 2026](https://www.strike.money/wp-content/uploads/2026/04/Investing.com-Alternatives.jpg "15 Investing.com Alternatives [Free+Paid] You Should Use in 2026 28")
![15 TradeStation Alternatives [Free+Paid] You Should Use in 2026](https://www.strike.money/wp-content/uploads/2026/04/TradeStation-Alternatives.jpg "15 TradeStation Alternatives [Free+Paid] You Should Use in 2026 29")
![15 Chartink Alternatives [Free+Paid] You Should Use in 2026](https://www.strike.money/wp-content/uploads/2026/04/Chartlink-Alternatives.jpg "15 Chartink Alternatives [Free+Paid] You Should Use in 2026 30")
: Overview, 10 Types of Indicators, Settings for Different Markets 31")


 : Definition, Formula, calculation, Uses, Advantages Vs limitations 34")


: How We Used This 70/30 Indicator in 6 High Win-rate Strategies 37")


No Comments Yet.