


Pipe Top & Bottom Patterns refer to a price consolidation formation that looks like an upside down or right side up pipe. Pipe Top & Bottom Patterns develop when the price moves sideways within a tight price range for a period of time before breaking out in the direction of the prevailing trend.
Pipe Top & Bottom Patterns form after trends have emerged, with pipe tops indicating a potential trend reversal from an uptrend to a downtrend, and pipe bottoms forming at the end of downtrends and potentially signaling an impending uptrend.
The main advantage of pipe patterns is that they provide traders with a clear price range and volume triggers to identify potential reversals in the trend. One limitation is that pipe formations do not always result in significant trend changes, as the post-breakout move may not continue and it could just be a temporary retracement in the prior direction.
Pipe tops are identified when the price hits a high and then trades within a narrow range below that high, potentially indicating a change from bullish to bearish sentiment. Conversely, pipe bottoms form when the price finds a low and subsequently moves sideways within a tight price window above that low, which could foreshadow an incoming bull run. Proper identification of the pattern, ranging market structure, and breakout with increased volume are key in determining whether the trend will reverse following the resolution of a pipe top or bottom.
What are Pipe Top & Bottom patterns?
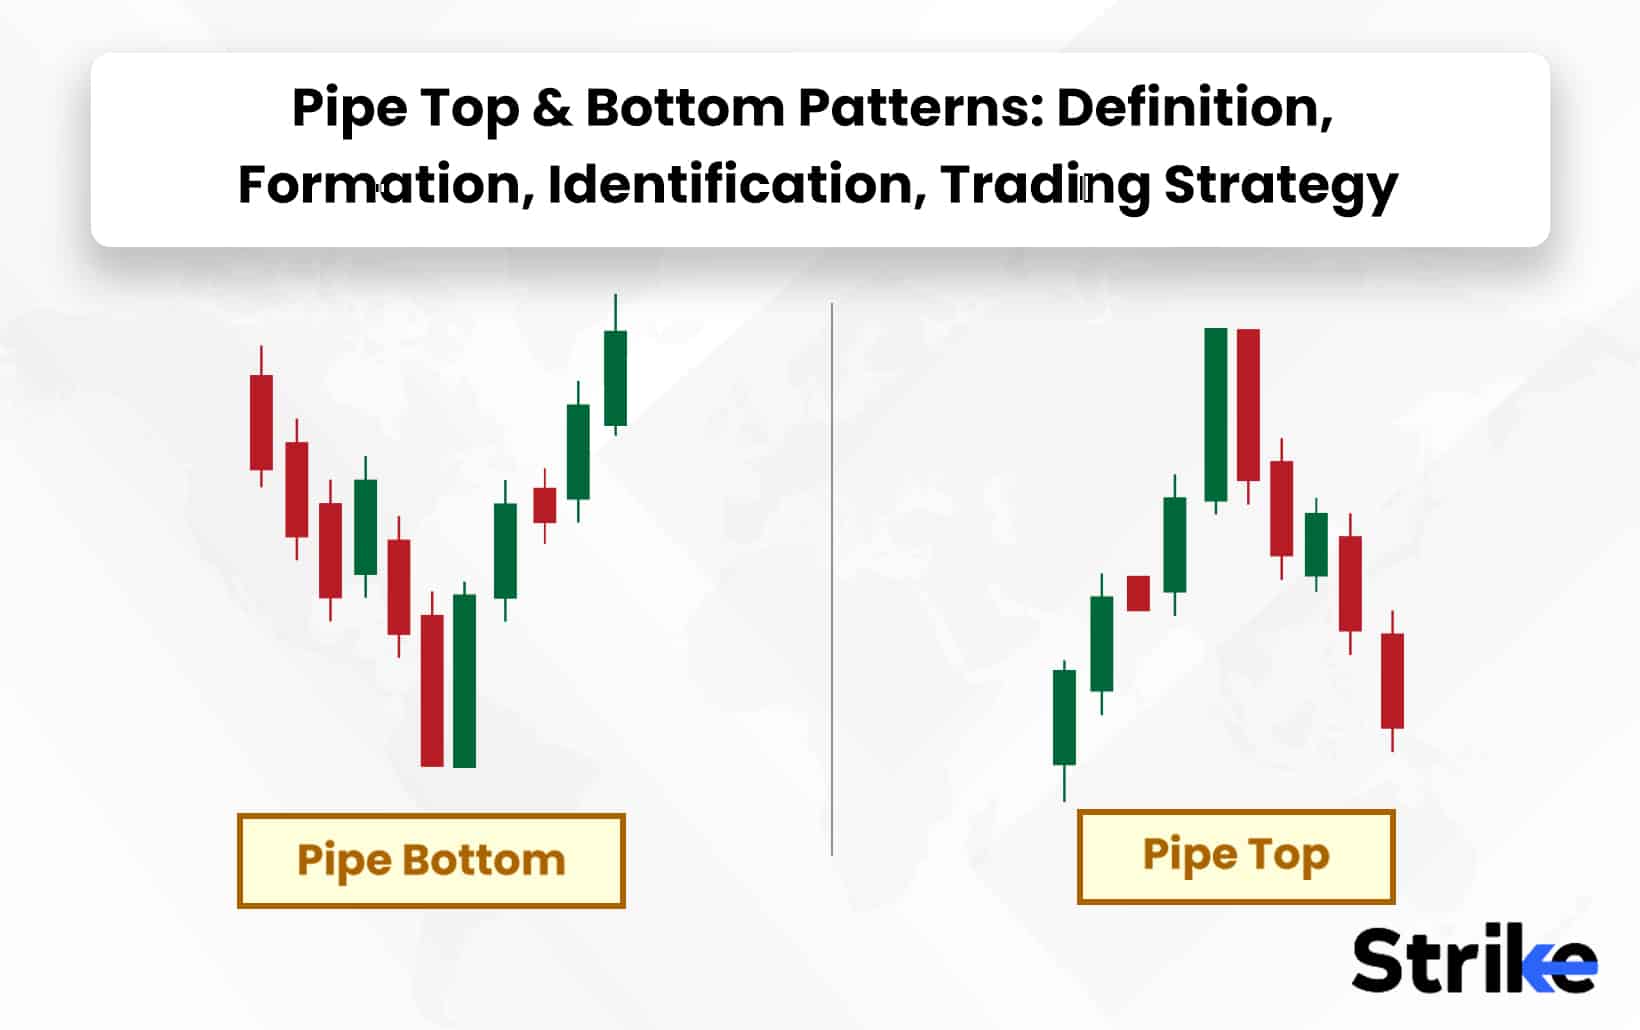
Pipe Top and Pipe Bottom candlestick patterns are reversal patterns formed when the high and low prices of a stock converge over two or more periods, creating candlesticks with small real bodies and long upper and lower shadows in the shape of a pipe. Pipe Top and Pipe Bottom candlestick patterns signal a potential trend reversal, with Pipe Tops indicating a reversal from an uptrend to a downtrend and Pipe Bottoms indicating a reversal from a downtrend to an uptrend.
A Pipe Top is formed after an uptrend, when the high and low prices of a stock start to converge over a few trading periods, creating candlesticks with small real bodies and long upper and lower shadows. This narrowing of trading range resembles the shape of a pipe. The Pipe Top indicates the uptrend is losing momentum and a potential trend reversal to the downside sometimes follows. Below is a representation of the pattern.
A Pipe Bottom has the opposite shape and implies the opposite price action. It is formed after a downtrend, when the high and low prices start to converge over two or more trading periods. This creates candlesticks with small real bodies and long upper and lower shadows, forming the shape of an upside down pipe. The Pipe Bottom pattern indicates the downtrend is losing steam and an upward trend reversal is ahead. Traders watch for these patterns on stock charts to identify potential turning points in the prevailing trend. A breakout in the opposite direction of the previous trend confirms the reversal signalled by the Pipe Top or Pipe Bottom pattern.
How do Pipe Top & Bottom forms?
Pipe top and bottom patterns are formed similar to the below image.
Here, The pipe top pattern is formed when the price hits a high and then trades within a narrow range below that high, forming the upper boundary of the “pipe”. Eventually, sellers gain control and push the price down out of the bottom of the pipe formation through increased volume. Now look at the image below.
Here, the pipe bottom pattern is the opposite – the price hits a low and then trades within a narrow range above that low, creating the lower boundary of the pipe. Buyers regain control here and push the price up out of the top of the pipe through heavier trading volume, confirming the reversal of the previous trend.
How to identify Pipe Top & Bottom patterns?
To identify pipe top and bottom patterns in stock charts, look for a tight trading range where prices oscillate between horizontal support and resistance levels for an extended period before breaking out above or below the range, signalling a potential trend reversal.
To identify a potential pipe top, traders should look for a period of sideways price action or a tight trading range after an established uptrend. Often, the consolidation will occur just below a recent high or resistance level. The tight range indicates a balance between buyers and sellers as the market prepares for the next leg up. Volume should dry up during this contraction period. The breakout point, or pipe top, is the upper bound of the recent trading range. A high-volume break above this level signals the resumption of the uptrend.
Spotting a potential pipe bottom requires looking for a period of sideways consolidation or a tight trading range after a downtrend. The tight range reflects a balance between buyers and sellers as the market absorbs the previous down move. Volume dries up during this coiling period. The lower bound of the recent range becomes the support, or pipe bottom. A high-volume breakout above this support signals the resumption of buying and starts a new uptrend.
What happens after Pipe Top & Bottom patterns?
After Pipe Top and Bottom patterns in the stock market, prices typically break out of the previous trading range and begin a new trend in the direction opposite the pipes. The pipe top signals the last stage of a bull run while the pipe bottom indicates the end of a downtrend. The eventual breakouts from pipe patterns also lead to significant price moves. A pipe top arises after a sustained uptrend as prices enter a period of consolidation near the high. This coiling phase reflects a balance between buyers and sellers as bullish momentum wanes temporarily. The narrow trading range is capped by resistance at the recent price peak. A high-volume advance above this breakout level signals the resumption of the uptrend.
The initial test of the pipe top resistance does not always lead to an immediate breakout. Sometimes the resistance holds and prices pull back to the middle or lower end of the consolidation range. This retest sets up another entry opportunity for traders. Resuming the uptrend with a strong breakthrough is possible if the downturn attracts additional buyers.
The pipe bottom forms after a downtrend as prices consolidate in a tight range near the lows. This coiling period reflects an equilibrium between buyers and sellers as bearish momentum subsides. The lower bound of the range becomes the support level, or pipe bottom. A high-volume thrust above this support signals the resumption of buying.
As with pipe tops, the initial breakout attempt does not always succeed. Sometimes prices return to the pipe bottom support after the first test. This provides traders another chance to get in before the new uptrend accelerates. Volume is key – expanding volume on the retest confirms buying demand. Lack of conviction means range bound action will continue.
How to trade Pipe Top & Bottom patterns?
Pipe Top and Pipe Bottom patterns are traded by identifying the characteristic price structure during a trend, waiting for confirmation of the pattern completion through a break of support or resistance, and then entering trades in the direction of the emerging new trend with proper risk management.

It’s important to wait for confirmation before trading a Pipe Top or Bottom. A clear break above the high (for Pipe Bottom) or below the low (for Pipe Top) of the pattern signals confirmation. Other confirmation signs include an expansion in volume on the breakout and a gap up or down from the pattern. Use a stop-loss order below the lowest low (for Pipe Bottom) or above the highest high (for Pipe Top) to control risk.
Once a Pipe Top or Bottom is confirmed, the most basic way to trade is to go short after a Pipe Top break down or go long after a Pipe Bottom breakout. For a Pipe Top, you will be able to sell short on the first lower low after the pattern completes. Or sell short on a pullback to broken trendline support. For a Pipe Bottom, go long on the first higher high or buy on pullbacks to the broken trendline resistance.
Determine your profit target based on the height of the Pipe pattern from the highest high to the lowest low. For a Pipe Top, the full height subtracted from the breakdown point gives a minimum target. For a Pipe Bottom, add the height to the breakout point. You will also be able to use Fibonacci extensions and projections to forecast potential turning points. Move your stop-loss to breakeven once the trade moves halfway to your target.
What is an example of trading Pipe Top & Bottom pattern?
Pipe Top

The provided chart illustrates the formation of a pipe top pattern on the daily chart of Fantom Blockchain (FTM/USDT) during a two-month uptrend. The price reached a high of $3.1593 in early November, but proceeded to decline two days later upon completion of the pipe structure.
Of note are the two candles comprising the pipe shape, which are identical in size with candle bodies that overlap by approximately 100% of their height. This full-bodied overlap creates the distinctive pipe shape at the high.
Subsequent to the pipe top formation, the price declined precipitously by over 78% within one week, reaching a low of $1.7656. This sharp decline followed immediately after the completion of the bearish reversal pattern.
Pipe Bottom

The provided chart illustrates the formation of a pipe bottom pattern on the STORJ Token (STORJ/USDT) daily chart, marking a bullish trend reversal in mid-July. Prior to the pattern formation, the price had been in a bearish trend for over one month since early May. However, the price started to rally two days after the completion of the pipe structure.
Of particular note are the two candles comprising the pipe shape, which have nearly identical size with candle bodies overlapping by approximately 90% of their height. This significant overlap creates the distinct pipe shape at the lows.
Following the pipe bottom formation, the price increased substantially by almost 214% within three weeks, reaching a high of $1.4489. This sharp rally followed immediately after the completion of the bullish reversal pattern.
How to confirm Pipe Top & Bottom pattern before trading?
Traders confirm pipe top and bottom patterns before trading by verifying the reversal with volume, indicators, support/resistance levels, follow-through moves, and alignment with the overall sector trend.
First clearly identify the pipe pattern on the chart. A pipe top consists of a wide trading range followed by a sharp reversal down, creating a shape resembling a pipe head. The wide trading range represents the open end of the pipe, while the sharp reversal down forms the closed bottom of the pipe head. Conversely, a pipe bottom has a sharp sell-off followed by a period of range bound trading, forming the pipe shape upside down. Traders should focus on daily or weekly charts to spot valid pipe patterns.
Once a pipe is identified, traders need to confirm the pattern with supporting market indicators and metrics. For pipe tops, examine momentum indicators like the Relative Strength Index (RSI) or Moving Average Convergence Divergence (MACD) for negative divergences. This shows momentum waning as the stock hits the top of the wide trading range, confirming a potential reversal. Pipe bottoms should show positive divergences on momentum indicators. Also look for higher than average volume on the reversal day for both patterns, indicating a sharp shift in market sentiment.
Monitor the volume trends during the wider trading range for pipe tops. High volume on up days and low volume on down days indicates accumulation. This lack of commitment from buyers going into the pattern confirms the weakness. For pipe bottoms, low volume on down days and high volume on up days reflects panic selling before the reversal, improving the chance it marks a bottom.
Analysing support and resistance levels provides more evidence to confirm pipes. A valid pipe top usually forms after a test of resistance, suggesting the uptrend is truly reversing. The wide range represents bullish exhaustion. Check that the stock breaks supporting trendlines and moving averages on the reversal day. For pipe bottoms, the pattern should form after testing support, with the stock bouncing off key levels. This implies sellers are spent and provides stronger confirmation.
How to set up a stop loss while trading Pipe Top & Bottom patterns?
Set your stop loss order slightly outside the highest or lowest point of the pattern structure when trading Pipe Top and Bottom reversal patterns in stocks to reduce possible losses in the event that the anticipated breakout does not materialise.
For Pipe Top and Bottom patterns, a logical place to put your stop loss is just outside the pattern structure. These patterns are made up of two opposing peaks or troughs that converge together to form the “pipe” shape. Place your stop loss a few ticks above or below the highest or lowest point of the pattern. This allows some wiggle room for natural market fluctuations but keeps you out of a trade if the pattern fails to work. Be sure to use a hard stop loss order, rather than a mental stop, to guarantee the loss is capped.
Instead of employing a set amount or point stop, think about adopting a volatility-based stop. Volatility-based stops such as the average true range (ATR) allow you to exit based on the stock’s normal volatility rather than an arbitrary point level. This helps account for differences in price levels and volatility between stocks. For example, set your stop at 2x the 20-day ATR above the Pipe Top or below the Pipe Bottom. The stop will automatically adjust to changing volatility conditions.
In addition to a stop loss, also consider using a trailing stop loss when trading Pipe patterns. A trailing stop trials the market as it moves in your favour, but automatically exits the trade if the market reverses by a specified amount. This allows you to lock in gains on a winning trade while still having downside protection. For Pipe trades, begin trailing the stop once the price breaks out of the pattern structure, incrementally raising the stop level as the stock moves favourably.
Remember to adjust your position size based on where you place your stop loss. Your stop loss distance should factor into how many shares or contracts you buy. For example, a ₹1 stop loss allows for greater size than a ₹3 stop loss given the same rupee risk per trade. Risk only what you feel comfortable losing on any one trade, and size accordingly based on your stop placement.
How to choose a profit target for Pipe Top & Bottom pattern trading?
Choose your profit objectives while trading the Pipe Top & Bottom pattern in the stock market by looking for recent swing highs and lows, Fibonacci extensions, possible support and resistance locations, and high volume zones on the chart.
As soon as the price breaks out and the Pipe Top & Bottom pattern is complete, glance left on the chart to determine the initial profit objective. Locate the most recent major swing high if going short, or swing low if going long. This gives the initial minimum profit target to aim for.
The last notable swing high prior to the downtrend should be the first region to take profit if a Pipe Bottom occurs following a downtrend and the price breaks above resistance. The logic is to capture some profits as price reaches the last point where sellers showed strength before the reversal.
Fibonacci extensions are a tool that traders use to identify possible price targets beyond the initial profit goals. After entering on the breakout, draw the Fibonacci tool from the high (Pipe Top) or low (Pipe Bottom) of the pattern to the breakout level. This will provide mathematically-based price extension levels where profit targets are considered.
The 1.618 Fib extension is popular, projecting where the emerging move could reach after retracing 100% of the prior trend. Higher extensions like 2.618 and 3.618 are also monitored for exit points if the trade continues favourably. Using Fib levels gives traders a roadmap for where to take profits during the expected trend reversal.
Monitoring these chart-based levels allows traders to proactively set profit targets at logical areas where the emerging trend could stall or bounce. Instead of passively waiting to exit at a Fib level, traders actively take profits near key potential resistance/support zones.
Trailing stops are a tool to lock in profits as the trade moves favourably, while limiting downside risk. After entering a Pipe Top/Bottom breakout, use a trailing stop order below an appropriate level, like the pattern breakout point or a moving average.
Looking at multiple timeframes when analysing the Pipe Top/Bottom pattern provides further confirmation of logical profit targets. A price level that aligns with a Fib extension on the hourly chart could correspond with broken trendline resistance on the daily chart, for example.
Which timeframe is best for trading Pipe Top & Bottom patterns?
The longer daily timeframe is best suited for trading Pipe Tops and Bottoms. These patterns require adequate time to form the ‘pipe’ shape after the initial spike higher or lower. This phase sometimes takes weeks to play out as the stock consolidates in a trading range. The daily chart captures this extended timeframe much better compared to shorter time frames like hourly or 4-hour. Trying to trade Pipe patterns on shorter time frames increases the risk of misinterpreting normal intraday volatility as a genuine reversal structure.
Pipe Tops and Bottoms reflect an imbalance between buyers and sellers and a shift in the underlying supply/demand equilibrium. These major changes in market psychology unfold over weeks and are better identified on the daily chart. The higher timeframe filters out intraday noise and provides a clearer picture of the evolving power struggle between bulls and bears.
Trading Pipe patterns on the daily chart aligns the trade with the dominant market trend. These reversals signify a major trend change, calling for a patient entry aligned with the new emerging trend. Lower time frames are more prone to false breakouts and whipsaws against the dominant trend. The daily chart improves the risk-reward ratio for Pipe trades.
The daily timeframe affords flexibility in deploying risk management around key support and resistance levels. Pipe patterns face volatile breakouts and retests, so risks are controlled by using envelope channels, ATR-based stops and trailing stops on the daily chart. Shorter timeframes restrict risk management flexibility for Pipe trades.
One caveat is that very tight or narrow Pipe patterns sometimes occasionally form on 4-hour or hourly charts around key intraday levels.
How accurate are Pipe Top & Bottom patterns?
Pipe Top And Pipe Bottom patterns are fairly accurate but the pattern is usually reliable only when the pattern is completed.
What are the advantages of Pipe Top & Bottom pattern?
The key advantages of the Pipe Top & Bottom pattern are that it provides stock traders with early reversal signals, clear entry/exit points, increased chance of success, and objective criteria for making trading decisions.
1. Early signal of trend reversal
The Pipe pattern telegraphs that supply and demand have come into balance, foreshadowing a shift in the existing trend. Savvy traders use Pipe Tops to get an early heads up that an uptrend might be ending and prepare to sell or short the stock. Pipe Bottoms hint a downtrend is losing steam and the stock could be ready to start climbing again.
2. Clear entry and stop loss points
The Pipe shape provides quite defined price levels where traders set entry orders to take new positions as the trend changes. Stop losses are also placed just outside the Pipe formation to limit potential losses if the breakout fails. The pattern presents clear price points for managing risk on the trade.
3. Increased chance of success
Trades made in the direction of the emerging new trend suggested by a Pipe pattern have a higher probability of success. The Pipe signals consolidations where uncommitted buyers and sellers are waiting on the sidelines, ready to jump aboard once the stock breaks out. Their participation adds momentum to the emerging trend.
4. Universal relevance
Pipe patterns form on daily charts but also identified on intraday time frames. They appear in all types of market conditions, making them widely relevant. Pipe Tops and Bottoms are useful indicators for short-term swing trades or longer-term position trades. The patterns work equally well on stocks, ETFs, commodities, forex and cryptocurrency charts.
5. Reliable precursors
Empirical studies have shown the Pipe reversal patterns consistently precede strong upside or downside moves. Their appearance gives traders confidence that a big price swing is likely approaching. Trading the breakout or fading the fake out of the Pipe formation might offer profitable trades.
6. Market psychology insights
The tightening price action reflects changing psychology in the market. Pipe Tops show bullish enthusiasm fading, while fear overtakes greed at Pipe Bottoms. This reveals valuable insights about shifting investor emotions at potential turning points. Traders gain an edge by gauging when crowd psychology becomes overextended.
7. Flexible trading approaches
Pipe patterns allow flexible trading strategies appropriate for market conditions. Aggressive traders sometimes play the breakout with leverage. Conservative traders might wait for a pullback or test of the breached Pipe level before entering a lower risk trade. The patterns work with many styles.
Pipe Top & Bottom patterns offer warning signals of trend reversals on stock charts. Their structure presents objective entry, stop loss and take profit levels while reducing subjectivity.
What are the limitations of Pipe Top & Bottom patterns?
The Pipe Top & Bottom pattern has inherent subjectivity in interpretation, provides false signals at times, works best in trending markets, lacks fundamental backing, and requires additional confirmations and prudent context analysis to overcome its limitations in stock trading.
1. Subjective interpretation
Pipe patterns lack clearly defined characteristics, which leaves room for subjective interpretations. Trading professionals frequently have the freedom to choose when the pattern is finished. Is the consolidation tight enough to qualify? This ambiguity makes precise timing of entries difficult. Setting universal rules for all situations is not realistic. Traders must use prudent judgement.
2. False signals
Like other chart patterns, Pipe formations produce false signals that fail to generate the expected price move. The breakout sometimes fizzled quickly, leaving those who traded the pattern with losses. Or the price move sometimes occurs but gets invalidated after a brief push in the anticipated direction. Traders sometimes mitigate false signals using other confirmations.
3. Range bound markets
Pipe patterns are best suited for trending markets. In choppy or range-bound conditions, they tend to produce more whipsaws and failed breaks. The indecisive environment sometimes causes multiple Pipes to form as the stock vacillates between support and resistance levels. This creates mixed signals and unclear conditions.
4. Works on all time frames
Pipe patterns appear on 1-minute charts up to monthly charts, but their significance varies across time frames. A Pipe on a 5-minute chart has less predictive value than a Pipe on the daily chart. Traders must gauge the time frame context to focus on high probability setups. Jumping on every Pipe leads to overtrading.
5. No change in fundamentals
The appearance of a Pipe pattern does not necessarily mean a company’s fundamentals have changed. The formation reflects technical price action, not anything directly related to financial metrics like earnings, growth or valuation. Basing trades solely on Pipe signals without assessing fundamentals is an incomplete approach.
Paying attention to the surrounding context, fundamentals, sentiment and market conditions allows traders to apply Pipe analysis more effectively within a robust trading plan.
What are the other chart patterns available?
In addition to Pipe Top & Bottom patterns, some other common chart patterns include Head and Shoulders, Cup and Handle, Double Top and Double Bottom, Triangle, Flag and Pennant, Wedge, and Channel patterns. Each has specific criteria in terms of price highs, lows, and trends that traders look for.


 Previous Article


: Meaning, 5 Types, Trading Strategy with Example, Win Rate 38")

 2026: Features, Pros vs Cons, Pricing, Reviews, Is It Worth It? 40")
 2026: Features, Pros vs Cons, Pricing, Reviews, Is It Worth It? 41")
 2026: Features, Pros vs Cons, Pricing, Reviews, Is It Worth It? 42")

 : Definition, Formula, calculation, Uses, Advantages Vs limitations 46")


: 12 Core Principals with Trading Guide 50")


No Comments Yet.