
Rohit Momentum Indicator
Get Accurate Buy Sell Signals
Rohit Momentum Indicator (RMI) measures momentum shifts by combining price action and trend strength to identify early buy and sell opportunities. RMI helps traders spot emerging trends, confirm momentum, and time entries and exits more effectively.
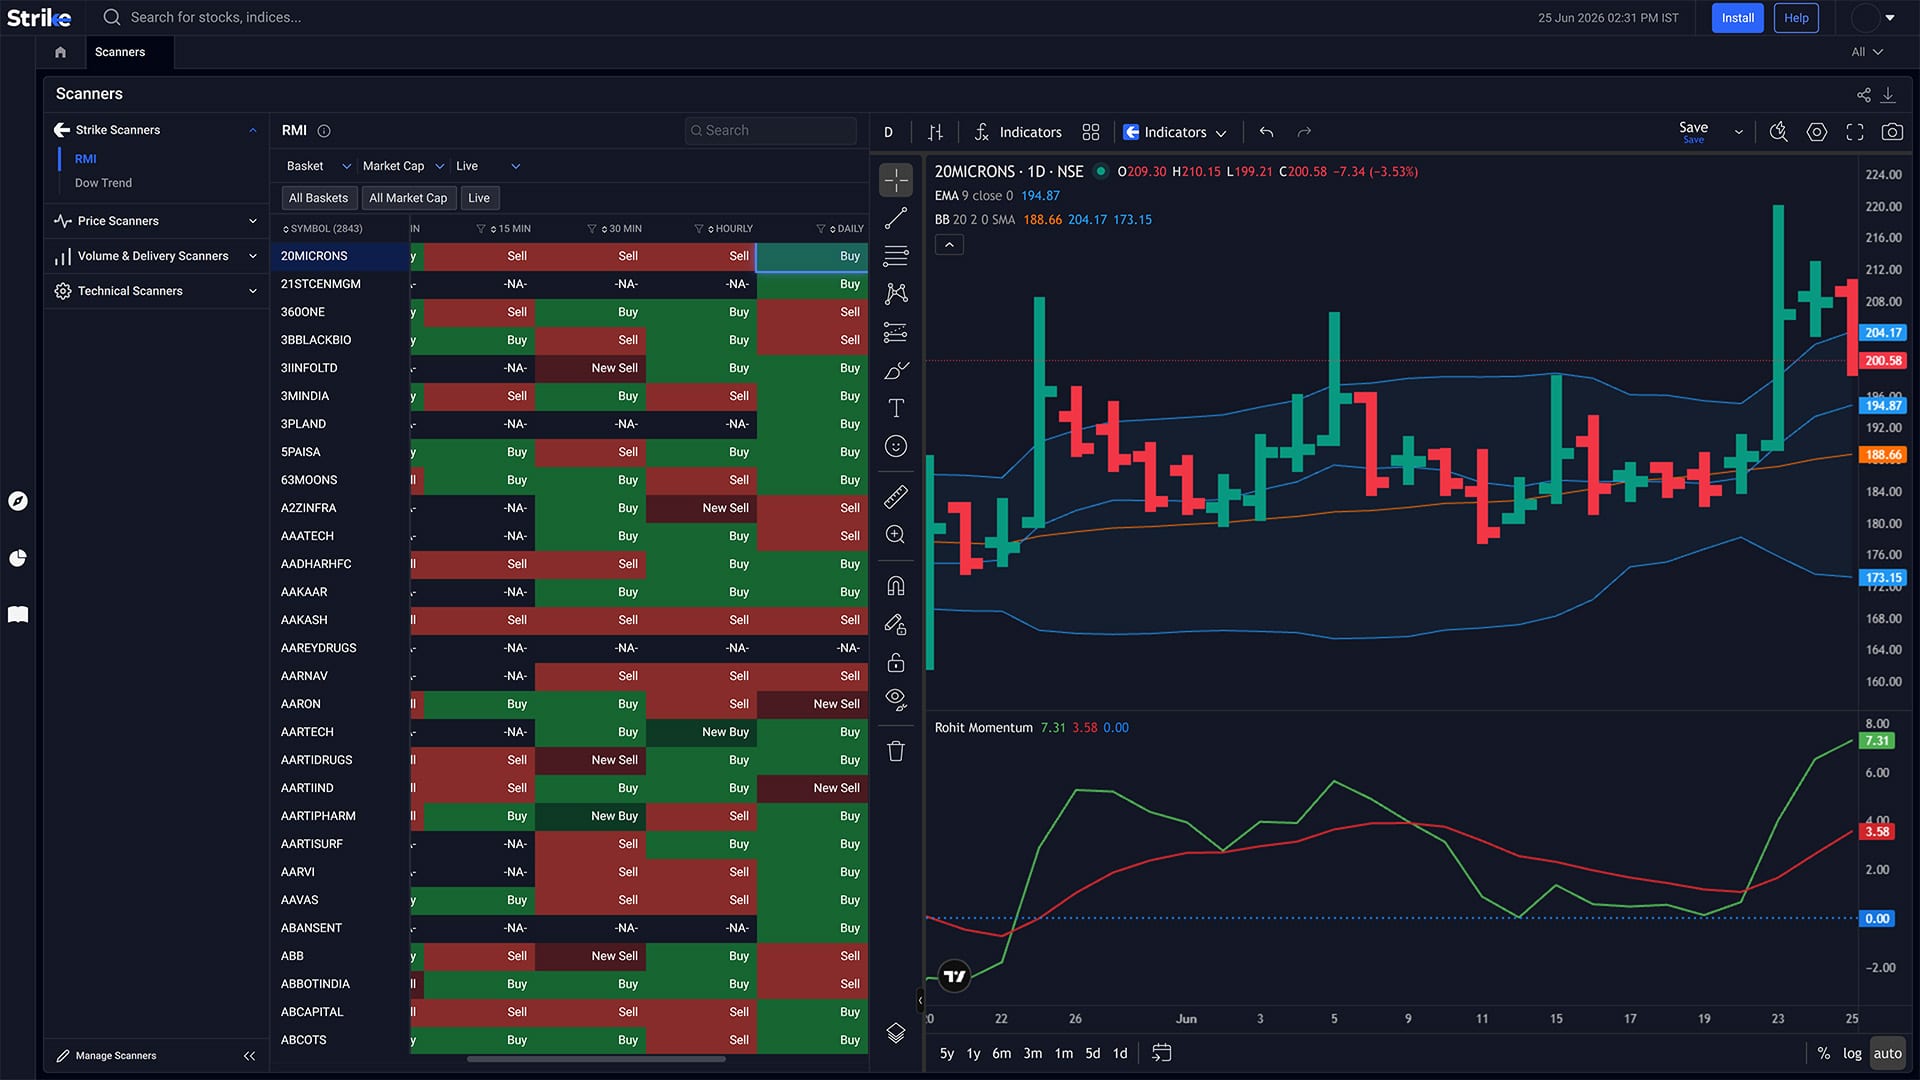


Powerful RMI Capabilities
Everything you need to track momentum, trend shifts, and trade timing

Momentum-Based Buy & Sell Signals
Generate clear buy and sell signals based on momentum changes, helping traders make timely entry and exit decisions.

Multi-Timeframe Analysis
Analyze momentum across different timeframes to align short-term trades with broader market trends

Momentum Screening
Quickly identify stocks with strong positive or negative momentum for swing trading, positional trading, and trend-following strategies.
Momentum Intelligence Through RMI Views
Track momentum shifts, trend strength, and buy-sell signals using the Rohit Momentum Indicator
 Momentum Scanner
Momentum Scanner helps identify stocks and sectors showing strong positive or negative momentum. It highlights where momentum is building before major price moves become visible.
-
 Momentum rankings
-
Strong movers
-
Early trend detection
 Buy/Sell Signals
Buy & Sell Signals
Buy & Sell Signals generate clear momentum-based trading opportunities using RMI crossovers and trend shifts. This helps traders identify high-probability entry and exit points.
-
Buy signal detection
-
Sell signal alerts
-
Entry & exit timing
 Trend Strength
 Analysis
Trend Strength Analysis measures the quality and sustainability of a trend using RMI momentum readings. It helps traders distinguish strong trends from weak or choppy market conditions.
-
Trend quality assessment
-
Strength confirmation
-
Weak trend filtering

How Strike RMI Works
From momentum calculation to actionable signals in three simple steps
Analyze Momentum
RMI calculates price momentum using mathematically derived formulas to identify potential bullish and bearish shifts before they become obvious on charts.
Generate Signals
The indicator generates buy and sell signals based on momentum changes. Users can adjust settings and parameters to better suit different market conditions and trading styles.
Confirm & Validate
Use RMI signals alongside RSI, trendlines, moving averages, and price action to filter false signals and improve trading decisions. Signals are indicative in nature and require additional analysis before taking trades.
Explore All Features
Professional-grade tools built to analyze market movements and trading opportunities in real time

Advanced Scanners
Filter stocks using price, volume, technical indicators, and patterns. Returns setups that match defined conditions without manual chart checks.
Explore Advanced scanners →

Futures & Options
Access open interest, volume, and long-short data across indices and stocks. Helps read position buildup and derivative activity.
Explore Futures & Options →

Sentiment Indicators
Analyse market positioning using breadth data, derivatives activity, and momentum signals across stocks and indices.
Explore Sentiment Indicators →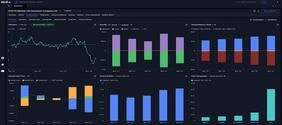

Stocks & Indices
View price trends, financial data, and technical indicators together. Compare performance across timeframes and track index movement.
Explore Stocks & Indices →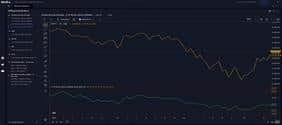

Diffusion Indicators
Measure percentage of stocks aligned with trend or momentum signals. Shows whether market moves have broad participation.
Explore Diffusion Indicators →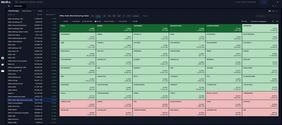

Interactive Heatmaps
Visualise sector and stock movement using percentage change and market cap weight. Highlights where gains or declines are concentrated.
Explore Interactive Heatmaps →

IPO Tracker
Track upcoming and active IPOs with issue dates, price bands, lot sizes, and subscription data across investor categories.
Explore IPO Tracker →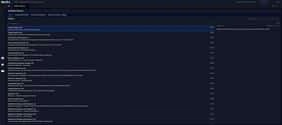

Bulletin Board
View news, announcements, corporate actions, and deal activity together. Helps link market events with price movement.
Explore Bulletin Board →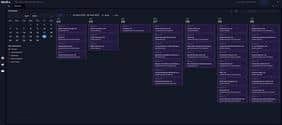

Market Calendar
Track earnings, IPOs, and economic events by date. Useful for planning trades around scheduled market triggers.
Explore Market Calendar →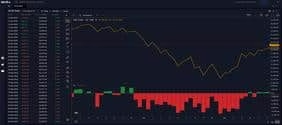

FII DII Data
Track institutional buying and selling across cash and derivatives segments. Shows changes in exposure by FIIs and DIIs.
Explore FII DII Data →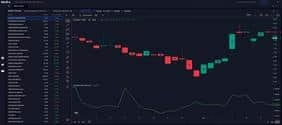

Ratio Charts
Compare stocks or sectors using price ratios. Helps identify relative strength and shifts in outperformance over time.
Explore Ratio Charts →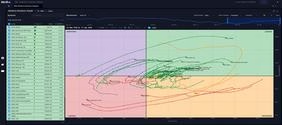

RRG
Plots relative strength and momentum against each other; shows clockwise rotation between leading, weakening, lagging, and improving quadrants.
Explore RRG →Frequently Asked Questions
The Rohit Momentum Indicator (RMI) is a momentum-based technical indicator designed to identify potential buy and sell opportunities by measuring changes in price momentum. It helps traders detect emerging trends and momentum shifts before they become obvious in price action.
RMI generates signals based on changes in momentum and trend strength. A buy signal typically occurs when momentum turns positive, while a sell signal occurs when momentum weakens or turns negative. These signals are designed to help traders identify potential entry and exit points.
Like all technical indicators, the performance of RMI can vary across different market environments. It generally performs best in trending markets and may generate false or frequent signals during highly volatile or sideways market conditions. Users may need to adjust parameters based on their trading style and market conditions.
No. RMI signals should ideally be combined with other technical tools such as RSI, Moving Averages, Trendlines, Support & Resistance levels, and Price Action analysis. Using multiple confirmations can help reduce false signals and improve trading decisions.
No. RMI signals are indicative and are not investment recommendations. They highlight securities where momentum conditions suggest a possible move, but traders should perform additional technical and risk analysis before taking any position. No indicator can guarantee winning trades in every market condition.
What Our Traders Say

Mr. Ayush
5.0
Working Professional


Vinit Baro
5.0
Working Professional


Nitin Prajapati
5.0
Working Professional


Manish Setia
5.0
Investor
Why Traders Love Our RMI

Spot Momentum Before Price Moves
Price trends often begin with momentum shifts. RMI helps traders identify strengthening or weakening momentum early, giving them a chance to act before major moves become obvious.

Clear Buy & Sell Signals
Instead of manually interpreting multiple indicators, RMI generates straightforward buy and sell signals based on momentum changes, making trade identification faster and more systematic.

Filter Out Market Noise
Short-term price fluctuations can be distracting. RMI focuses on meaningful momentum changes, helping traders stay focused on higher-probability opportunities rather than every market swing.

Better Trade Timing
Finding the right stock is only half the battle. RMI helps traders improve entry and exit timing by highlighting momentum turning points and trend transitions.
Strike
PROFESSIONAL TRADING PLATFORM
Join thousands of traders worldwide
Join 50K+ traders receiving our exclusive newsletter with market analysis, trading strategies, and actionable insights.

Expert insights on market trends and opportunities
Proven techniques from professional traders
Comprehensive beginner to advanced trading guide
Be the first to read our latest articles
"Strike's newsletter completely transformed my trading approach. The insights are invaluable!"
— Amit Sharma, Active Trader50K+
Active Traders
$2.5B+
Trading Volume
150+
Markets Covered
24/7
Support Available