
FII DII Data
Track Institutional Activity in the Market
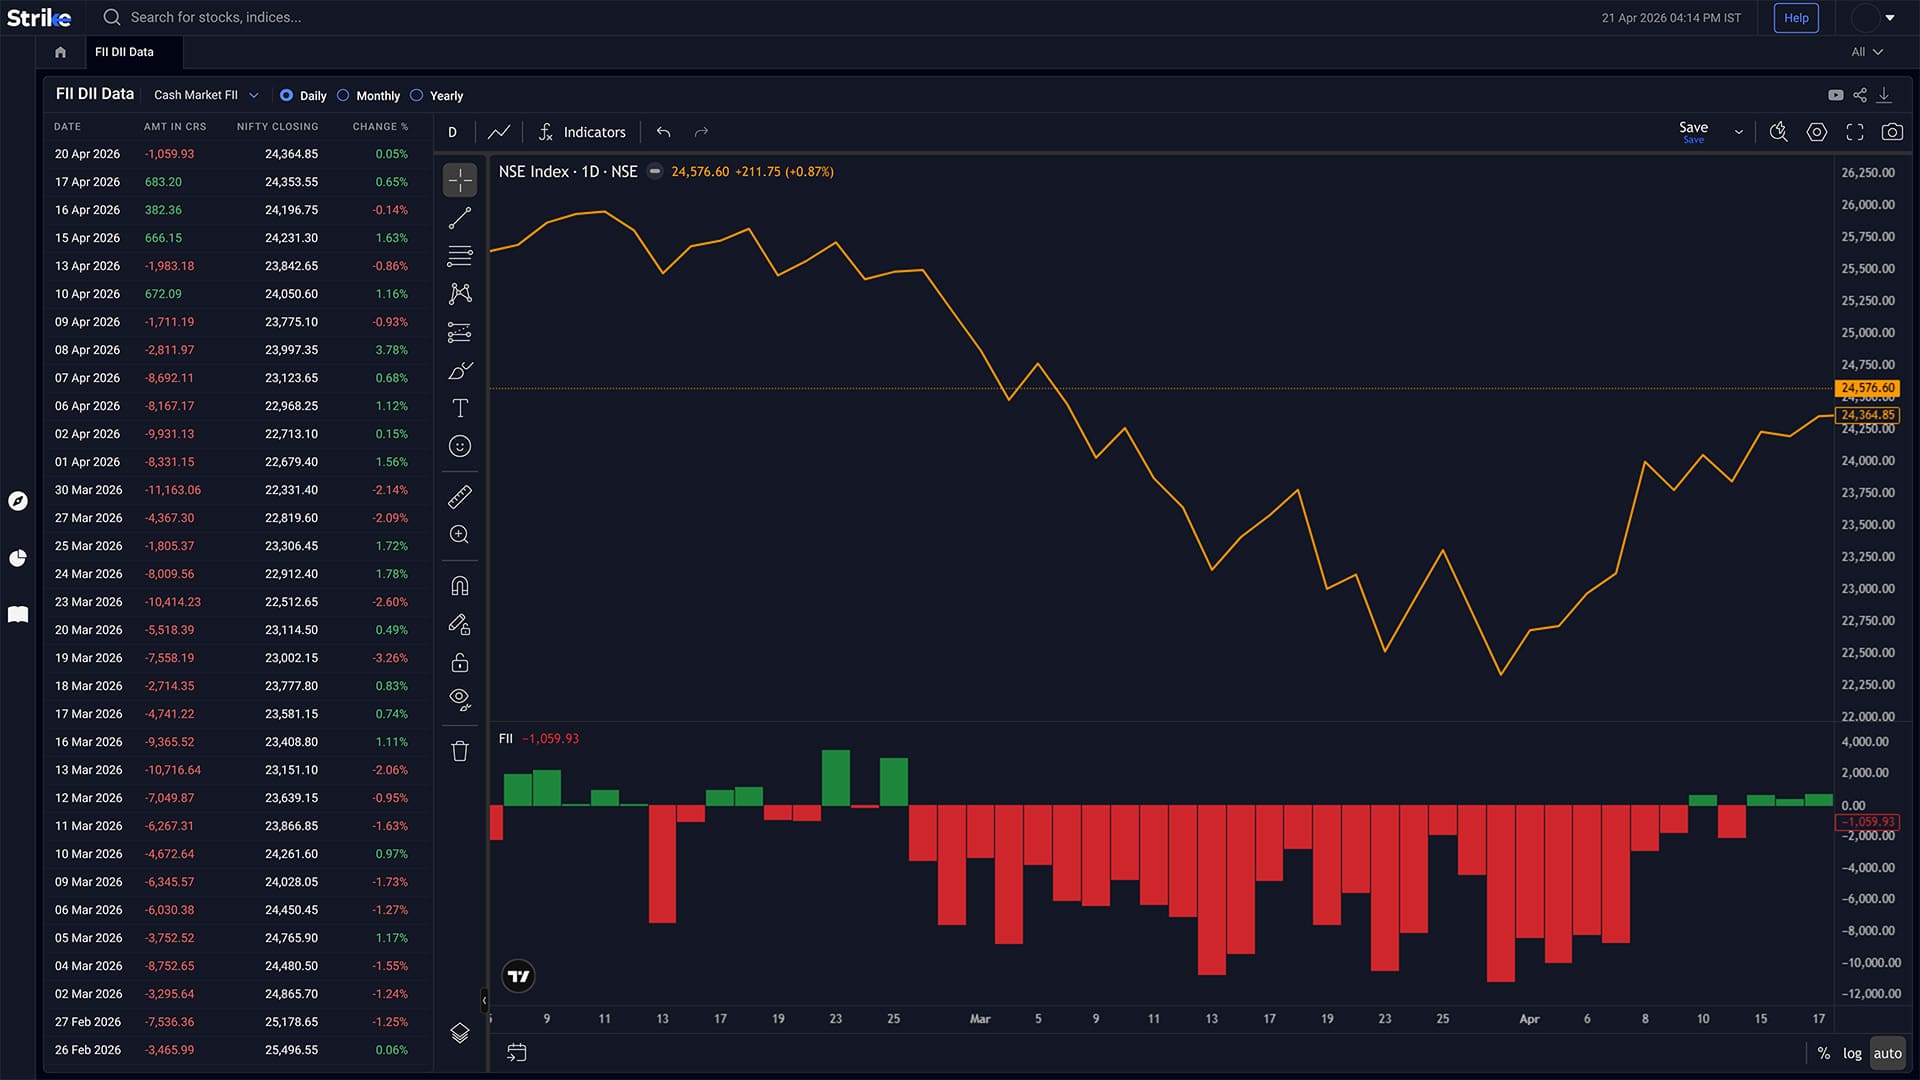
FII DII Data tracks institutional buying and selling across cash and derivatives segments. It helps you see how large players are positioning, not just how price is moving.


Powerful Institutional Data Capabilities
Everything you need to understand where institutional money is moving

Flow Tracking
See net buying and selling from FIIs and DIIs across sessions, not just one-day activity.

Cash & Derivatives View
Track flows in both equity markets and derivatives to understand broader positioning.

Positioning Context
Understand whether institutions are adding exposure, reducing it, or offsetting each other.
Institutional Flows Across Markets
Understand how FIIs and DIIs are positioning capital
 Foreign Flows
Cash Market FII
Cash Market FII shows whether foreign investors are net buyers or sellers in equities on a given day. Over a few sessions, these flows start to show up in how the broader market behaves
-
 Net buy / sell flows
-
Stock-level activity
-
Market direction bias
 Domestic Flows
Cash Market DII
Cash Market DII tracks domestic institutional activity in equities. DIIs often absorb selling during corrections or add exposure during declines, which shows up clearly in this data.
-
Net buying / selling
-
Counter-flow activity
-
Support zones
 Derivatives Positioning
Derivatives Data
Derivatives Data shows how FIIs and DIIs are positioned in futures and options. It includes long-short exposure, index vs stock positioning, and changes in open interest.
-
FII
-
Pro
-
DII

How Strike FII DII Data Works
From flows to positioning insight in three simple steps
View Flows
Check daily and cumulative buying or selling from FIIs and DIIs across cash and derivatives segments.
Compare Activity
See how foreign and domestic flows interact - whether they’re aligned or moving in opposite directions.
Read Positioning
Use these patterns to understand broader market bias instead of relying only on price movement.
Explore All Features
Professional-grade tools built to analyze market movements and trading opportunities in real time

Advanced Scanners
Filter stocks using price, volume, technical indicators, and patterns. Returns setups that match defined conditions without manual chart checks.
Explore Advanced scanners →

Futures & Options
Access open interest, volume, and long-short data across indices and stocks. Helps read position buildup and derivative activity.
Explore Futures & Options →

Sentiment Indicators
Analyse market positioning using breadth data, derivatives activity, and momentum signals across stocks and indices.
Explore Sentiment Indicators →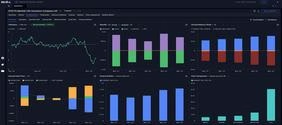

Stocks & Indices
View price trends, financial data, and technical indicators together. Compare performance across timeframes and track index movement.
Explore Stocks & Indices →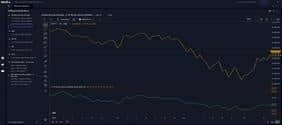

Diffusion Indicators
Measure percentage of stocks aligned with trend or momentum signals. Shows whether market moves have broad participation.
Explore Diffusion Indicators →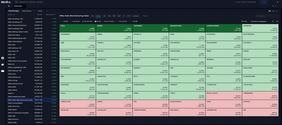

Interactive Heatmaps
Visualise sector and stock movement using percentage change and market cap weight. Highlights where gains or declines are concentrated.
Explore Interactive Heatmaps →

IPO Tracker
Track upcoming and active IPOs with issue dates, price bands, lot sizes, and subscription data across investor categories.
Explore IPO Tracker →

Bulletin Board
View news, announcements, corporate actions, and deal activity together. Helps link market events with price movement.
Explore Bulletin Board →

Market Calendar
Track earnings, IPOs, and economic events by date. Useful for planning trades around scheduled market triggers.
Explore Market Calendar →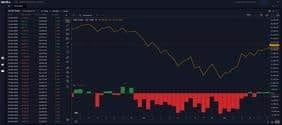

FII DII Data
Track institutional buying and selling across cash and derivatives segments. Shows changes in exposure by FIIs and DIIs.
Explore FII DII Data →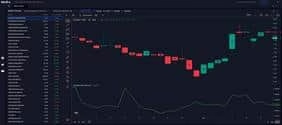

Ratio Charts
Compare stocks or sectors using price ratios. Helps identify relative strength and shifts in outperformance over time.
Explore Ratio Charts →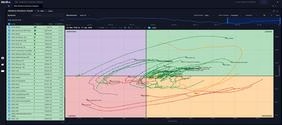

RRG
Plots relative strength and momentum against each other; shows clockwise rotation between leading, weakening, lagging, and improving quadrants.
Explore RRG →Frequently Asked Questions
It’s a record of how foreign and domestic institutions are buying or selling in the market. This includes both cash market trades and derivatives positioning. You’re basically looking at where large pools of capital are moving, whether they’re adding exposure, reducing it, or staying neutral.
Because institutional flows tend to move markets over time. For example, consistent FII selling in the cash market can put pressure on indices, even if individual stocks look stable. On the other hand, strong DII buying sometimes offsets that selling, which is why markets don’t always fall as expected.
It shows whether FIIs are buying or selling in the cash market on a given day. When this stays on the buy side for a few sessions, it usually lines up with strength in the market. When the selling continues, especially across multiple days, you’ll see that pressure reflects on the indices as well.
DII data tracks domestic institutional flows - mutual funds, insurance companies, and other local players. There are phases where DIIs consistently buy during dips while FIIs sell. You’ll notice this especially during corrections, where domestic flows provide some level of stability.
It shows how FIIs and DIIs are positioned in futures and options - longs, shorts, index exposure, stock exposure, along with changes in open interest. For instance, if short positions start building up in index futures while long positions reduce, it usually means positioning is shifting on the downside.
It’s more useful as background than a direct trigger. Say the market is moving up, but institutional exposure isn’t increasing alongside it - that’s something people usually pay attention to. On the other hand, when buying shows up consistently across sessions, it tends to support the move better.
Not in a direct way. This data moves slower and is usually tracked over a few days rather than within a single session. Intraday traders might still glance at it, but it’s not what they base entries on.
What Our Traders Say

Mr. Ayush
5.0
Working Professional


Vinit Baro
5.0
Working Professional


Nitin Prajapati
5.0
Working Professional


Manish Setia
5.0
Investor

Why Traders Love Our FII DII Data

See What Institutions Are Doing
Instead of relying only on price, you can see whether FIIs and DIIs are buying, selling, or staying on the sidelines. That alone changes how you read a move.

Understand Flow Behind Moves
Sometimes price moves look strong, but the flows don’t really support it. When buying or selling shows up consistently, the move tends to hold better.

Better Context Over Time
When you follow flows across a few sessions, patterns start forming whether institutions are adding exposure or gradually pulling back.

Less Guesswork, More Clarity
You have a clearer sense of how large capital is positioned behind the scenes, which makes decisions feel a bit more grounded.
Strike
PROFESSIONAL TRADING PLATFORM
Join thousands of traders worldwide
Join 50K+ traders receiving our exclusive newsletter with market analysis, trading strategies, and actionable insights.

Expert insights on market trends and opportunities
Proven techniques from professional traders
Comprehensive beginner to advanced trading guide
Be the first to read our latest articles
"Strike's newsletter completely transformed my trading approach. The insights are invaluable!"
— Amit Sharma, Active Trader50K+
Active Traders
$2.5B+
Trading Volume
150+
Markets Covered
24/7
Support Available