
Stock Scanners
Find your next winning trade in seconds!
Stock Scanners filter stocks using structured conditions like price movement, volume activity, indicators, and patterns, so you’re only looking at setups that match your custom criteria.
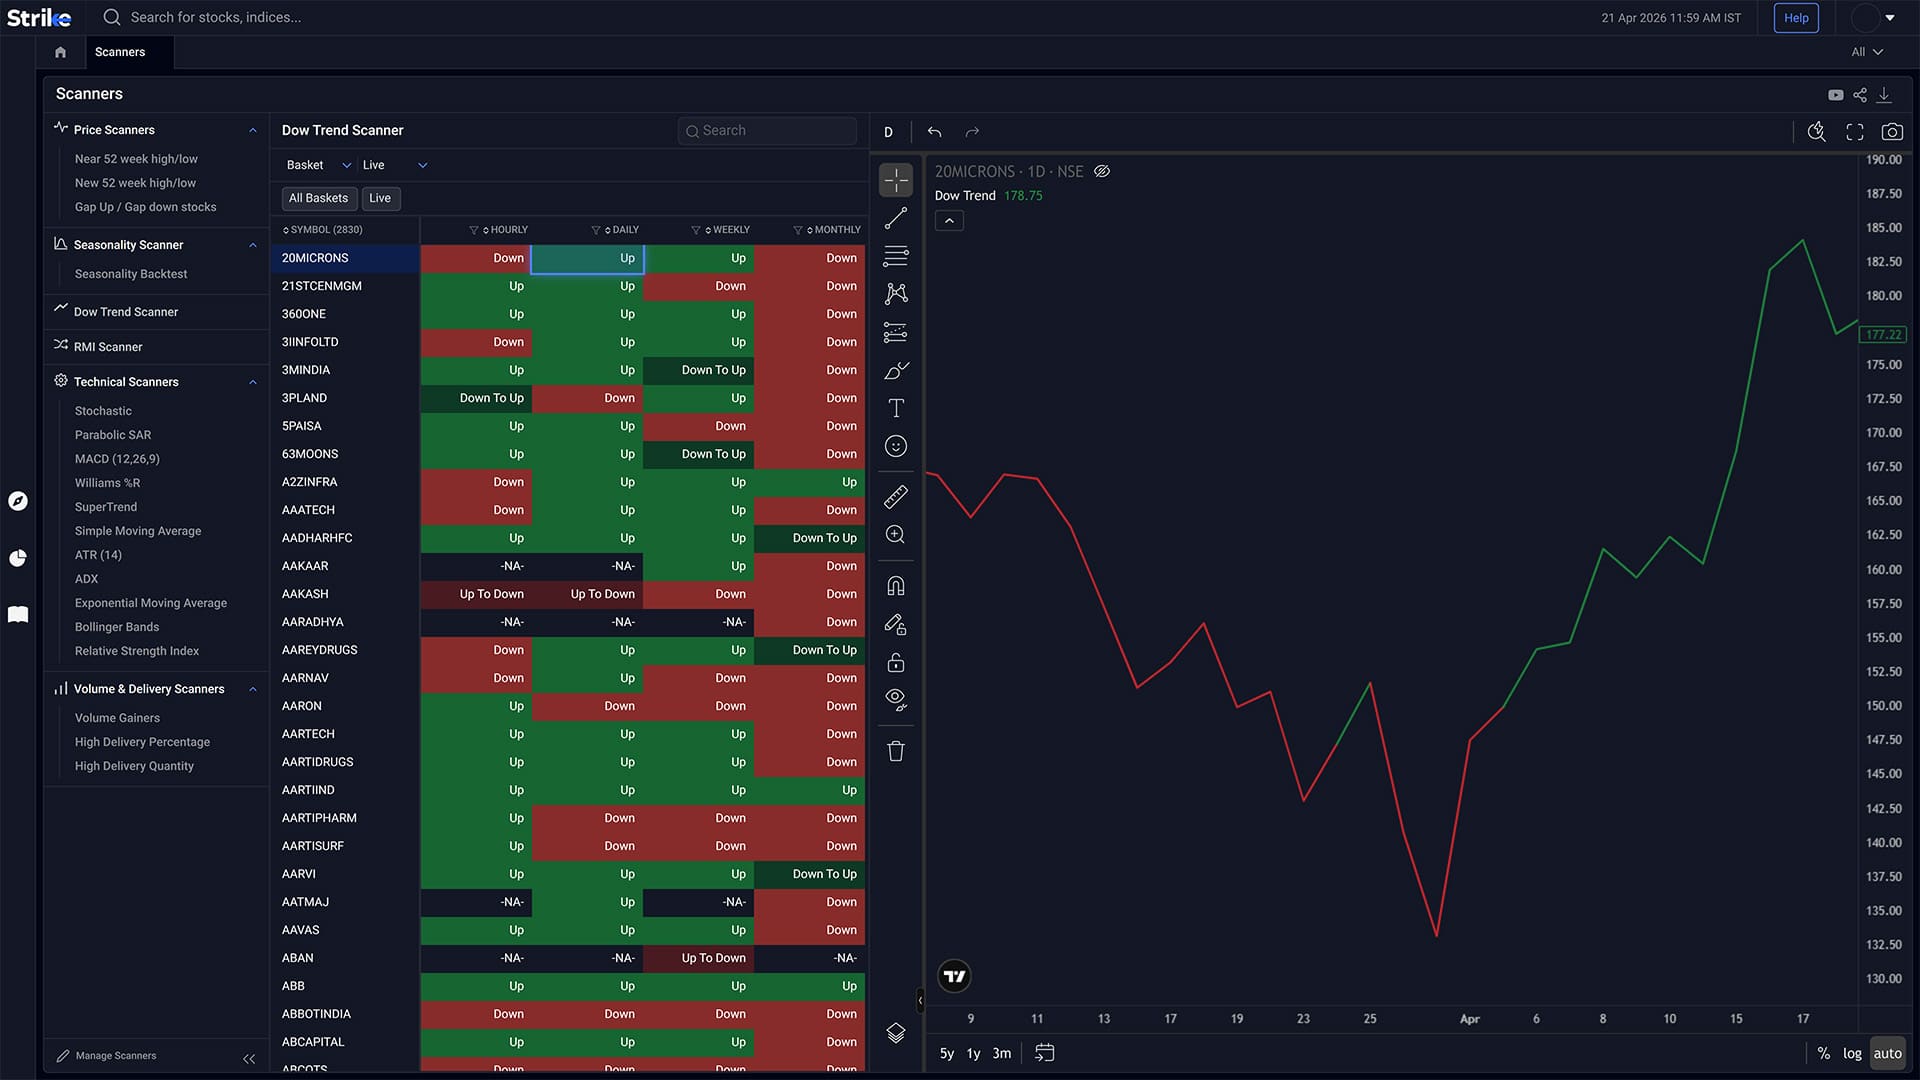


Powerful Scanning Capabilities
Everything you need to identify winning trades before they happen

Custom Filters
Build scans using multiple conditions across price, volume, indicators, and patterns to match specific trading setups.

Multi-Condition Logic
Combine multiple filters within a single scan to refine results and avoid broad, low-quality stock lists.

Pre-Built Scan Library
Access ready-made scans for breakouts, volume activity, and technical setups without building conditions from scratch.
Pre-Built Scanners with Custom Filters
Access ready-made scans or create your own setups
 Price Signals
Price Scanners
Price Scanners track stocks showing breakouts, gap movements, and price expansion around key levels like highs, lows, and intraday ranges
-
 Near 52 week high/low
-
Near 52 Week High/Low
-
Gap Up / Gap down stocks
 Volume Activity
Volumes & Delivery Scanner
Volumes & Delivery Scanners track volume spikes, delivery percentage shifts, and abnormal traded quantity patterns to identify sustained participation and position buildup.
-
Volume Gainers
-
High Delivery Percentage
-
High Delivery Quantity
 Technical Setups
Technical Scanners
Technical Scanners filter stocks using RSI, MACD, moving averages, and crossover-based conditions to identify trend continuation or reversal setups.
-
Stochastic
-
Parabolic SAR
-
MACD (12,26,9)
-
Williams %R
 Pattern Signals
Candlestick Scanners
Candlestick Scanners detect price patterns like Doji, Engulfing, and Hammer to identify reversal and continuation setups in real time.
-
Doji
-
Engulfing
-
Hammer
 Momentum Signals
RMI
RMI scanner tracks momentum shifts using Rohit Momentum Indicator across multiple timeframes, highlighting early strength or weakness before price moves expand.
-
Hourly Buy / Sell
-
Daily Buy / Sell
-
Weekly Buy / Sell
-
Monthly Buy / Sell
 Trend Structure
Dow Trend
Dow Trend Scanners identify higher highs, higher lows, lower highs, and lower lows to define directional trend structure using Dow Theory principles.
-
Monthly High/Low
-
Weekly High/Low
-
Daily High/Low
-
Hourly High/Low
 Seasonal Trends
Seasonality
Seasonality Scanners highlight stocks with recurring monthly or quarterly return patterns based on historical data.
-
Seasonality backtest
-
Annualised Return
-
Average Return
-
Max Gain

How Strike Stock Scanners Work
From filters to setups in three simple steps
Set Conditions
You can define filters using price levels, volume thresholds, indicators, and pattern-based criteria to match specific trading setups.
Run Scans
Our system scans across stocks in real time, continuously updating results as price, volume, and indicator conditions change during market movements.
Review Setups
Validate your scan results using charts, indicators, and recent price behaviour before acting, since scans highlight opportunities but don’t confirm movements.
Explore All Features
Professional-grade tools built to analyze market movements and trading opportunities in real time

Advanced scanners
Filter stocks using price, volume, technical indicators, and patterns. Returns setups that match defined conditions without manual chart checks.
Explore Advanced scanners →

Futures & Options
Access open interest, volume, and long-short data across indices and stocks. Helps read position buildup and derivative activity.
Explore Futures & Options →

Sentiment Indicators
Analyse market positioning using breadth data, derivatives activity, and momentum signals across stocks and indices.
Explore Sentiment Indicators →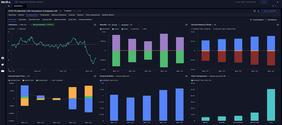

Stocks & Indices
View price trends, financial data, and technical indicators together. Compare performance across timeframes and track index movement.
Explore Stocks & Indices →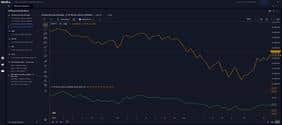

Diffusion Indicators
Measure percentage of stocks aligned with trend or momentum signals. Shows whether market moves have broad participation.
Explore Diffusion Indicators →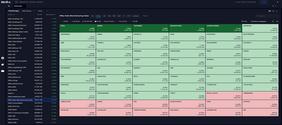

Interactive Heatmaps
Visualise sector and stock movement using percentage change and market cap weight. Highlights where gains or declines are concentrated.
Explore Interactive Heatmaps →

IPO Tracker
Track upcoming and active IPOs with issue dates, price bands, lot sizes, and subscription data across investor categories.
Explore IPO Tracker →

Bulletin Board
View news, announcements, corporate actions, and deal activity together. Helps link market events with price movement.
Explore Bulletin Board →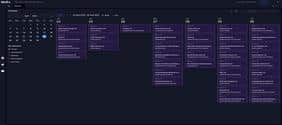

Market Calendar
Track earnings, IPOs, and economic events by date. Useful for planning trades around scheduled market triggers.
Explore Market Calendar →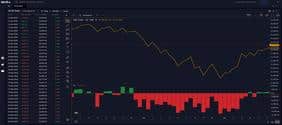

FII DII Data
Track institutional buying and selling across cash and derivatives segments. Shows changes in exposure by FIIs and DIIs.
Explore FII DII Data →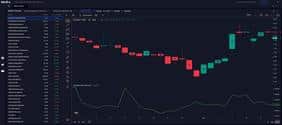

Ratio Charts
Compare stocks or sectors using price ratios. Helps identify relative strength and shifts in outperformance over time.
Explore Ratio Charts →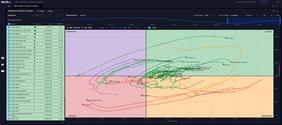

RRG
Plots relative strength and momentum against each other; shows clockwise rotation between leading, weakening, lagging, and improving quadrants.
Explore RRG →Frequently Asked Questions
A Stock Scanner filters stocks using predefined conditions like price levels, volume activity, or indicator signals. Instead of reviewing stocks manually, it returns only those that meet your criteria at that moment.
Stock Scanners apply filters to live market data. For example, you can scan for stocks where price is above a moving average and volume exceeds its recent average. The system processes these conditions and returns matching stocks.
Filters include price-based signals such as breakouts or gaps, volume and delivery data, technical indicators like RSI or MACD, candlestick patterns, and momentum or trend-based conditions.
Yes. Intraday traders use scanners to track volume spikes, price breakouts, and pattern formations during market hours. Since results update in real time, setups can be tracked as they form.
What Our Traders Say

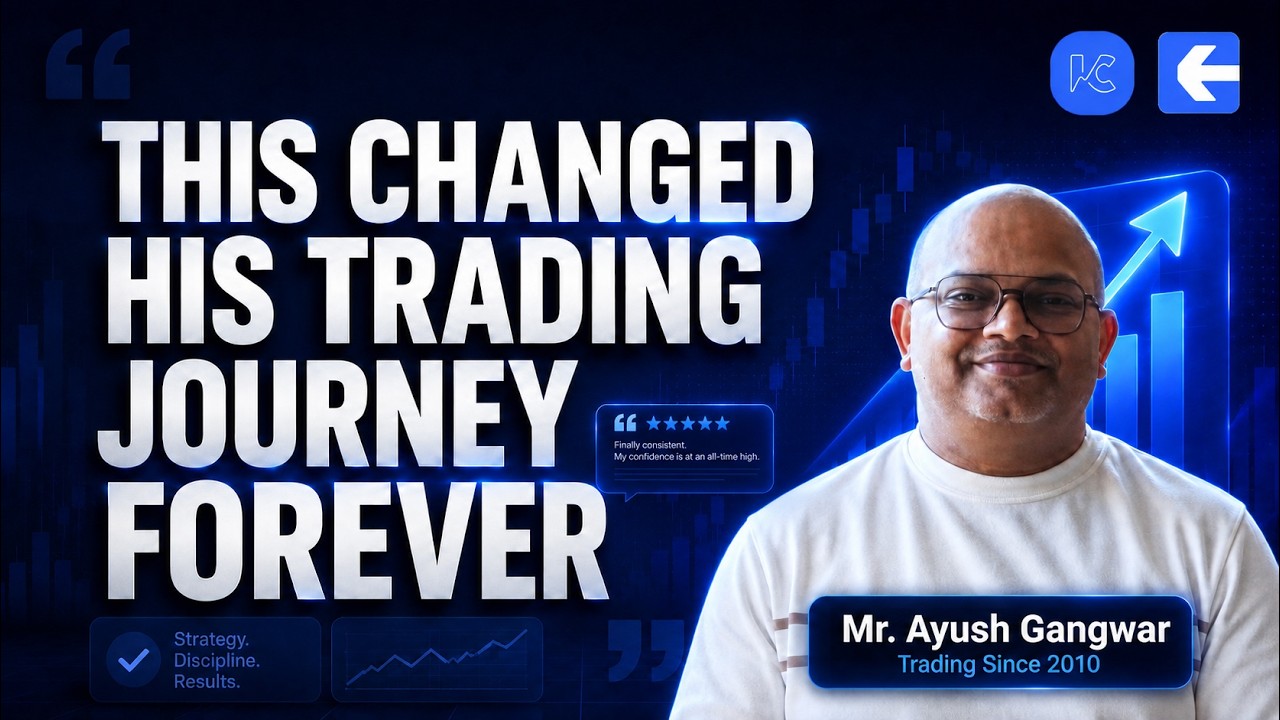
Mr. Ayush
5.0
Working Professional

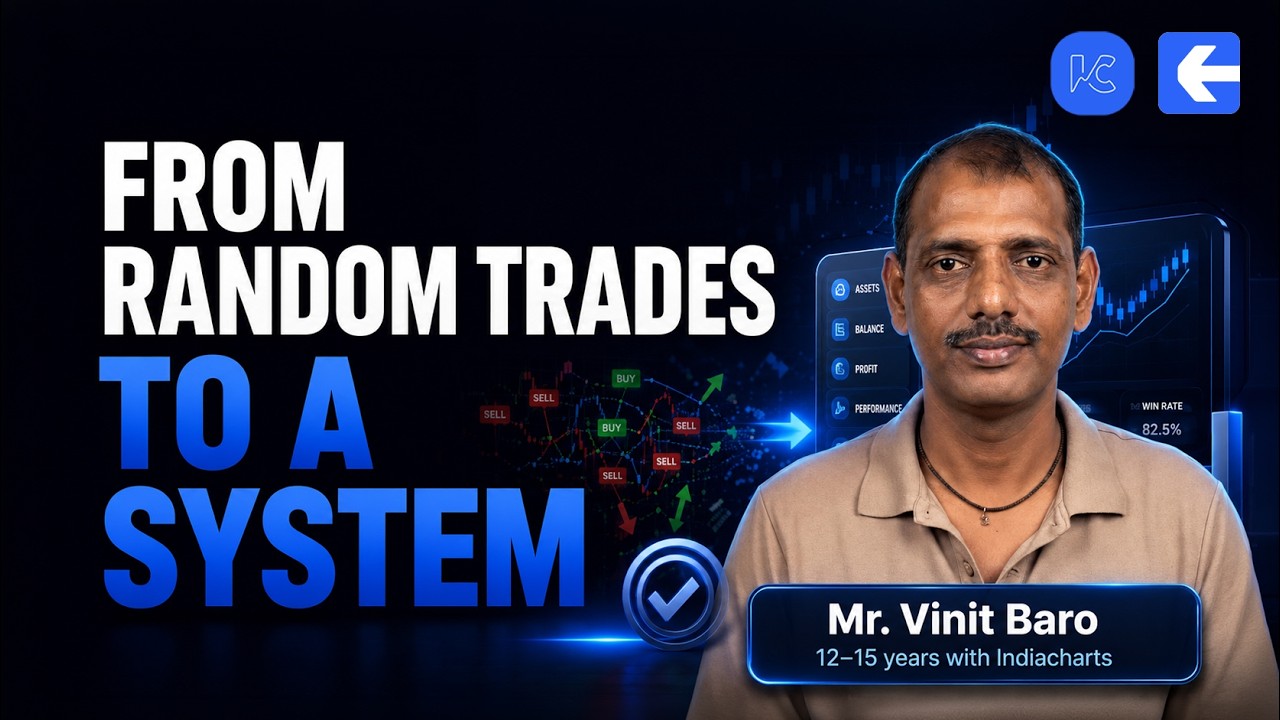
Vinit Baro
5.0
Working Professional

Nitin Prajapati
5.0
Working Professional


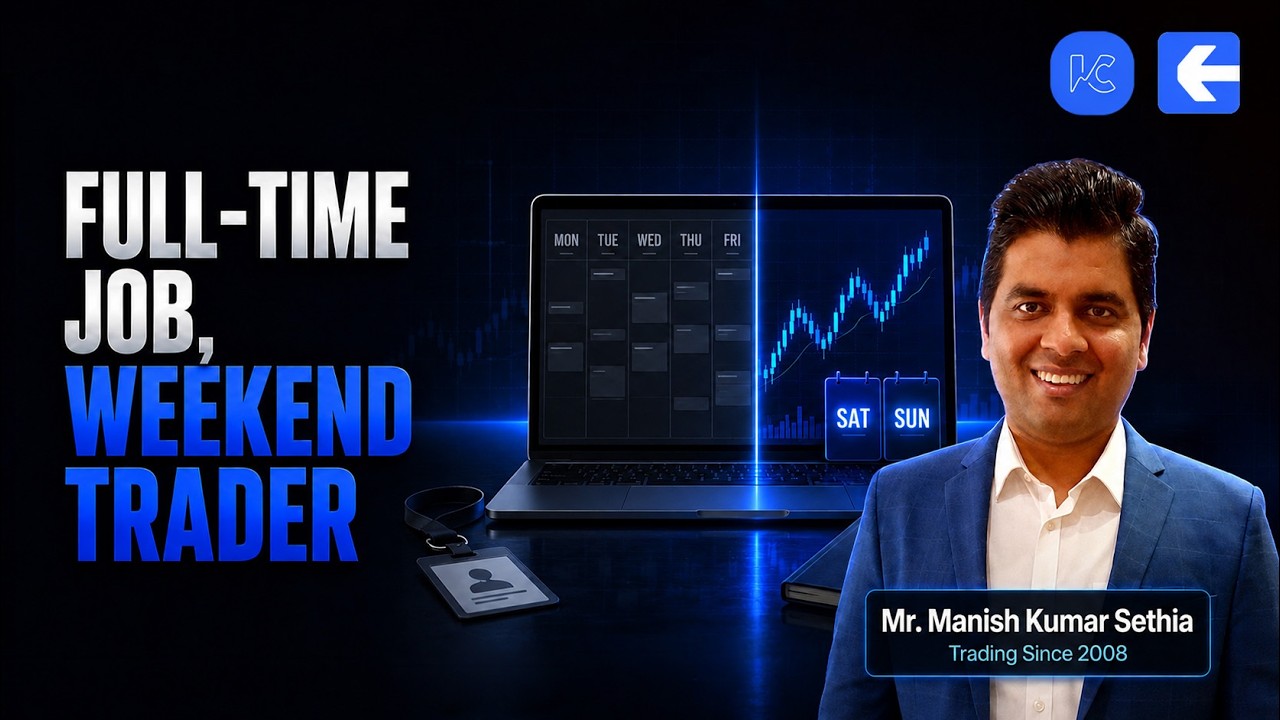
Manish Setia
5.0
Investor
Why Traders Love Our Stock Scanners

Faster Discovery
Instead of going through chart after chart, you just set what you’re looking for and the list shows up. Saves a lot of time, especially during market hours.

Structured Filtering
You can combine price, volume, indicators whatever matters to you and the results stay focused. It’s not random, it’s closer to how you actually think about setups.

Real-Time Updates
As the market moves, the scan keeps updating. So if something starts forming, you’ll catch it while it’s happening, not after it’s already moved.

Consistent Process
Once you set your conditions, you’re following the same process every time. Makes it easier to avoid impulsive trades and stick to what you planned.
Strike
PROFESSIONAL TRADING PLATFORM
Join thousands of traders worldwide
Get Market Insights Delivered Quickly
Join 100,000+ traders receiving our exclusive newsletter with market analysis, trading strategies, and actionable insights.

Expert insights on market trends and opportunities
Proven techniques from professional traders
Comprehensive beginner to advanced trading guide
Be the first to read our latest articles
"Strike's newsletter completely transformed my trading approach. The insights are invaluable!"
— Amit Sharma, Active Trader50K+
Active Traders
$2.5B+
Trading Volume
150+
Markets Covered
24/7
Support Available