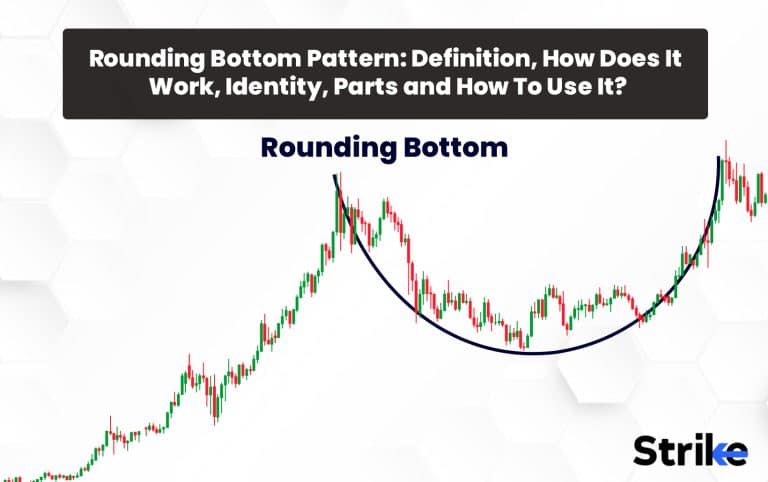
The Rounding Bottom Pattern is a long-term reversal pattern that is best suited for weekly charts. The Rounding Bottom Pattern is also referred to as a Saucer Bottom. The rounding bottom represents a long consolidation period that turns from a bearish bias to a bullish bias. The Rounding Bottom Pattern is used in technical analysis to signal the potential end of a downtrend. The Rounding Bottom Pattern consists of a rounded bottom-like shape. The Rounding Bottom pattern consists of a gradual, rounded decline in price followed by a gradual, rounded increase in price. The Rounding Bottom pattern is considered complete once the price finally breaks and closes above the neckline. The neckline connects the two highest points of the stock price during the trading period. A rounding bottom is a chart pattern used in technical analysis and is identified by a series of price movements that graphically form the shape of a “U”.
The strongest confirmation of the pattern comes from the volume indicator. A valid rounding bottom starts with higher volumes during the decline, flat volumes during the range, and increasing volumes at the reversal. The rounding bottom pattern has strong bullish potential. The rounding bottom pattern indicates a positive market reversal. It represents a long consolidation period that turns from a bearish bias to a bullish bias. We can usually see this pattern at the end of an extended downward trend. The bullish confirmation comes when the pattern breaks above the reaction high that marked the beginning of the decline at the start of the pattern. You can find the Rounding Bottom candlestick after the u shape is formed and neckline resistance is drawn. The Rounding Bottom is a bullish bottom reversal chart pattern that signals the end of a downward trend and the beginning of a new upward trend.
What is the Rounding Bottom Pattern?
The Rounding Bottom Pattern signals the end of a downtrend and the possible start of an uptrend. This means that the rounded bottom can indicate an opportunity to go long. The traders would only look to enter the market when the neckline of the Rounding Bottom Pattern is broken. A reversal pattern is when the stock price starts going in the opposite direction as compared to the one before.

Rounding bottom is one such reversal pattern that works completely opposite to the Rounding Top Pattern. Price and volume are considered key indicators for identifying and confirming this pattern. The rounding bottom pattern can last for days, weeks, months, or years with longer time frames. Generally, this pattern is an indication of a bullish future for the assets traded. The Rounding Bottom Pattern has a relatively high success rate but it is rarely found.
The main difference between both patterns is a bearish pullback at the neckline in the cup and handle chart pattern. The 3 benefits of this pattern. Firstly, it gives an early indication of a trend reversal. Secondly, safeguard the traders from selling in a potentially unfavourable market that they trade-in. Lastly, it gives buyers a clue about when to enter the market for maximum profit.
How Does the Rounding Bottom Pattern Work?
The rounding bottom pattern has the visual resemblance of a bowl-like appearance. The Rounding Bottom Pattern represents a gradual price shift by investors from bearish to bullish. The best confirmation of the pattern comes from the volume, which confirms a rounding bottom with high volumes during the decline, then flat volumes during the middle range, and higher volumes again as the price increases. The market behavior behind the formation of The Rounding Bottom Pattern is inverse to that of The Rounding Top Pattern. A rounding top is a chart pattern used in technical analysis identified by price movements that have the shape of an upside-down “U.” The stock price continues to fall during the beginning of the formation of this pattern. The reason is the lack of buyers for the stock in the market.

The traders start showing interest as the price of the stock falls. This reduces the pace of the price decline. The price will stabilize for a time as more buyers start showing interest in this stock. The stock price starts increasing due to the increased rate of buying. The buyer’s willingness to pay a higher price for the stock tends to start the uptrend. This ultimately gives the Rounding Bottom Pattern a “U” shape. The key to identifying this chart pattern is to view it in a timeframe that is five times larger than the one that you are trading at the current time. View the formation on a weekly chart if you want to trade on a daily chart. View the pattern on a thirty-minute chart if you want to trade on a 5 min chart.
The rate of the decline will begin to slow down as the stock trend lowers. Then the range pattern ultimately shifts into a slow, gradual increase. This increase ultimately leads to a bullish move. The expected price of the Rounding Bottom Pattern move equals the size of the pattern. The Rounding Bottom Pattern has six main components.
Prior trend. The base of a Rounding Bottom will signify a new low for the reversal pattern to exist. This is registered months before it actually happens.
Decline. The first part of the rounding bottom is the decline. This decline can appear in different forms. Investors trade with a high number of highs and lows, while others trade lower in a straight line.
Low. The low part of the rounding bottom can take the form of a ‘V’ bottom, but it should not appear too sharp and must take some weeks to develop. The chance of the selling climax appears and can ultimately form a lower spike, since prices are in a long-duration decline.
Advance. The advance off for the lows makes up the right half of the pattern and would require about the same duration of time as the prior decline. The credibility of a rounding bottom is a problem that is noted as an advancement, if the advance appears too sharp.
Breakout. Bullish affirmation exists when the Rounding Bottom Pattern breaks at the top of the reaction high, which shows the beginning of the decline at the initial stage of the pattern.
The Volume of the trade. The volume levels will denote the image of the Rounding Bottom. Volume levels are not very significant on the decline, but there should be an addition in volume on the advance and a suitable breakout.
These 6 are the main components of the Rounding Bottom Pattern. Rounding bottoms are found at the end of extended downward trends and signify a reversal in long-term price movements.
How can traders use the rounding bottom pattern for Potential Trades?
There are 6 main steps on how to trade using the Rounding Bottom Pattern. They are as follows.
The first step is to confirm the Rounded Bottom Figure. The trader needs to find a price decrease, which slowly switches to a range followed by a price increase for confirming the pattern.
The second step is identifying The Bottom Neck Line. The trader needs to draw a horizontal line across the top of the bearish and bullish curves to form the neckline. After the trader identifies the pattern, the neckline should be drawn by the trader.
The third step is the Rounded Bottom Breakout. The rounded bottom breakout happens when the price penetrates the neckline in a bullish direction. This strength should display itself in the form of price expansion and increased volume.
The fourth step is Round Bottom Trade Entry. A trader should look to get long once the stock is able to break through the neckline.
The fifth step involves Round Bottom Stop Loss. The trader can quickly exit the position and look for better trading opportunities if the stock goes below the stop loss
The sixth step is the Rounding Bottom Target. The minimum target for the pattern is equal to the size of the pattern when added to the breakout. The trader should look to exit the position when the price hits the target.
You need to be patient when trading with a Rounding Top Pattern as it can take quite a long time to develop. The Rounding Bottom Pattern is formed when the price of security decreases to a new low, then moves horizontally, and finally increases. Thus, it takes the shape of a rounding bottom. The Rounding Bottom Pattern can safeguard traders from selling in a potentially unfavorable market after being identified correctly. It helps the traders take advantage of huge profits.
How to Identify a Rounding Bottom Pattern?
The Rounded bottom seems to be one of the profitable setups, but identifying it is risky. The strongest confirmation for the Rounding Bottom Pattern comes when the volume indicator shows high volumes on the decline, flat volume on the range, and increasing volumes on the reversal.
The strength is shown as it crosses through the neckline. The strength will display itself in the form of price expansion and increased volume. This is how a trader can identify the Rounding Bottom Pattern and utilise it to maximise their profit by trading. The rounding bottom pattern is given by the visual resemblance of a bowl-like appearance, so it is easy to identify graphically. The rounding pattern is a bullish four-line pattern on the line-break chart.

The WAVES/USDT pair in the above figure showcases a round bounding bottom pattern with its base support at $11.8 and the range resistance at $19. A bullish breakout from this barrier drove the altcoin 80% higher to hit $34.8.
This ‘U’-shaped pattern is seen only in the weekly and higher charts. It will resemble a bowl shape when the minor lows of the pattern are interconnected to each other. This would create a ‘bump’ -like structure near the middle of the pattern. A vertical line drawn through the lowest point in the bowl will divide the Rounding bottom pattern into two equal halves.
What Does the Rounding Bottom Pattern Indicate?
A rounding bottom when it comes to stock charts indicates a positive market reversal, meaning investor expectations and momentum (i.e. sentiment) are gradually shifting from bearish to bullish. It is a pausing pattern which allows the stock to consolidate before it builds enough energy to move up in price. This Rounding pattern is an excellent tool for a trader to identify the stock chart pattern. The expected price move in the Rounding Bottom Pattern is equal to the size of the pattern itself.
A Rounding Bottom Pattern is a technical analysis that indicates the price of an asset or commodity will move in a specific direction. This indication helps the traders buy and sell their stocks accordingly to gain more profit.
What are the Parts of the Rounding Bottom Pattern?
The Rounding Bottom Pattern represents a long consolidation period that turns from a bearish bias to a bullish bias. The Rounded Bottom signals that the current downtrend is about to finish and that there is a possibility of a new uptrend to come. It resembles a clear “U” image. There are 7 main parts included in The Rounding Bottom Pattern.
Decline. The first portion of the Rounding Bottom Pattern is the decline that leads to the low of the pattern.
Low. The low of the Rounding Bottom Pattern is similar to a “V” or “U” bottom, but it should not be too sharp and should take a few weeks to form.
Advance. The advance off of the lows forms the right half of the pattern and should take about the same amount of time as the decline that took place before.
Breakout. Bullish confirmation comes when the pattern breaks above the reaction high that marked the beginning of the decline at the start of the pattern. Look for the neckline that is marked on the chart to successfully trade in this pattern. You can then enter the market with a buy order once the price breaks through and a candle closes above the neckline.
Volume. Volume levels are not that significant on the decline, but there should be an increase in volume on the advance and preferably on the breakout. It represents the idea of the Rounding Bottom Pattern.
Target. Add the height of the rounded bottom to the breakout point for an estimated upside target.
Stop Loss. The stop loss is placed below the neckline of the pattern. There is less chance of this pattern’s functionality when the price trades below this point. It’s better to exit the market to prevent any loss of capital.
These 7 parts form the Rounding Bottom Pattern. Rounding bottoms are found at the end of extended downward trends and signify a reversal in long-term price movements and form a “U” shape In the graph.
How To Trade Using The Rounding Bottom Pattern?
The Rounding Bottom pattern is a technical analysis pattern used in trading to identify potential trend reversals in a security or asset. The primary step is to identify a potential Rounded Bottom pattern. The neckline is the connection between the two highest points in the stock price in a given period of time. After drawing the neckline, the trader will be confirming the formation of Round Bottom Breakout.
Then the trader should enter the long trade on the breakout. Put a stop loss in the middle of the pattern to minimise the loss if the stock price falls unexpectedly After entering the long trade. The minimum target for the pattern should be equal to the size of the pattern when added to the breakout. Look for exiting the market after attaining the maximum profit. Long side istaken for trading in the Rounding Bottom Pattern after the breakout of the neckline when the Rounding Bottom Pattern is in the formation.
The Price Objective for the same will be the height of the rounding bottom to the neckline (if the pattern is completed). The stop loss for the same is determined after the completion of the pattern. Given below are the steps to trade using the Rounding Bottom Pattern.
Firstly, identify price consolidation in the U shape following a temporary downward trend.
Secondly, find a resistance neckline with at least two failed attempts to break above the line.
Thirdly, add another technical analysis tool to confirm the trend reversal – Fibonacci retracements, RSI, and MACD.
Fourthly, enter a long position when the breakout occurs. It’s advisable to wait for the first candle following the breakout to close above the neckline.
Lastly, set a stop-loss order at the lowest level of the rounding bottom formation.
Remember, technical analysis patterns like the Rounding Bottom are not guaranteed to be accurate, and it is always wise to combine them with other tools and indicators for confirmation.
What are the Benefits of Rounding Bottom Pattern?
The Rounding Bottom Pattern offers potential benefits for traders and investors. The top 7 benefits of The Rounding Bottom pattern are given below.
- The first and most important benefit of the Rounding Bottom pattern is that it can predict the bullish and bearish nature of the Stock Market. This prediction helps a trader understand the nature of the stock and invest accordingly to maximise profit.
- A true understanding of the Rounding Bottom Pattern helps the trader get an early indication of a trend reversal in the stock they have invested in or are planning to invest in.
- The Rounding Bottom Pattern helps the trader to find the proper time to enter or exit a stock.
- The Rounding Bottom Pattern safeguards the traders from selling in a potentially unfavourable market that they trade in and helps in favourable capital returns.
- Recognising the Rounding Bottom Pattern will help a trader gain a competitive advantage in the market, and using it will increase the value of the trader’s future technical analysis.
- Identifying The Rounding Bottom Pattern helps the trader distinguish the Rounding Bottom Pattern from the stock breakdown.
- The Rounding Bottom Pattern Provides information on the open, close, high, and low prices for a specified period. It is easy to read and interpret. The Rounding Bottom Pattern represents the most fundamental data needed to make decisions.
These are the main 7 benefits of trading in the Rounding Bottom Pattern. The Rounding Bottom chart pattern is a sign of a positive market reversal, meaning investor expectations and momentum or market sentiment are gradually shifting from bearish to bullish.
What are the limitations of the Rounding Bottom Pattern?
The primary disadvantage to trading in The Rounding Bottom chart patterns is the risk of a false breakout. This happens when the price moves outside the pattern but immediately returns within it or to the other side. Unfortunately, it can occur multiple times before the pattern experiences a breakout and a continuation or a reversal occurs.
- The trouble with the Rounding Bottom Pattern is that it causes their followers to change their opinions so frequently. The chart services change like the wind. The Rounding Bottom Pattern shifts fast. It changes buy and sell signals in little time confusing the traders.
- Too much reliance on The Rounding Bottom Pattern makes the traders lazy and ignorant.
- The Rounding Bottom Pattern is limited to studying market trends and lacks the ability to deep-dive into an instrument or an industry to understand its workings.
- The Rounding Bottom Pattern tells you the market moves upwards, the market can go downwards and vice versa.
- Stock patterns like the Rounding Bottom Pattern exclude important elements like corporate reports, economic releases, and outside events that have an impact on the share price of the company because they are based on mathematically based market data.
A share can have a substantial move already taken place by the time The Rounding Bottom Pattern is identified using technical analysis. The risk-to-reward ratio for the individuals will be lower compared to before since the share has already made a large move.
When Should be the Right Time to Start the Trade for Rounding Bottom Pattern?
Aggressive and short-term traders should prefer entering a position in the Rounding Bottom Pattern when the price breaks above the neckline without further confirmation. The newbie traders should prefer long trading when the price breaks through and a candle closes above the neckline. Enter the market with a buy order. The stop loss should be placed above the neckline of the pattern. It’s better to exit the market at this moment when the price trades below this point, the chances of the pattern’s functionality are very less.
What Do Traders Think About the Rounding Bottom Pattern?
The Rounding Bottom Pattern is a technical setup for the patient trader. Traders nowadays use The Rounding Bottom Pattern to understand the nature of the stock they are invested in or interested in. The traders see the Rounding Bottom Pattern as a fundamental technical analysis technique that helps traders use past price actions as a guide for potential future market movements. Technical analysts and chartists seek to identify the Rounding Bottom Pattern to anticipate the future direction of a security’s price. The traders see the Rounding Bottom Pattern as a powerful and useful instrument in understanding trade patterns to maximize their profit.
What are the examples of a Rounding Bottom Pattern?
3 major examples of the Rounding Bottom Pattern is given below.

The above graph is an example of The Rounding Bottom Pattern. It is the graphical representation of NZD/CAD (New Zealand Dollar, Canadian Dollar) – Daily Timeframe.

The above graph is another example of The Rounding Bottom Pattern. It is the graphical representation of the EUR/CHF (EURO – Swiss Franc) – Daily Timeframe.

AMGN provides an example of a rounding bottom among other chart patterns that formed after a long consolidation period. Throughout 1996, the stock traded in a tight range from 16.63 to 12.83. The trading range continued during the first half of 1997, and the stock broke by falling to a low of 12 in August.
Draw a line across the top of the bearish trend and the bullish trend before the breakout occurs to construct the Rounding Bottom Pattern. Then measure the distance between the neckline and the lowest point of the pattern. This distance is the size of the rounding bottom pattern.
How Do You Describe a Rounding Bottom Reversal?
The Rounding Bottom pattern is a bottom reversal pattern. This pattern is an indication of the end of the downtrend and the potential beginning of an uptrend. Price and volume are considered key indicators for identifying and confirming this pattern. The rounded bottom pattern is better identified using technical indicators. This pattern is recognised by the shape it forms. The trend is always changing from bearish to bullish in the Rounding Bottom Reversal. The Rounding bottom is one such reversal pattern that works completely opposite to the rounding top pattern. In the Rounding Bottom Reversal, the stock price is going in the opposite direction as compared to the Top Bottom Pattern. The rounding bottom is a reversal chart pattern that develops after a price decline.
Can I Use the Rounding Bottom Pattern to Identify a Potential Bearish Trend?
No, traders cannot use The Rounding Bottom Pattern to identify a potential bearish trend. The potential of The Rounding Bottom Pattern is bullish. The Rounding Bottom Pattern represents a long consolidation period that turns from a bearish bias to a bullish bias. The Rounding Bottom Pattern is the technical analysis that indicates the price of an asset or commodity will move in a specific direction. It occurs when the price rises over time but then falls and forms a bottom. This pattern signals that the existing downtrend is about to finish and the possibility of an uptrend is about to commence. This pattern is focused on the bullish trend and indicates the bullish nature of the stock.
Does The Rounding Bottom Signals a Bullish Trend?
Yes. The Rounding Bottom Pattern indicates the Bullish trend of the Stock. The Rounding Bottom Pattern is typically followed by a reversal upward in price i.e. bullish nature. The Rounding Bottom Pattern has strong bullish potential. The expected price moves equal the size of the pattern.
What is the Similarity between the Rounding Bottom Pattern and the Cup and Handle Pattern?
A Rounding Bottom Pattern looks similar to the cup and handle pattern but does not experience the temporary downward trend of the “handle” portion. The Cup and Handle Pattern is the same as The Rounding Bottom Pattern; the only difference is that the Rounding Bottom lacks a downward trend that makes up the handle. The cup and handle pattern is essentially traded the same way as the rounding bottom. There is a slight bearish pullback before the price breaks out in the Cup and Handle Pattern. Both The Rounding Bottom Pattern and The Cup and Handle Pattern are bullish but The Cup and Handle Pattern have a bearish correction forming a handle-like structure.

Given above is a real trade example of the Cup and Handle Pattern. This is the daily chart of General Motors from April through May, 2016. The Cup and Handle Pattern was developed by William O’Neil and introduced in his 1988 book. The “U” pattern is similar in both The Rounding Bottom Pattern and The Cup and Handle Pattern. The cup and handle pattern can take weeks or months to form. The handle needs to be smaller than the cup.


 Previous Article


![15 Investing.com Alternatives [Free+Paid] You Should Use in 2026](https://www.strike.money/wp-content/uploads/2026/04/Investing.com-Alternatives.jpg "15 Investing.com Alternatives [Free+Paid] You Should Use in 2026 60")
![15 TradeStation Alternatives [Free+Paid] You Should Use in 2026](https://www.strike.money/wp-content/uploads/2026/04/TradeStation-Alternatives.jpg "15 TradeStation Alternatives [Free+Paid] You Should Use in 2026 61")
![15 Chartink Alternatives [Free+Paid] You Should Use in 2026](https://www.strike.money/wp-content/uploads/2026/04/Chartlink-Alternatives.jpg "15 Chartink Alternatives [Free+Paid] You Should Use in 2026 62")
: Overview, 10 Types of Indicators, Settings for Different Markets 64")

 : Definition, Formula, calculation, Uses, Advantages Vs limitations 66")


: How We Used This 70/30 Indicator in 6 High Win-rate Strategies 70")


No Comments Yet.