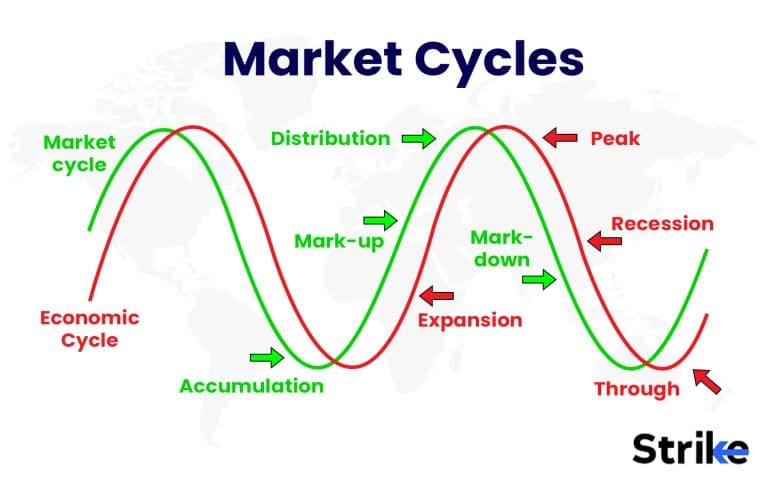
Market cycles in stock markets explain the recurring sequences of accumulation, markup, distribution, and markdown of stock prices. Market cycles are driven by investor psychology and activity. These boom-bust phases comprise the overall cyclicality seen in equity markets over time.
The four market cycles are the accumulation phase, markup phase, distribution phase, and markdown phase. These cycles describe how prices typically behave in financial markets over time as investors alternate between periods of buying and periods of selling.
Identifying market phases is important because it allows investors and traders to anticipate and adapt to changing market conditions. Knowing what phase the market is in helps determine whether to buy, sell or hold investments, and can enable investors to make more informed decisions about adjusting their strategies and portfolio allocations.
What are Market Cycles?
Market cycles are phases of natural ups and downs that happen in the market. Market cycles include the repetitive sequence of market trends and conditions, typically involving accumulation (bull market), mark-up, distribution (bear market), and mark-down phases.
What are the Phases of Market Cycles?
The four phases of market cycles are accumulation, mark-up, distribution, and mark-down phases. Below are more details about the four.
1. Accumulation Phase

The Accumulation Phase is the stage in a market cycle when informed investors start accumulating shares in anticipation of an upcoming bull market. During this phase, prices tend to move sideways or trade within a range after a major bear market decline. Trading volumes are typically low during accumulation as large investors quietly build positions without drawing attention. The accumulation phase presents an opportunity for patient investors to purchase undervalued stocks before the broader market recognizes the shift in trend. The accumulation phase ends when increased buying volume from informed investors is able to overcome selling pressure, signaling the start of a new bull market.
As you see in the chart, the Accumulation Phase occurs after a major downtrend in the stock price, as indicated by the downward arrows at the left. During this phase, informed investors start accumulating shares, driving the price higher in an overall sideways trading range, as depicted by the horizontal arrow labeled “Accumulation Phase.” While the price fluctuates up and down, it trades within a range, building a base. The Ascension Cycle line shows the beginning of the new bull market, where increased buying pressure from large investors is finally able to overcome selling pressure. This signals the end of the Accumulation Phase.
2. Mark-up Phase

The markup phase refers to the period in a market cycle when stock prices are rising steadily from their low point after a bear market. This phase is characterized by investor optimism and confidence, leading to increased buying activity that drives stock prices higher.
Looking at the chart, we see the markup phase represented by the upward slope of the trendline after the bottom of the cycle. The arrow pointing upwards labeled “markup phase” shows prices climbing during this period. As more investors get in on the rally, demand for stocks increases which propels prices higher. The steady ascent of the trendline reflects this steady rise in stock prices. The markup phase continues until stock valuations reach a peak and investor sentiment becomes overly optimistic, at which point the cycle transitions into the distribution phase.
3. Distribution Phase

The distribution phase follows the markup phase and signals the transition from a bull to bear market. During this phase, stock prices start to level off and decline as investor optimism fades and selling activity picks up. With decreased demand, prices steadily fall as more investors look to sell and take profits rather than buy. The downward slope of prices reflects this shift in sentiment from greed and euphoria to anxiety and fear. The distribution phase ultimately leads to the panic selloff that characterizes the bear market phase of the cycle.
4. Mark-down Phase

The mark-down phase follows the distribution phase and signals the shift from a bull to bear market. During this phase, stock prices steadily decline as investor sentiment turns pessimistic and selling activity accelerates. With increased supply and waning demand, stock prices fall progressively lower. The downward sloping trendline on the chart illustrates the continuous drop in valuations during this mark-down period. The phase persists until stock prices are depressed and the market reaches its bottom, leading to the transition into the accumulation phase.
Looking at the chart, we see the markdown phase represented by the downward sloping trendline after the peak of the cycle. The arrow pointing downwards labeled “markdown phase” shows prices declining during this period. As investor sentiment turns pessimistic, selling activity accelerates which drives stock prices progressively lower. The steady descent of the trendline reflects this steady fall in valuations. The markdown phase continues as more investors rush to sell until stock prices are depressed and the market reaches its bottom. This marks the end of the markdown period and the transition into the accumulation phase, as indicated on the chart. The downward slope of the trendline clearly depicts the markdown phase where valuations decline due to negative sentiment and selling pressure in the market.
As depicted in the chart, each phase reflects shifts in investor sentiment that drive prices up or down. Understanding these cyclical phases helps investors appropriately position their portfolios to take advantage of opportunities at different points in the cycle.
How long does a Market Cycle last?
There is no set duration for a market cycle, as it could last anywhere from a few months to several years. This is mainly dependent on the economic factors.
What is an example of a Market Cycle?
One of the most prominent examples of a market cycle is the history of the S&P 500 index. Look at the image below.
This image provides a visual example of market cycles over time. We see that the S&P 500 goes through repeated ups and downs, representing periods of growth and decline. Each peak and trough marks the transition from one market cycle to another.
For instance, in the early 1960s, there was a decline, hitting a trough around 1960. This was followed by a growth period through the mid-1960s, peaking around 1966. Then another decline into the early 1970s, bottoming out around 1974. This pattern continues over the decades, with bull markets giving way to bear markets and back again.
The highest points show the peaks of bull markets, while the lowest points indicate bear market troughs. By looking at the chart, we can identify specific cycles – for example, the huge bull run of the 1990s, the steep decline after the dot-com crash, and the recovery from 2009 to recent years following the financial crisis.
How does a New Market Cycle form?
A new market cycle forms when the previous cycle reaches the end of its natural progression. Typically, a complete market cycle is composed of four distinct phases: accumulation, markup, distribution, and markdown. The cycle ends with the markdown phase, as prices fall and the market hits a trough. This opens the door for a new cycle to take shape.
At the end of a downtrend, informed investors begin to identify bargains and undervalued assets to purchase. Their early accumulation marks the start of a fresh accumulation phase. As more participants recognize the opportunity and prices start to rise, the market enters the markup phase. This leads to a period of distribution, where informed investors start to sell positions. The broad selling accelerates the onset of the markdown phase, and the new cycle is established. Fundamentals like economic trends, investor psychology, and shock events shape the timing and progression of each new cycle.
How to Determine a Market Cycle?
A market cycle is determined by analyzing price trends, investor behaviour, and macroeconomic factors. The different phases are spotted by observing volume patterns, momentum oscillators, and overall investor sentiment over periods of several months or years.
How to use the Market Cycle in the Stock Market?
A trader uses the market cycle in the stock market to predict the market and trade according. A trader identifies one of the four phases of the market and predicts the next. For instance, a trader identifies that the market is currently in the accumulation phase and predicts that the markup phase will come next, characterized by a rise in prices as more investors enter the market. The trader takes a long position to capitalize on the expected uptrend in prices. As the markup phase plays out, the trader monitors indicators like trading volume and momentum oscillators to gauge when the market is approaching the distribution phase. Sensing the upside momentum slowing down, the trader prepares to close long positions and consider opening short positions in anticipation of the next markdown phase, where prices will decline back to the bottom.
What is the Bull Market Cycle?
The Bull Market Cycle is a period of generally rising stock prices that lasts several years, often fueled by positive investor sentiment, a strong economy, and corporate earnings growth.
What is the Bear Market Cycle?
The Bear Market Cycle is a period of declining stock prices that lasts months or years, often triggered by negative investor sentiment, a weakening economy, and deteriorating corporate earnings.
What is the 4-year Market Cycle Theory?
The 4-Year Market Cycle Theory states that stock markets tend to follow a regular 4-year cycle consisting of a bull market for the first 2 years followed by a bear market for the next 2 years.
What is the Presidential Cycle?
The Presidential Cycle is a theory that stock markets tend to perform better in the second half of a US President’s 4-year term and underperform in the first half.


 Previous Article


![15 Investing.com Alternatives [Free+Paid] You Should Use in 2026](https://www.strike.money/wp-content/uploads/2026/04/Investing.com-Alternatives.jpg "15 Investing.com Alternatives [Free+Paid] You Should Use in 2026 52")
![15 TradeStation Alternatives [Free+Paid] You Should Use in 2026](https://www.strike.money/wp-content/uploads/2026/04/TradeStation-Alternatives.jpg "15 TradeStation Alternatives [Free+Paid] You Should Use in 2026 53")
![15 Chartink Alternatives [Free+Paid] You Should Use in 2026](https://www.strike.money/wp-content/uploads/2026/04/Chartlink-Alternatives.jpg "15 Chartink Alternatives [Free+Paid] You Should Use in 2026 54")
: Overview, 10 Types of Indicators, Settings for Different Markets 55")


 : Definition, Formula, calculation, Uses, Advantages Vs limitations 58")


No Comments Yet.