Dead cat bounces Is a market term describing brief price rises that seem like reversals, but aren’t. Dead cat bounces occur in ongoing downturns, much like a falling cat may twitch when it hits yet remains still. It’s important to tell true reversals from false ones for smart investing. But that’s hard in real-time.
The term originated in the mid-1980s when journalists first noted brief recoveries erroneously taken as bottoms, characteristics include short lived, weakness beneath, and downtrend resumption likely from lack of fundamentals change, limitations involve difficulty identifying without hindsight and psychology sometimes misleading short-term sentiment.
By watching volume, resistance, indicators and fundamentals, we get better at spotting when bounces mean continued gains versus just final motions of decline. Understanding what causes them and how to profit when trends are reasserted will provide insight.
What is Dead Cat Bounce?
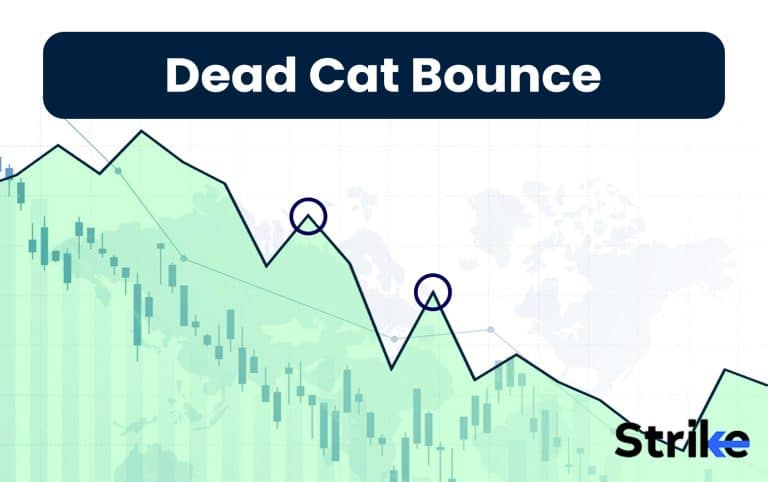
A dead cat bounce is a temporary, short-lived recovery of asset prices from a prolonged decline or a bear market that is followed by the continuation of the downtrend. It refers to a small, brief period of recovery in a falling market that ultimately continues its downward movement. A dead cat bounce typically occurs when traders and investors believe that prices have reached the bottom and the market starts to rise. However, the recovery is not supported by fundamentals and proves to only be temporary before prices resume their downward trajectory. Below is what a dead cat bounce looks like.

In this price chart of Aditya Birla Capital Ltd (ABCAPITAL), you will be able to an overall downward trajectory (marked by arrows) and two points where the price experienced short term bear. These points are marked in a circle. The point here is that the stock price continues to decline after this short period, making it a dead cat bounce.
What does Dead Cat Bounce indicate?
A dead cat bounce indicates that a brief recovery in the market or price of an asset is only temporary and not supported by fundamentals, ultimately leading to a continuation of the downward trend. A dead cat bounce gives the false impression that the bottom has been reached and the market or asset price will now embark on a sustained upside move. However, technical analysts recognize a dead cat bounce as a continuation pattern rather than a trend reversal. It refers to a small, short-lived recovery or rally in a falling market that is followed by the downward movement resuming.
What is the history behind Dead Cat Bounce?
The term “dead cat bounce” originated in the financial industry in the mid-1980s. The earliest known use of the phrase in the news media was in 1985 when journalists referenced a small recovery in the declining stock markets of Singapore and Malaysia as a “dead cat bounce.” The idea behind the term is that even if a dead cat was dropped from a great height, it might briefly bounce upon hitting the ground before settling in its dead state.
In the late 1980s, the phrase began seeing more usage. In 1986, a columnist writing about falling oil prices suggested coining the term on bumper stickers. He explained that recovering oil prices should not be mistaken for renewed stability as an asset was still “dead” like a cat that bounced after falling but did not regain life. Through the 1990s and 2000s, the metaphor spread as analysts commonly referenced brief rebounds during bear markets as dead cat bounces to caution they likely signalled continued downtrends rather than real turnarounds. Today the term is now part of mainstream financial vocabulary used both for individual securities and broader economic recoveries expected to be temporary. Below is the timeline of events.
| Date | Description |
| 1985 | Earliest known use in news media – Singapore and Malaysia stock markets |
| April 1986 | Term used to describe falling oil prices – Raymond DeVoe Jr. |
| Late 1980s | More widespread use by analysts and journalists |
| 1990s | Metaphor used by financial writers for brief rallies |
| 2000s | Increased usage in discussions of bear markets and crashes |
| Today | Standard vocabulary for temporary recoveries |
What are the characteristics of Dead Cat Bounce?
Below are the key characteristics of a dead cat bounce.
- The bounce usually occurs after a severe and prolonged decline in prices.
- Prices rise sharply for a short period, sometimes days or weeks but sometimes extended to a few months.
- The bounce appears at first to reverse the prevailing downward trend but prices quickly resume their decline, often surpassing previous lows.
- It is considered a continuation pattern in technical analysis rather than a trend reversal.
- The bounce is not supported by fundamental improvements and is unsustainable, resulting in the downward trend continuing afterwards.
- It tends to be driven by short-term reactions like traders closing short positions believing the bottom is in or bargain hunting rather than changes in underlying market fundamentals.
The above characters help us understand dead cat bounce better. It is important also to understand that dead cat bounces are often only recognized in hindsight and are difficult to predict in real-time as an unreliable signal of an actual market bottom.
How to identify a Dead Cat Bounce pattern?
A dead cat bounce is difficult to spot. But below are five useful tips.
- The volume during the bounce may be lower than previous rallies, showing weaker buying interest. This indicates the bounce is not being driven by strong fundamental factors.
- The price rise fails to surpass previous resistance levels and levels seen before the downtrend. It also tends to reverse quickly, falling back below lows set just before the bounce.
- Technical indicators like moving averages are not fully crossed to indicate a confirmed change in trend. Momentum also does not shift decidedly into positive territory.
- Fundamentally, the underlying reasons that drove the initial decline have not meaningfully changed. This suggests any recovery is unlikely to hold.
The most important factor here is that the rise in price will not be supported fundamentally or by technical analysis.
How to trade a Dead Cat Bounce?
The best way to trade a Dead Cat Bounce is to wait for the bounce to play out and then short the security as it resumes its downtrend. Let us look at an example of YES BANK during the 2018-2020 time period. Look at the chart below.

The share price of Yes Bank showed the characteristics of a Dead Cat Bounce after an initial negative event. The stock lost around 57% of its value rapidly. Then, early in the year, the price bounced back up somewhat, fueling investor optimism for a recovery. But this rally just turned out to be a temporary blip, not a true reversal of the downtrend. What looked like a revival was actually a Dead Cat Bounce. So in April, the prior downward trajectory continued, and the stock plunged deeply into negative territory once again. Though the brief rally had sparked hopes, it was simply a short-term aberration in an ongoing decline, not a lasting turnaround.
The proper way to trade this setup is to wait patiently for the bounce to fully play out, rather than trying to catch the exact top. Once the rally peters out and selling resumes, confirmation comes when the stock makes a lower high than the prior peak. This signals that the bounce has failed and the downtrend is reasserting itself.
This confirmation occurred in April, when Yes Bank’s price peaked lower than the January highs and proceeded to plunge sharply once again. Savvy traders would look to short Yes Bank around the April peak, with a stop above the prior high. The profit target is a move down to fully retrace the counter-trend bounce. This allows traders to capitalize on the resumption of the downtrend by fading the head fake bounce and benefitting from the stock’s continued decline.
What are some examples of Dead Cat Bounce?
The 2008 financial crisis is one of the noteworthy examples of dead cat bounces. The Dow Jones Industrial Average chart showed a short-lived rally in mid-2008, circled in orange.

This bounce did not indicate a genuine recovery in prices. Rather, it was a false bottom – a Dead Cat Bounce. Some optimistic investors assumed the economy was improving and bought into Dow stocks, artificially propping up demand. This temporary spike in prices can be seen in the chart. However, since it was just a Dead Cat Bounce, the uptrend quickly reversed and prices resumed their downward trajectory shortly after.
Another recent example of a dead cat bounce is the case of Adani. Look at the chart below.

Adani’s stock has seen a V-shaped recovery after steep declines. The bounce comes after a sell-off when sentiment shifts and investors buy again, sparking a short rally before the drop resumes. In Adani’s case, the sell-off followed Hindenburg’s report. But after the dust settled, investors saw value and shares rebounded.
What are the causes of Dead Cat Bounce?
- There are four main reasons why a dead cat bounce could occur. They are listed below.
- Technical factors: A short-term increase in demand from short sellers covering their positions, or buying based on historical support/resistance levels.
- News/events: Temporary boost from any positive but non-fundamental news about the stock that buoys sentiment briefly.
- Market sentiment: If many investors are overly pessimistic after a steep decline, sentiment can rebound quickly but forget the original reasons for the downturn.
- Market manipulation: Large players may engineer a temporary rally to profit by misleading other investors about the overall trend, though fundamentals remain weak.
Apart from these, investors have also noted random dead cat bounces without proper explainable reasons.
What are the limitations of Dead Cat Bounce?
The limitations of dead cat bounce are mainly focused on the difficulty of identifying it. Below are the limitations in detail.
- It is difficult to identify a dead cat bounce in real-time. The only way to truly know it was a dead cat bounce is in hindsight after prices resume their downward trend.
- Technical indicators and analyst predictions are not very reliable for determining if a bounce will continue upwards or reverse. Fundamentals must also be considered.
- The underlying reasons for the initial decline may still exist, making further losses likely even after a brief bounce. Improved company/market conditions need to emerge.
- Investor psychology contributes to dead cat bounces misleading people into believing the bottom is in when it is not. Overly optimistic sentiment persists briefly.
The gist of it is that it is important to understand where a price rise is a reversal or a dead cat bounce before acting on one.
Is Dead Cat Bounce & Market Reversal related?
No, A dead cat bounce is often confused with a market reversal but they are different. While a stock market reversal indicates that a downtrend has ended and an uptrend will follow, a dead cat bounce in the stock market is only a temporary recovery within a continuing downtrend, and prices
Is a Dead Cat Bounce bullish or bearish?
A dead cat bounce is considered a bearish signal, not a bullish one. While the brief price increase during a dead cat bounce may appear to reverse the prevailing downtrend, it is in fact only a temporary recovery before prices resume their downward fall, confirming the continuation of the underlying bearish trend.
How long does a Dead Cat Bounce last?
A dead cat bounce typically lasts only a few days or up to a few weeks before resuming the prevailing downtrend according to the context documents.
What is the opposite of a Dead Cat Bounce?
The opposite of a dead cat bounce is an inverted dead cat bounce. An inverted dead cat bounce is a temporary and often severe sell-off that occurs during an otherwise strong and continuing bull market. Whereas a dead cat bounce signals a continuation of a downtrend, an inverted dead cat bounce represents a brief disruption to an established uptrend.


 Previous Article


![15 Investing.com Alternatives [Free+Paid] You Should Use in 2026](https://www.strike.money/wp-content/uploads/2026/04/Investing.com-Alternatives.jpg "15 Investing.com Alternatives [Free+Paid] You Should Use in 2026 52")
![15 TradeStation Alternatives [Free+Paid] You Should Use in 2026](https://www.strike.money/wp-content/uploads/2026/04/TradeStation-Alternatives.jpg "15 TradeStation Alternatives [Free+Paid] You Should Use in 2026 53")
![15 Chartink Alternatives [Free+Paid] You Should Use in 2026](https://www.strike.money/wp-content/uploads/2026/04/Chartlink-Alternatives.jpg "15 Chartink Alternatives [Free+Paid] You Should Use in 2026 54")
: Overview, 10 Types of Indicators, Settings for Different Markets 56")

 : Definition, Formula, calculation, Uses, Advantages Vs limitations 58")


: How We Used This 70/30 Indicator in 6 High Win-rate Strategies 62")


No Comments Yet.