Stochastic Oscillator: Definition, How it Works, Calculations, Trading, and Benefits
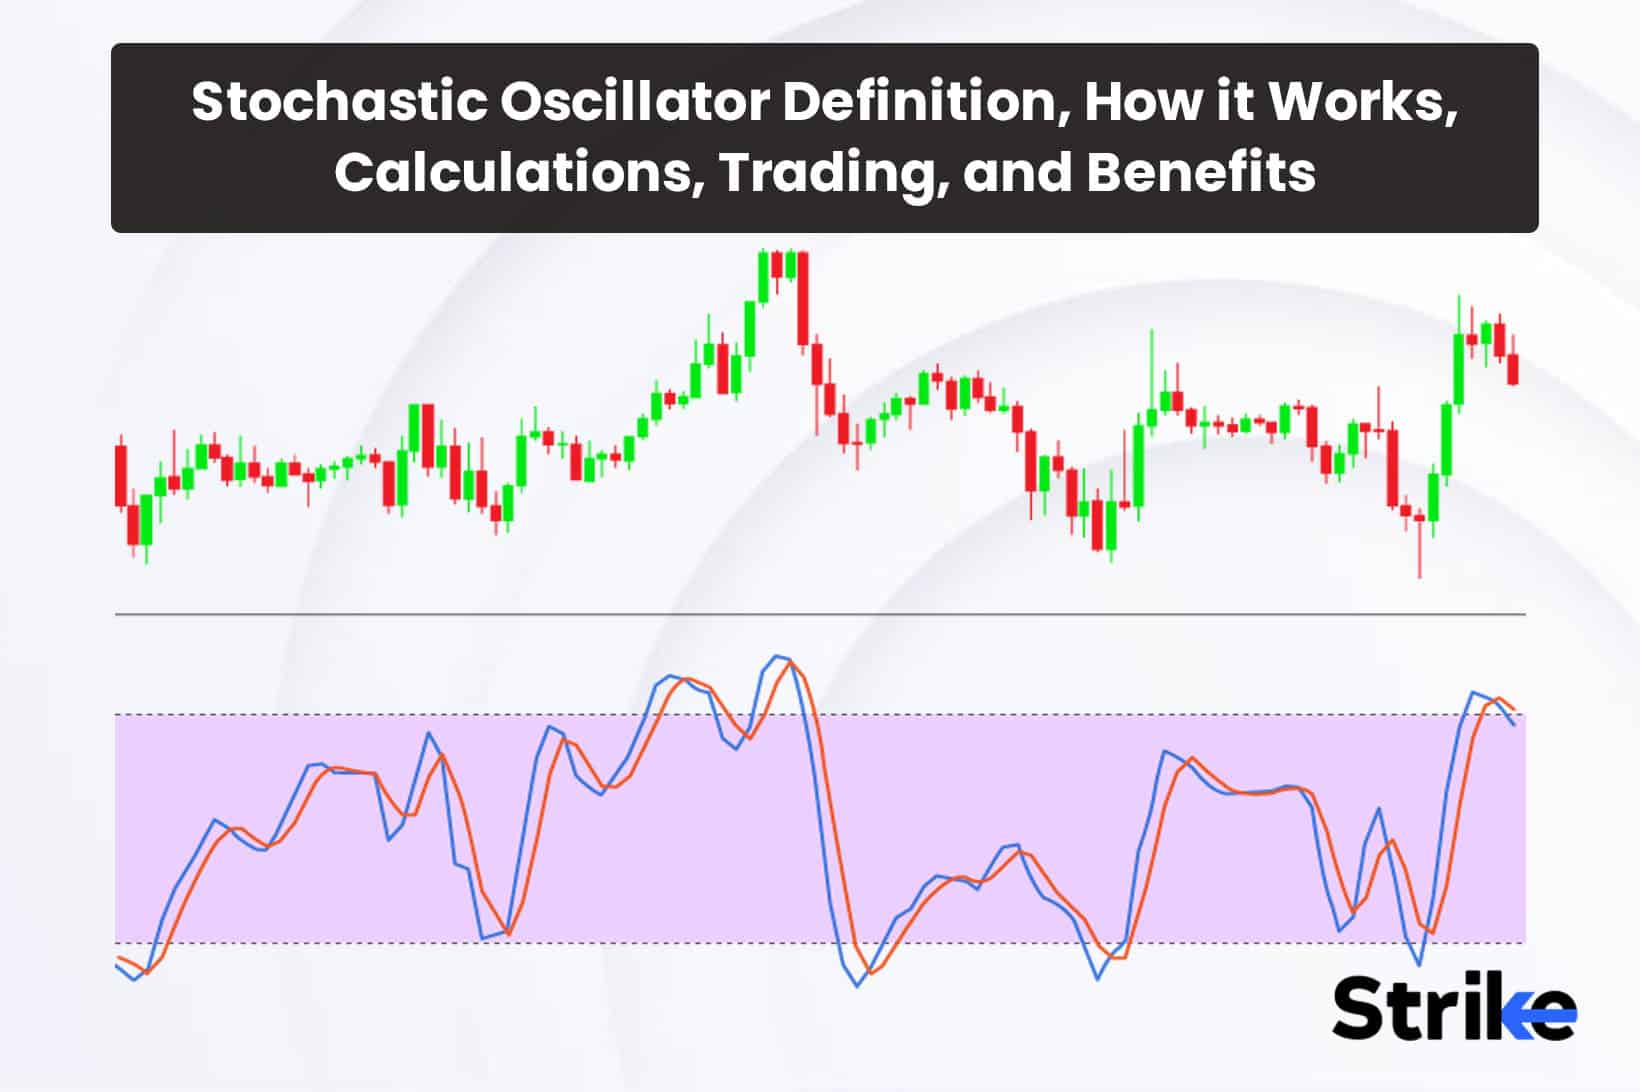
Table of content show
The stochastic oscillator is a popular technical indicator used in technical analysis to interpret price momentum and identify overbought or oversold conditions in the market. The stochastic oscillator was developed by George Lane in the late 1970s and compares the closing price of a security to its price range over a specified time period. Readings above 80 indicate overbought conditions, while readings below 20 suggest oversold conditions.
The stochastic oscillator calculates the %K value on a scale of 0 to 100. It measures where the close is in relation to the high-low range over the selected period of time. To calculate %K, the closing price is subtracted from the highest high for the period and then divided by the difference between the highest high and lowest low. This value is then multiplied by 100 to reflect it as a percentage value between 0 and 100. A second value, %D, is also calculated which is a 3-period moving average of %K to smooth out fluctuations and identify trends.
Here is a detailed video analysis of Stochastic Oscillator.
What is a Stochastic Oscillator?
The Stochastic Oscillator is a technical momentum indicator that shows the location of the close relative to the high-low range over a set time period. The Stochastic Oscillator is used to identify overbought and oversold conditions in a security. The Stochastic Oscillator was developed in the late 1950s by George C. Lane. It has become one of the most popular and broadly used indicators for technical analysis.
The Stochastic Oscillator is calculated based on two lines – the %K line and the %D line. See the image below.

The %K line is the main line that represents the raw Stochastic value. It measures where the current close is in relation to the total high-low range over the specified lookback period. The %D line is a 3-period simple moving average of the %K line. It is used as a signal line to identify potential signals from %K crossovers.
The raw Stochastic Oscillator formula is as stated below.
%K = (Current Close – Lowest Low)/(Highest High – Lowest Low) * 100
%D = 3-period simple moving average of %K
The standard lookback period used is 14 periods, which might be 14 days, hours, minutes, etc. depending on the desired time frame. The %K line fluctuates between 0 and 100. Readings over 80 are considered overbought, while readings under 20 are considered oversold.
The closing is almost at the top of the most recent trading range when the Stochastic Oscillator is over 80. This suggests an overbought condition, so a reversal to the downside is sometimes imminent. The closing is close to the bottom of the current range when the Oscillator is below 20, indicating an oversold situation and possible upward reversal.
Traders watch for crossover signals between the %K and %D lines for trade signals. A bullish crossover occurs when the %K line crosses above the %D line. This indicates upside momentum is accelerating and suggests a buy signal. A bearish crossover occurs when the %K crosses below %D, signaling downside momentum and a potential sell signal. Crossovers sometimes occur at any level, but often act as stronger signals when they occur in overbought or oversold territory.
The Stochastic Oscillator is an unbounded indicator, meaning it moves freely above 100 or below 0. High readings above 80 show strong upward momentum, while low readings below 20 indicate strong downward momentum. Traders often look for overbought or oversold readings to spot potential reversals.
There are several variations of the Stochastic Oscillator that traders use for analysis. The Fast Stochastic uses a 3-day %K smoothing rather than 3-period to make it more responsive to price changes. The Slow Stochastic smooths the %K with a 3-period SMA and the %D with a 3-period SMA, making it less sensitive to price fluctuations. The Full Stochastic shows both fast and slow Stochastics on the same scale for comparison. The KDJ Indicator combines the Stochastic with an RSI line to confirm overbought/oversold levels. These variations provide traders with additional options for tuning the sensitivity and signals from the indicator to suit their trading style and market conditions.
It’s crucial to remember that the Stochastic Oscillator performs best in range, non-trending markets and that, during strong trends, it stays overbought or oversold for extended periods of time. Traders should also be aware that the Stochastic Oscillator should be used with other technical indicators for confirmation rather than relying solely on its signals.
Using the Stochastic in combination with chart patterns, support/resistance levels, moving averages, and other indicators help improve the accuracy and timing of trading signals. Keeping these key points in mind will help traders effectively apply the Stochastic Oscillator within the context of their broader technical analysis.
Lane, the creator, believed that as prices rise, closing prices tend to approach the higher highs. Conversely, in downward trends, closing prices tend to approach the recent lows. The Stochastic Oscillator uses this behavior to identify overbought and oversold conditions.
One of the key benefits of the Stochastic Oscillator is that it identifies turning points even during strong trends. The indicator signals exhaustion in the current trend ahead of an impending reversal. It also incorporates volatility, showing the speed of price changes through its bounded range.
The Stochastic Oscillator does have some limitations to be aware of. During strong trends, it sometimes stays overbought or oversold for a long time when using standard settings. Too many signals sometimes occur during these trends. It also tends to be more effective on securities that are oscillating versus following clear directional trends.
What is the other term for Stochastic Oscillator?
The Stochastic Oscillator is also referred to as the Stochastic Indicator. While the full name is Stochastic Oscillator, Stochastic Indicator is commonly used as well when referring to this momentum technical indicator.
The indicator was originally referred to as Lane’s Stochastic Oscillator in his writings. The “stochastic” name comes from the Greek word “stochos” meaning “target”.
As Lane developed the indicator, he believed prices tend to close near the high in upward trends and near the low in downward trends. The Stochastic Indicator was designed to take advantage of this tendency by comparing the closing price to the range over a set lookback period.
What is the origin of Stochastic Oscillator?
The Stochastic Oscillator was developed by George C. Lane in the late 1950s. Lane was a technical analyst at Investment Educators in New York. He created the Stochastic Oscillator as a means to identify overbought and oversold conditions in commodities and stocks.
The indicator was first introduced in Lane’s book titled “How to Make Money in Commodities” in 1960. In the book, Lane outlines his approach to technical analysis with a focus on oscillators. He believed prices tend to oscillate between overbought and oversold levels that could be identified with indicators like the Stochastic Oscillator.
Lane named his indicator the “Stochastic Oscillator” where stochastic refers to the stochastic process in probability theory. This deals with random variables and probability distributions over time. Lane believed market prices behaved somewhat randomly in the short run but tended to follow general patterns over longer periods.
In Lane’s book, he notes the Stochastic Oscillator “will reach oversold status well before the actual bottom and overbought status well before the top.” This makes it useful for identifying potential turning points ahead of the crowd.
The Stochastic Oscillator gained widespread popularity among technical analysts and traders in the 1960s and 1970s. It became one of the most commonly used indicators for identifying overbought/oversold levels and trading signals from crossovers.
Since it incorporates volatility in its formula, the Stochastic Oscillator identifies trend changes earlier than other indicators. It spots bullish and bearish divergences as well. These advantages made it a valuable addition to the technical toolbox.
Over the decades, variations of the Stochastic Oscillator were developed including fast and slow versions, full Stochastics, KDJ, and others. But the original Slow Stochastic remained popular for its smooth signals that avoid whipsaws.
How does Stochastic Oscillator work?
The Stochastic Oscillator works by comparing where the close is relative to the recent trading range. This allows it to identify overbought and oversold levels in a security.

The Stochastic Oscillator is calculated based on two lines – the %K line and the %D line. The %K line shows the raw Stochastic value, which compares the closing price to the high-low range:
%K = (Current Close – Lowest Low)/(Highest High – Lowest Low) * 100
This formula subtracts the lowest low over the lookback period from the current closing price. It then divides that result by the difference between the highest high and lowest low. This produces a value that fluctuates between 0 and 100.
The standard lookback period used is 14 bars, whether on a 5-minute, daily or weekly chart. A 14-period %K calculates where the close is relative to the 14-period high-low range.
The %D line represents a 3-period simple moving average of the %K line. It acts as a signal line and is slower to react to price changes.
The %K line oscillates between 0 and 100. Readings above 80 are considered overbought as the close is near the top of the recent range. Readings below 20 are oversold as the close approaches the bottom of the range.
As the Stochastic approaches 80, it signals upward momentum is strong and sometimes is overextended. This suggests prices could reverse lower. As it nears 20, downside momentum is dominant, indicating a potential reversal higher.
Traders look for crossovers between %K and %D for trade signals. A bullish crossover occurs when %K crosses above %D, showing upside momentum is accelerating for a potential buy signal. A bearish crossover happens when %K moves below %D, signaling shifting momentum for a possible sell.

Besides overbought/oversold levels and crossovers, traders also watch for divergence between the Stochastic and price. A trend reversal is hinted at by diminishing momentum, which is shown if the oscillator is rising to new highs but the price is not.
Strike.money is one of a kind scanner that scans all the stocks based on the Divergences observed on Stochastic Indicator on Divergence scanner feature, giving either the list of positive divergence stocks and negative divergence stocks.
In the image below, Strike.money has sorted and presented the list of stocks that are indicating presence of Divergence under the Divergence Scanners (For Stochastic) on Daily Time Frame. (Example shows the stock sorted by Negative Divergence). The scanner enables users to sort the list based on hourly, daily, weekly and monthly time frames.

The Stochastic Oscillator works best in ranging, non-trending markets. Its signals often occur earlier than other indicators, giving traders an edge in identifying shifts in supply/demand.
There are variations of the Stochastic Oscillator that the traders use. The Fast Stochastic uses a 3-period moving average for %K smoothing rather than 3 days, making it more responsive to price changes. The Slow Stochastic, which is the standard version, smoothes both %K and %D with 3-period moving averages to make the indicator less erratic. The Full Stochastic displays a second Stochastic oscillator on the chart to help identify long-term overbought and oversold levels. These different versions give traders flexibility to choose a Stochastic Oscillator configuration that fits their trading style and market requirements.
What is the importance of Stochastic Oscillator?
The Stochastic Oscillator is an important technical analysis indicator due to its ability to identify overbought/oversold levels early, signal potential trend changes with crossovers, and confirm divergences. One of the primary uses of the Stochastic Oscillator is identifying overbought and oversold conditions. The indicator quantifies where the closing price is relative to the recent high-low range on a scale of 0 to 100.
Readings above 80 indicate the close is near the top of the trading range, signaling an overbought security. Readings below 20 show the close is near the bottom of the range, suggesting an oversold condition. Spotting overbought and oversold levels allows traders to time entries and exits effectively. Ahead of possible reversals, the stochastic alerts traders when long positions could be overextended or short ones oversold.
The Stochastic Oscillator frequently signals trend reversals earlier than other indicators like moving averages. This is due to its incorporation of volatility in the calculation. By measuring where the close is relative to the high-low range, the Stochastic reflects the speed of price action. Rapidly falling prices will push the Oscillator lower while surging prices drive it higher. This allows it to turn lower or higher ahead of the actual trend reversal.
Traders rely on the Stochastic turning points to either enter trades earlier or protect profits from trend exhaustion. These early warnings provide an edge for timing trades.
The crossovers between the Stochastic lines offer trade signals to traders. A bullish crossover occurs when %K crosses above %D, signaling upside momentum is accelerating. This suggests a buy opportunity.
Bearish crossovers happen when %K crosses below %D, indicating downside momentum is strengthening. The crossovers indicate when short-term momentum direction is changing.
While crossovers whipsaw in ranging markets, they still provide useful signals when confirmed with other indicators or analysis techniques.
How is the Stochastic oscillator used in Technical Analysis?
The Stochastic Oscillator is used in technical analysis to identify overbought and oversold levels, time entries and exits with crossovers, confirm divergences, and optimize parameters when combined with other indicators. One of the most common applications of the Stochastic Oscillator is identifying overbought and oversold conditions. The indicator provides overbought/oversold readings on a scale of 0 to 100.
The security is overbought in the near term when the indicator crosses over 80. This suggests upside is becoming overextended and the rally might stall or reverse. Readings below 20 indicate an oversold security where the decline could be nearing exhaustion. Traders watch for readings above 80 or below 20 to anticipate trend changes.
The overbought and oversold signals help traders determine opportune entry and exit points for trades. For instance, a trader tries to purchase in anticipation of an oversold rally when the Stochastic falls below 20. As it rallies back above 20, they exit for profit. Above 80, short trades are initiated expecting the uptrend to be fatigued. The position is covered when the Oscillator turns down below 80 once again. The crossover points between the %K and %D lines provide additional trading signals. A bullish crossover occurs when %K crosses above %D, signaling upside momentum is strengthening.

This crossover suggests a long entry opportunity. The long trade remains active until %K crosses back below %D for a bearish signal. Bearish crossovers indicate good times to enter short trades. Traders use the crossovers to determine both entry and exit timing.
What are the different types of Stochastic Oscillators?
The main types of Stochastic Oscillators include the Slow Stochastic, Fast Stochastic, Full Stochastic, Stochastic Momentum Index, and KDJ Indicator, as well as variations based on optimized parameters and overbought/oversold levels.
- Slow Stochastic Oscillator
The Slow Stochastic is the original version developed by George Lane in the 1950s. It uses standard parameters of 14 periods for the %K line and 3 periods for the %D moving average.
The slow settings smooth the indicator to filter out noise and produce clear overbought/oversold signals. The Slow Stochastic is less prone to generating false signals.
- Fast Stochastic Oscillator
The Fast Stochastic speeds up the indicator by using shorter moving averages. Typically the %K line uses a 3-period moving average rather than 14 periods.
The %D line sometimes uses a 3-period moving average rather than 3 days. The faster version is more sensitive to price changes.
- Full Stochastic Oscillator
The Full Stochastic displays two Stochastic Oscillators on the chart – one fast and one slow. This allows traders to evaluate short-term and long-term overbought/oversold readings.
The Full Stochastic provides a more comprehensive perspective on momentum. Divergences between the two oscillators also signals trend changes.
- Stochastic Momentum Index
The Stochastic Momentum Index modifies the Stochastic calculation to incorporate closing price momentum. This momentum factor helps identify trend strength and exhaustion sooner.
The addition of momentum makes the Stochastic Momentum Index more adaptive to changing market conditions.
- KDJ Indicator
The KDJ Indicator combines the Stochastic Oscillator with aspects of the popular RSI indicator. The KDJ adds a momentum line and signal line to confirm overbought/oversold levels.
This hybrid indicator offers traders an alternate method to identify potential reversal points. It combines Stochastic strengths with RSI capabilities. In the image uploaded below, the indicator is known as Stochastic RSI that has combined strengths of Stochastic and RSI, both.

There are also variations in the timeframes used. The Stochastic uses different periods for its %K and %D calculations depending on the chart time frame.
For example, hourly charts use (10,5,5) while daily charts use (14,3,3). Using optimized parameters improves the relevancy of the signals.
In addition to the different Stochastic variations, traders also modify the overbought/oversold levels. While 80 and 20 are standard, other thresholds like 90/10, 70/30 or 60/40 are used.
What is the formula of Stochastic Oscillator?
The Stochastic Oscillator formula consists of the %K line which compares the closing price to the high-low range over a set lookback period and the %D line that acts as a signal line based on a moving average of %K.
The Stochastic Oscillator consists of two lines – the %K line and the %D line. Each line has its own formula. The %K line shows the raw Stochastic value and ranges between 0 and 100. Its formula is as stated below.
%K = (Current Close – Lowest Low)/(Highest High – Lowest Low) x 100
This formula takes the current closing price, subtracts the lowest low over the specified lookback period, and divides by the difference between the highest high and lowest low.
For instance, it would determine the highest high and lowest low over the previous 14 bars if the lookback time was 14. Then it calculates where the current close is relative to that range.
In the event that the close approaches the top bound of the 14-bar range, %K will approach 100. In the event that the close is towards the lower end of the range, %K will approach zero.
The standard lookback period is 14 bars or sessions. But traders adjust this to shorter or longer durations if desired.
The %D line is a simple moving average of the %K values. This acts as a signal line to identify turns in momentum. Its formula is:
%D = 3-period SMA of %K
A 3-period SMA is the standard for %D. Applying a moving average smooths the %K raw value to filter out noise.
The %K line oscillates between overbought levels above 80 and oversold levels below 20. The %D line provides trade signals when it crosses above or below %K.
For instance, a purchase signal is generated if %K crosses over %D, which shows that upside momentum is growing.
The standard parameters for calculating the Slow Stochastic Oscillator are 14 periods for the %K lookback, 3 periods for the %K smoothing moving average, and 3 periods for the %D signal moving average. With the %K set at 14 periods, this determines the high-low range that the current close is measured against. A 3-period moving average of %K smooths the line to reduce noise. The 3-period setting for %D determines the speed of the signal line in reacting to changes in momentum. These standard 14, 3, 3 parameters produce the traditional Slow Stochastic that traders have used for decades to generate robust overbought and oversold signals.
This 14/3/3 combination produces smooth signals for the Slow Stochastic. Faster settings use shorter lookback and smoothing periods for more sensitivity.
How is Stochastic Oscillator calculated?
The Stochastic Oscillator is calculated by taking the current closing price, subtracting the lowest low over a specified lookback period, dividing by the difference between the highest high and lowest low over that lookback period, and multiplying by 100. The Stochastic Oscillator is used to predict price turning points by indicating when a stock is overbought or oversold. The Stochastic Oscillator is calculated using two lines – the %K line and the %D line.
The %K line calculation is as stated below.
%K = (Current Close – Lowest Low)/(Highest High – Lowest Low) x 100
Where,
Current Close = The closing price of the current period
Lowest Low = The lowest price over the specified lookback period
Highest High = The highest price over the specified lookback period
The %K line looks at where the current close is in relation to the total range over the specified lookback period. The %K ranges from 0 to 100 – a reading of 0 means the close is at the very bottom of the range while 100 means the close is at the very top of the range.
The %D line is simply a 3-period moving average of the %K line. Therefore, the %D would be a 3-period moving average of the 14-period %K line if you were looking at 14 periods for the %K calculation.
The moving average smoothes out the %K so you will more clearly spot turns in momentum. The %D line also ranges from 0 to 100 like the %K.
To start, identify the highest high and lowest low prices over the last 14 periods, including the current period. Then plug those values into the %K formula:
%K = (Current Close – Lowest Low) / (Highest High – Lowest Low) x 100. This will give you the %K value for the current period.
Next, repeat this process for the previous period to calculate its %K value. Then take the average of the most recent 3 %K values – this gives you the first %D value. Plot the first %K and %D values on the chart.
Moving forward, calculate the next set of %K and %D values for the subsequent period. Do this by identifying the new highest high and lowest low over the last 14 periods. Plug into the %K formula. Then take the average of the last 3 %K values to get the new %D value. Plot these new %K and %D values on the chart.
Continue this process of identifying the highs and lows, calculating %K and %D, and plotting the values for each new period. After enough periods, you will begin to see two oscillating lines ranging between 0 and 100 – the Stochastic Oscillator. The %K line reacts faster to price changes, while the %D line is the smoothed moving average.
The most common way to read the Stochastic Oscillator is to identify overbought and oversold conditions. An imminent downturn in price is indicated when the oscillator crosses over the 80 mark, indicating that it is overbought. In contrast, the oscillator is regarded as oversold and suggests that a price reversal is imminent when it drops below 20.
Aside from overbought and oversold readings, crossovers between the %K line and %D line also generate trading signals. A bullish crossing occurs when the quicker %K line crosses over the slower %D line, indicating a purchase signal. By comparison, a bearish crossing occurs when the %K line crosses below the %D line, indicating a sell signal. By looking for these overbought/oversold levels and crossovers, traders identify turning points and trading opportunities.
The default parameters for the Stochastic Oscillator are 14 periods for the %K lookback and 3 periods for the %D moving average. However, traders often tweak these parameters to try and better match the oscillator with the security’s normal trading range. Slowing it down (increasing the lookback periods) will make it less sensitive while speeding it up (decreasing the lookback periods) will make it more sensitive to price swings.
The Stochastic Oscillator is best suited for trading ranges and identifying oversold and overbought levels. It sometimes produces good signals in trending markets as well, but requires more tweaking of the parameters. It should not be used alone, but combined with other technical analysis tools. The main drawback is that it stays in overbought or oversold territory for a long time during strong trends.
The calculation part of this indicator remains a theoretical concept as all the charting and analytical platforms provide default Stochastic Indicator on their website for free as it is very popular and used across all the markets. Strike.money is one of the websites that provide the Stochastic and Stochastic RSI indicator on the platform. They also contain a DIvergence Scanner that sorts the entire list of stocks giving Positive and Negative Divergences on Price vs Stochastic lines. This helps traders save their analysis time and dive deep into other aspects of the trade setup and opportunity.
What are the key features of Stochastic Oscillator?
The key features of the Stochastic Oscillator are its ability to identify overbought and oversold levels, momentum shifts through crossovers, and divergence between price and oscillator readings.
1. Overbought and Oversold Levels
One of the primary ways the Stochastic Oscillator is used is to identify overbought and oversold conditions. The oscillator provides overbought/oversold readings using the scale of 0 to 100.
Readings above 80 are considered overbought. This suggests the price is due for a reversal or pullback.
Readings below 20 are considered oversold. This suggests the price is primed for a bounce higher.
By identifying these extreme high and low levels, traders potentially enter into or exit trades at advantageous prices.
2. Momentum Swings
The Stochastic Oscillator is considered a momentum indicator. Although prices are sometimes trending in one direction, the oscillator sometimes signals when the momentum is leveling off or changing.
As the %K line crosses above or below the %D line, it indicates a shift in momentum that sometimes precedes a price reversal. Crossovers form the basis for trading signals.
3. Confirmation Tool
The overbought/oversold readings and crossovers are used to confirm price action and other technical indicators. For instance, overbought circumstances and the possibility of a reversal are confirmed if the price hits a new high and the Stochastic Oscillator is over 80.
The oscillator doesn’t generate trading signals on its own, but is used to confirm the signals of other strategies. This confirmation improves the robustness of trading signals.
4. Adjustable Parameters
The standard parameters for the Stochastic Oscillator are 14 periods for the %K lookback and 3 periods for the %D moving average. However, traders often experiment with faster or slower settings.
A shorter lookback period (e.g. 5) makes the oscillator more sensitive to price changes. A longer lookback (e.g. 21) makes it less sensitive and smoother. Adjusting these periods allows customization for security or market conditions.
5. Range Trading Strategy
The Stochastic Oscillator is best suited for range trading environments where prices oscillate between well-defined highs and lows. Identifying overbought and oversold levels allows traders to enter trades at potential turning points.
For trending markets, the oscillator should be adjusted to be more responsive so as not to remain overbought or oversold during the trend.
6. Divergence
A divergence occurs when the oscillator and price are moving in different directions. For example, prices moving to a new high while the Stochastic Oscillator is failing to exceed its previous highs.
Strike.money is a one of the scanners that has a feature known as Divergence Scanner. This Divergence Scanner can be used with Stochastic; It will scan over the listed scrips on the exchange and provide the list of stocks that are showing Positive or Negative Divergence. Traders can use this important information to select stocks that fit the criteria and trading setup to further optimize the trading opportunity.
Divergence signals a discrepancy between price action and momentum. It indicates waning momentum that sometimes foreshadows a trend change or reversal.
7. Signal Line Crossovers
The %K line oscillates above and below the %D line, or signal line. Crossovers form the basic trade signals:
Bullish crossover: %K line crosses above %D line, indicating increasing momentum and a buy signal
Bearish crossover: %K line crosses below %D line, indicating waning momentum and a sell signal
These crossovers identify early momentum shifts and sometimes provide earlier entry points.
8. Warning Tool
The Stochastic Oscillator warns against counter-trend trading. For example, oversold readings warn against going short when prices are near their lows – the price is more likely to bounce than continue down.
Similarly, overbought conditions warn against going long near price highs when a pullback is likely.
How do traders use a Stochastic Oscillator?
Traders mainly use the Stochastic Oscillator to identify overbought and oversold levels in the market. They also look for divergences and crossovers of the indicator’s lines to anticipate potential changes in the price trend. Start by adding the Stochastic Oscillator (%K and %D lines) to your trading chart using a setting of 14 periods for the %K and 3 periods for the %D.
View the oscillator at the bottom of the chart to see its ebb and flow as prices change. Identify overbought readings above 80 and oversold readings below 20. These suggest potential exhaustion points for the current price trend.The image uploaded below is the classic example of how traders may interpret the information. FIrstly, Negative Divergence is observed, Secondly, Stochastic is Oscillating in an overbought level and the %K line is crossing below the %D line (signal line), Thirdly, the evening star pattern is observed. This information is procured and a short position can be initiated at this point.
The short position may have been exited when the oscillator reached around 20 stages of oversold level. This way, traders can combine price action and stochastic to fine tune trade setups and take a bet.

What are the trading strategies used with Stochastic Oscillator?
The main trading strategies using the Stochastic Oscillator involve identifying overbought/oversold reversals, trading crossovers, spotting divergences, confirming trends and breakouts, and swing trading based on smoothed oscillator values.
- Overbought/Oversold Reversals
One of the core strategies is to trade reversals when the indicator reaches overbought or oversold levels. Overbought readings above 80 indicate the uptrend is overextended and likely to reverse. Oversold readings below 20 sometimes signal the downtrend is exhausted and ready to bounce back up.
Traders watch for the oscillator to exit the overbought/oversold zone and then take a trade in the reversal direction. For instance, they will be ready to go short on weakness when the %K line falls below 80. The overbought/oversold levels identify opportune times to enter counter-trend trades.
- Crossover Signals
The crossover of the %K and %D lines form the basis for trades. A rising momentum and a chance to go long are indicated by an upside crossover, which occurs when %K crosses above %D. A downside crossover indicates waning momentum and favors a short position.
Simple crossover systems buy on bullish crossovers and sell on bearish crossovers. The crossovers identify turning points ahead of the price trend change. Moving average crossovers confirm the oscillator signals.
- Divergence Trades
Divergences between price and oscillator signal loss of momentum. For instance, declining upward momentum is indicated when the price reaches a higher high but the Stochastic creates a lower high. Traders watch for these momentum divergences and take trades in the direction of the developing divergence.
- Riding Trends
While mainly a momentum oscillator, the Stochastic also helps identify and ride existing trends. When the indicator is trending strongly in overbought or oversold zones, it signals a strong underlying trend. Traders use pullbacks towards the %K/%D midpoint as opportunities to join the dominant trend direction.
- Swing Trading
Adjusting the Stochastic to slower settings creates smoother oscillator lines useful for swing trading. Identifying oversold readings near support and overbought readings near resistance provides swing trade opportunities. Divergences also flag potential swing trade reversal points.
- Breakout Confirmation
Stochastic sometimes confirms breakouts when its value reflects the direction of the breakout. The validity of the breakout signal is increased if prices break support with %K below 50 or resistance with %K above 50. This confirmation technique applies to technical patterns and channel breakouts.
When is the best time to trade with a Stochastic Oscillator?
The Stochastic Oscillator works best when prices are consolidating in a trading range rather than trending strongly. The oscillator is best for trading when it reaches overbought or oversold levels and starts to reverse out of those regions. Watch for the Stochastic to reach extreme highs above 80 (overbought) or lows below 20 (oversold). These levels indicate exhausted momentum that has likely pushed the price too far.
As the oscillator turns back towards the middle ground from the upper or lower extremes, it signals a coming counter-trend reversal. For instance, it signals a possible positive reversal and selling opportunity if the %K line falls below 80 and begins to decline.
However, markets sometimes hug overbought/oversold zones for extended periods in strong trends. Wait for some confirmation of the reversal through patterns or breaks of support/resistance. Don’t prematurely trade counter-trend, but be ready once momentum clearly stalls.
The crossover points offer signs for when to enter a trade when %K crosses above or below %D. Upward crossovers indicate building bullish momentum, while downward crossovers signal developing bearish momentum. These crossovers emerge earlier than full price reversals, so they allow traders to enter trades ahead of the coming move. Again, confirm crossovers with other indicators, but these crossover spots signal ideal moments to trade in the direction of the momentum shift.
Divergences occur when price and oscillator move in opposite directions. An indication that upward momentum is increasing is a bullish divergence, for example, when the Stochastic makes higher lows while the price makes lower lows.
Strike.money is a one of the scanners that has a feature known as Divergence Scanner. This Divergence Scanner can be used with Stochastic; It will scan over the listed scrips on the exchange and provide the list of stocks that are showing Positive or Negative Divergence. Traders can use this important information to select stocks that fit the criteria and trading setup to further optimize the trading opportunity.
Divergences identify impending trend changes early. Look to enter trades in line with the developing momentum once confirming signals emerge, like an upside breakout. Divergences flag the reversals ahead of time.
Yes, the Stochastic Oscillator is an effective trading indicator that provides valuable signals when prices are oscillating in a range or channel. Its strength lies in identifying overbought and oversold levels as well as early momentum shifts.
Is Stochastic Oscillator effective?
Yes, the Stochastic Oscillator is an effective trading indicator that provides valuable signals when prices are oscillating in a range or channel. Its strength lies in identifying overbought and oversold levels as well as early momentum shifts.
Stochastic Oscillator also provides additional information if the prices and the indicator are diverging. Meaning, moving in opposite directions.
Stochastic indicator when combined with other confluences, it strengthens the existing edge or strategy to take a high probability winning setup.
Is Stochastic Oscillator accurate?
Yes, the Stochastic Oscillator provides precise trading signals as there is not a single indicator that will provide dot to dot or accurate signals. The precision depends significantly on proper usage and context. On its own, the Stochastic Oscillator is prone to false signals during volatile trending markets. Without confirmation from price action or other indicators, its signals to trade reversals from overbought or oversold levels will have low accuracy. Traders using the Stochastic alone will get faked out repeatedly.
What are the benefits of Stochastic Oscillator?
The main benefits of the Stochastic Oscillator are its ability to identify overbought/oversold levels, signal momentum shifts through crossovers ahead of price turns, confirm trade signals, reveal divergences, and aid trend and swing trading when used properly.
1. Overbought/Oversold Levels
One of the primary benefits of the Stochastic is its ability to identify overbought and oversold conditions. Prices that are overbought and could shortly flip lower are indicated by readings above 80. Readings below 20 signal oversold conditions poised to bounce back up. Trading these reversals from extremes is profitable.
2. Momentum Shifts
The Stochastic Oscillator signals changes in momentum before price turns. Crossovers of the %K and %D lines indicate building momentum in the direction of the crossover. This allows traders to enter trades earlier at better prices before the move gets underway.
3. Confirmation Tool
The indicator helps confirm price action and other technical signals. For example, an overbought reading validates selling at a resistance level. Stronger confirmation is provided to trade the signal when indicators agree. The Stochastic improves confidence in trade signals.
4. Flexible Parameters
The adjustable %K and %D parameters allow traders to modify the Stochastic to suit different securities and timeframes. A faster Stochastic setting often improves signals for volatile markets and short-term trading.
5. Trend Identification
While mainly a momentum oscillator, the Stochastic also informs trend identification. Overbought/oversold readings that persist signal an asset is trending strongly. Traders then capitalize by trading in the direction of the trend.
6. Swing Trading
Slow Stochastic settings smooth out the oscillator lines and reduce noise. This enables traders to clearly see turning points that are utilized for swing trading opportunities.
7. Divergence Signal
Divergences between the Stochastic and price reveal waning momentum that typically leads to trend reversals. Traders profitably fade the divergence and trade the impending reversal.
By indicating oversold/overbought levels, highlighting momentum changes via crossings, validating current trade signals, indicating the strength of trends, providing chances for swing trading, and revealing momentum divergences before price turns, the Stochastic Oscillator helps traders.
What are the limitations of Stochastic Oscillator?
The main limitations of the Stochastic Oscillator are its tendency to give false signals during strong trends, lagging nature, lack of clear exit signals, repainting issues, propensity for whipsaws, and need for confirmation from other indicators.
1. False Signals in Trending Markets
The biggest limitation is that the Stochastic tends to stay overbought or oversold for extended periods during strong trending moves. This results in many false reversal signals and whipsaws if traded aggressively counter to the trend. It performs best in range-bound markets, not high momentum trends.
2. Lagging Indicator
Like all lagging indicators based on past prices, the Stochastic trails the current price action. The crossover signals occur after much of the price move has developed. The lag must be accounted for in trade planning and management.
3. No Clear Exit Signals
While useful for signaling potential entry points, the Stochastic does not provide clear signals for when to exit trades. Traders must use other indicators or methods to plan exits rather than relying on the oscillator alone.
4. Repainting
The fact that each Stochastic value depends on future high/low prices means its signals are subject to repainting. Past signals sometimes change or disappear as new price data alters the oscillator values. This makes it an unreliable standalone tool.
5. Subject to Whipsaws
The Stochastic is prone to whipsaws, giving buying signals near temporary bottoms in a downtrend and selling signals near temporary tops in an uptrend. Too much emphasis on Stochastic signals will lead to being whipsawed in and out of trades.
6. No Direction Bias
The oscillator by itself has no directional bias. The trader must determine the market conditions and larger trend context. Stochastic just signals potential turning points, not the overall trend direction.
7. Requires Confirmation
Due to the potential for false and low probability signals, the Stochastic works best when confirmed with other indicators. Looking for agreement between indicators improves accuracy and timing of trading signals.
The main flaws of the stochastic oscillator are that it produces unnecessary signals, lags behind the market, repaints, gives ambiguous exits, and requires confirmation from other sources. While trading the markets, these disadvantages could be minimized by employing appropriate tactics and context analysis.
Can Stochastic Oscillator work well with other Indicators?
Yes, the Stochastic Oscillator works very effectively when combined with other technical indicators as part of a complete trading strategy.
Using the Stochastic together with complementary indicators improves the timing and accuracy of trade signals. It helps confirm signals and provides greater confidence in trading decisions.
Indications from Stochastic indicator can be further smoothed if Stochastic RSI is used. This indicator is the result of the combination of the strengths in Stochastic and RSI.
Further, Stochastic indicator can be used alongside price action techniques to eliminate the risk of fake signals.
What is the difference between RSI and Stochastic Oscillator?
The main differences between RSI and Stochastic oscillator are given below.
| RSI | Stochastic Oscillator |
| RSI measures speed of price changes to measure momentum | Stochastic compares the closing price to the high-low range |
| RSI has one line. | Stochastic has two lines. |
| RSI typically uses 14 periods. | Stochastic has adjustable parameters. |
| It calculates momentum by measuring the velocity and rate of change of recent price movements. | It calculates momentum by analyzing where the most recent closing price sits within the price range over a given lookback period. |
| Readings above 70 are considered in overbought territory, while levels below 30 are considered in oversold territory. | Readings above 80 are considered in overbought territory, while levels below 20 are considered in oversold territory. |
| As RSI consists of one line only, crossovers don’t happen. When the RSI line crosses into these extreme territories, traders look for potential reversals or momentum failures when the move becomes overextended. For eg; If RSI is above 70, traders consider taking short positions due to 70 being in overbought territory. | Stochastic consists of two lines; %K and %D line. Crossovers of these two lines give bullish or bearish signals. For eg; If the %K line crosses below the %D line, it gives a bearish sign. The crossovers is an additional application with respect to the overbought or oversold regions. |
| RSI interpretation relies on the presence of a single line in overbought or oversold regions. | Stochastic interpretation relies more on crossovers and divergence. |
Arjun is a seasoned stock market content expert with over 7 years of experience in stock market, technical & fundamental analysis. Since 2020, he has been a key contributor to Strike platform. Arjun is an active stock market investor with his in-depth stock market analysis knowledge. Arjun is also an certified stock market researcher from Indiacharts, mentored by Rohit Srivastava.
Shivam is a stock market content expert with CFTe certification. He is been trading from last 8 years in indian stock market. He has a vast knowledge in technical analysis, financial market education, product management, risk assessment, derivatives trading & market Research. He won Zerodha 60-Day Challenge thrice in a row. He is being mentored by Rohit Srivastava, Indiacharts.
Leave a Reply


Recently Published


More in this topic

Join the stock market revolution.
Get ahead of the learning curve, with knowledge delivered straight to your inbox. No spam, we keep it simple.
Comments