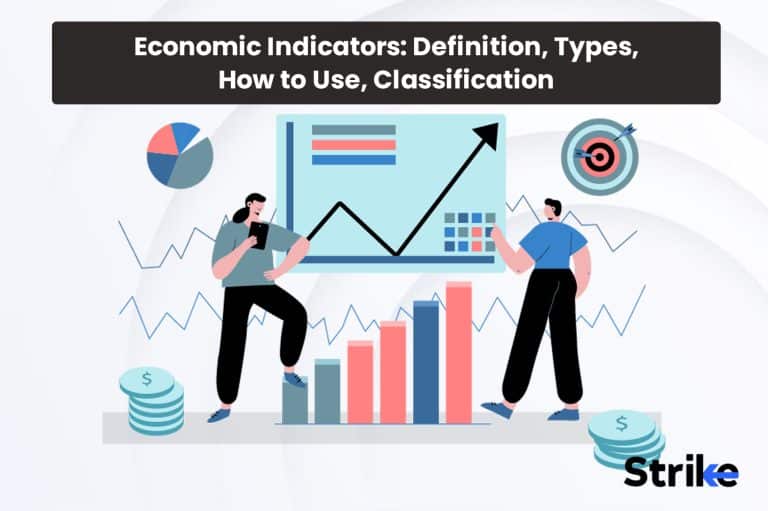
Economic Indicators are statistical measures that allow economists, investors, and policymakers to track economic growth, inflation, employment trends, consumer spending habits, and other critical patterns over time. Economic indicators help forecast future economic conditions by identifying shifts and turning points.
Leading economic indicators aim to predict future economic activity by focusing on factors like average workweek, building permits, and stock prices. Coincident indicators, such as employment levels, personal income, and manufacturing output, generally fluctuate alongside the overall economy. Lagging indicators tend to change direction after the economy has started to improve or weaken, examples being corporate profits, inventory-to-sales ratios, and interest rate spreads. International indicators also provide context about a country’s exports, imports, currency exchange rates and competitiveness.
To get a robust view of economic performance and momentum, analysts consider a basket of related indicators. No single metric presents a complete picture on its own. Tracking indicators over extended periods helps establish trends and historical relationships. Comparing current data to averages highlights deviations that may signal potentially meaningful economic shifts. The relative movement between different categories of indicators also provides crucial cues about the state of the overall business cycle. Together, economic indicators serve as important leading tools for strategic planning, fiscal policy making and investment decision making.
What are economic indicators?
Economic indicators are statistics and data that are used to analyze the health, size and direction of a country’s overall economy or specific economic sectors. Economic Indicators provide information on key factors such as production, employment, spending and prices that influence Gross Domestic Product (GDP), inflation, productivity and economic growth. They help monitor current economic performance and also act as leading or lagging signals of future economic conditions. By tracking these indicators over time, economists and policymakers gain insights into business cycles and make more informed decisions related to fiscal and monetary policy.
There are different types of economic indicators that provide key snapshots of different spheres of economic activity.
For one, production indicators offer a look at the output of goods and services from various industries on a monthly or quarterly basis. These include indices for industrial production, manufacturing and housing starts which respectively measure the volume of goods made in factories, the volume of output from the manufacturing sector and the number of new residential buildings being constructed.
Employment indicators detail the condition of the labor market through statistics on unemployment claims, non-farm payrolls, the unemployment rate and average hourly earnings. A low unemployment rate and strong payroll growth typically points to economic expansion and increased spending power, while rising unemployment is a red flag.
Other major indicators revolve around income and spending trends. Personal income and outlays report tracks wages, salaries, rents and investment income of consumers and their expenditures on goods, services and savings.
Also closely watched is retail sales which specifically focuses on consumer purchases at stores and online. Wholesale inventories provide insight into stock levels held by manufacturers, distributors and retailers. A buildup of unsold goods is problematic.
Turning to prices, the most prominent inflation metric is the Consumer Price Index which calculates the average change in prices paid by urban consumers for a basket of goods and services. It reflects living expenses and cost of living.
The Producer Price Index observes factory prices received and other prices paid by producers to gauge intermediate and finished goods inflation at the wholesale level.
The Treasury also reports on international trade through stats on exports and imports that reveal the contribution of foreign demand and imbalance of trade to the economy. Finally, there are leading indicators like building permits, orders for durable/capital goods and stock market averages that potentially forecasts trend changes in the months ahead.
What are the most-used economic indicators by investors?
10 preeminent economic indicators rise to the top in terms of relevance and impact assessed by the investment community. Traders and financial analysts devote close attention to monitoring shifts in Gross Domestic Product, inflation, unemployment, interest rates, and consumer confidence to better comprehend economic conditions and aid decision-making. Tracking movements in these key metrics helps investors gauge the overall health of the economy and make more informed investment decisions.
1. Gross Domestic Product (GDP)
Gross Domestic Product is arguably the most important barometer watched by investors to gauge the pulse of economies nationwide and globally. GDP quantifies the total market value of all finished goods and services produced within a country’s borders over a specified period, usually a quarter or year. More specifically, GDP is calculated as the sum of consumer spending, non-profit institutions’ spending, investment spending, government spending, and net exports. This formula aims to fully encapsulate economic output across business and household sectors, with imports subtracted to avoid double counting foreign supply.
For investors, tracking GDP shines light on the underlying momentum of aggregate supply and demand powering corporate revenues, profits, and asset values over the short and long-term. Strength in GDP underscores stable to expanding conditions that bode favorably for maintaining or improving standards of living, employment, tax receipts supporting government accounts, and corporate fundamentals tied to mass consumption. Graphs plotting nominal and real GDP data in indexes or year-over-year growth rates provide vital context on whether production is accelerating, decelerating, or stabilizing through business cycles. Real GDP strips out inflation effects to isolate physical output movements aside from price changes.
Quarterly GDP announcements prompt notable market reactions given their ability to affirm economic resilience is persisting as expected or signal that revisions to monetary and fiscal policies becomes prudent. While a single reading does not necessarily alter the big picture, sustained shortfalls raise questions over the viability of consensus growth projections.
Charts displaying long-term GDP trends also aid assessing productivity growth and national competitiveness influencing asset class selection. Strong multi-year uptrend lines for leading nations profile stable environments supporting widespread opportunity. Below is the GDP chart of india.

At the corporate level, dependable GDP expansion encourages investment in business expansion, hiring, capital equipment upgrades boosting capacity, and R&D ventures unlocking innovation to meet swelling demand. Healthy consumer balance sheets then underpin consistent discretionary outlays and balance between savings and spending. This consumption pattern fuels stable profits in retail and consumer goods industries, as well as steady sales tax receipts providing budgetary wherewithal to regional governments for addressing education, healthcare and infrastructure needs sustaining growth over the long haul. GDP insights hence have pivotal implications across industries and market segments for discerning strategic portfolio allocations well-aligned with underlying macroeconomic conditions. The
2. Purchasing Managers Index (PMI)
The Purchasing Managers Index (PMI) provides investors with a timely monthly snapshot of manufacturing business conditions and sentiment within the vital private sector. Compiled by data firm IHS Markit, the PMI indexes production volumes, new orders, employment levels, inventories, delivery times and prices paid by surveyed purchasing managers across 23 industries. Respondents characterize each component as higher, same or lower on a monthly basis.
To calculate the headline PMI figure, the percentage of positive and negative responses are weighted and rolled up into a single diffusion index. Here, readings above 50 signal expansion compared to the prior month, while those under 50 denote contraction. The further the index deviates from the neutral threshold in either direction, the stronger the implied growth or weakness being experienced. Separate PMIs also track performance at the national and regional level for major economies worldwide.
For investors, PMI readings supply early clues on manufacturing sector momentum that often correlate with subsequent quarters’ gross domestic product (GDP) outcomes. Strong PMIs above the 55 level for multiple months running tend to validate projections for solid production and sales growth supporting corporate profits. Meanwhile, extended declines to sub-50 territory issues red flags over developing vulnerabilities and threats to consensus earnings estimates.
PMI data is released on the first business day of each month, providing invaluable information to investors managing portfolios and positioning exposures ahead of key macroeconomic and corporate updates. Given manufacturing’s weight within global supply chains, shifts in PMI trends frequently inspire timely adjustments to geographic and industry tilts. As leading indicators, PMIs also shine light on developing headwinds or tailwinds not yet evident in lagging official statistics.
Charts depicting PMI movements against comparable historic ranges reveal whether momentum is strengthening, softening, or holding relatively resilient despite challenging conditions. Patterns of PMI contractions followed by V-shaped rebounds for example affirm an economy’s self-righting tendencies enabled by adaptable private enterprises. On the other hand, persistent declines towards recessionary territory rationalize protections through hedges until stabilization becomes clearer. Below is India’s latest manufacturing PMI chart.

3. Consumer Price Index (CPI)
The Consumer Price Index (CPI) is one of the most significant inflation gauges tracked closely by investors worldwide. The CPI represents changes in retail prices paid by urban consumers for a fixed basket of goods and services which include food and beverages, housing, apparel, transportation, medical care, recreation, education, communications and other miscellaneous expenditures. CPI calculations employ a Laspeyres formula which weights products based on their importance in typical household budgets. This encompasses thousands of individually priced items aggregated into broader categories and summarized as monthly percentage changes from a designated base year. Core variants exclude volatile food and energy components to isolate underlying inflation pressures.
CPI data reveals the extent price rises are diminishing or maintaining consumers’ purchasing power over time. Mild inflation around 2% annually is generally consistent with steady economic activity and asset performance. However, sustained spikes above 3% reduces spending appetite as incomes fail to keep pace, potentially pressuring corporate revenues and profit margins if not passed onto consumers. On the other hand, deflation raises concerns over falling demand, wages and collateral values for loans.
Understanding CPI behavior guides portfolio allocation across equity sectors, fixed income duration and currencies stands. For example, inflation surprises spurring interest rate hikes prompt trimming exposure to rate-sensitive longer-term bonds in favor of TIPS, commodities, real estate and international markets holding stronger growth potential during tightening cycles. Conversely, disinflation lifts shares reliant on affordable consumer products and services or lends support to bonds. Below is a CPI chart of India.

4. Employment Rate
The employment rate is a key metric monitored by investors to gauge the health of the labor market and household sector spending power driving much of economic activity globally. The employment rate refers to the percentage of the working age population currently employed, calculated by dividing the number of people in work by the total working population.
Data is typically disseminated by national statistical agencies using surveys sampling thousands of households monthly regarding employment status details. Categorizations include the number of full-time and part-time jobs, reasons for unemployment like voluntary resignation or layoffs, hours worked, and demographic characteristics. A high and climbing employment rate is favorable for investors as it signals robust job creation covering new labor market entrants while vacancies reflect widespread business expansion and resilience amid adversity. Steady increases sustaining markedly below 5% unemployment bolster confidence that aggregate demand will hold up through business cycles supported by wage-earning consumers.
However, a declining or stagnant rate is cause for concern, implying possible labour shortages constraining growth or hiring freezes if not outright cuts if recession looms. Either scenario threatens to negatively impact household incomes, spending patterns, and corporate profitability projections underpinning equity valuations. From an investment perspective, employment data helps gauge the probability of sustained consumption, lending support to sectors like housing and discretionary goods relying on job and wage security. Regions exhibiting particularly robust job gains outperforming national averages stand to see multipliers lifting other locally tied industries as well.
5. Inflation
Inflation refers to the rate of increase in the general price level of goods and services over time within an economy. Inflation is an important metric tracked closely by investors as persistently high inflation erodes purchasing power, disrupts corporate planning, and influences monetary policy impacting financial conditions. While various measures exist, the most widely followed inflation gauges utilize price indices like the Consumer Price Index (CPI) that track the average change in prices consumers pay for retail items. Others include the GDP deflator and Producer Price Index measuring inflation at wholesale levels.
Inflation outcomes shape investment returns, interest rates, and business operations. Low predictable increases around 2% are generally positive, but excessive surges pose challenges. Sustained spikes stifle consumer spending as incomes fail to keep pace, pressuring corporate revenues and profit margins if unable to pass higher costs onto customers. This hampers business investment and expansion plans. High inflation also reduces appetite for fixed-income assets whose future cash flows are being diminished in real terms, favoring inflation-protected bonds, commodities, real estate, and stocks able to periodically raise prices or tied to underlying items whose prices are climbing. Conversely, disinflation supports bonds and favors companies reliant on affordable goods/services.
Charts plotting year-over-year inflation gauges versus central bank targets aid portfolio adjustments. Persistent overshoots increase the odds of tighter policy crimping lending activity and stunting growth, implying a need to cut rate-sensitive holdings. Yet contained results reinforce expectations for steady accommodation buttressing assets. Below is India’s latest inflation chart.

Understanding monthly inflation changes helps gauge the macroeconomic environment’s bearing on company fundamentals and the attractiveness of different income-producing assets. Staying abreast of price pressures enables preemptively adjusting exposures according to evolving return and risk dynamics. By monitoring multiple inflation metrics, investors develop a cohesive view of trends influencing investment prospects across asset classes.
6. Interest Rates
Interest rates constitute a core economic indicator investors rely on heavily to inform positioning across asset classes. Simply defined, interest rates reflect the cost or yield of borrowing and lending money over time, influencing household consumption, business investment, and entire swaths of the credit system.
Rates are generally set by central banks like the Reserve Bank of India and two major indices are used to measure inflation rates, these are; Wholesale Price Index (WPI) and Consumer Price Index (CPI).
The Reserve Bank of India (RBI) adopted the Consumer Price Index as primary parameter to measure inflation in 2014.
The Consumer Price Index is the measure of average change in the prices of consumer goods and services purchased by households.
The CPI in India is published by the Central Statistical Organization (CSO).
For investors, interest rate movements are crucial as they dictate the returns available from fixed-income holdings while also acting as a transmission mechanism for monetary policy’s effects throughout the broader economy. Declining rates tend to lift investment and consumption by lowering financing expenses, energizing stocks, while rises introduce headwinds that merit adjustments.
Rate levels and changes guide decisions spanning duration selections within bond portfolios, preferred allocations between fixed income and other asset classes, and tactical opportunities emerging from short-term rate fluctuations. Lower yields favor longer maturities, while higher rates support shorter-term Treasury bills and floating-rate notes.
Charts tracking interest rate history lend perspective on the current policy stance. Steep downtrends from peak levels signal sustained accommodation, potentially warranting greater allocations to rate-sensitive assets. Yet a shift to sideways or upward drifting raises flags for preparations in case tightening ensues. Below is India’s interest rate data in a chart (upto march 2023).

A reliable grasp of interest rate drivers and their quantified settings through metrics released by central banks and market data providers is indispensable for making informed portfolio exposures aligned with the prevailing economic climate defined in large part by cost of capital dynamics. Their monitoring underpins tactical and strategic investment management routines.
7. Monetary Policy
Monetary policy refers to the strategies and tools employed by a central bank such as the Reserve Bank of India (RBI) to influence the level and growth of money supply within an economy. While no single formula is used, key levers include controlling interest rates and the availability of credit by expanding or contracting the reserves of financial institutions.
Adjusting policy settings aims to maintain price stability, full employment and moderate long-term interest rates conducive to balanced economic expansion. For example, lowering rates strengthens growth by boosting lending, borrowing and investment, increasing inflationary pressures, while hikes counter inflation and stabilize prices by curtailing money supply. The effects of policy shifts take time to transmit fully but ultimately influence financial conditions supporting or restricting business activity, employment and consumer behaviors driving output and inflation trends impacting corporate and economic prospects. Understanding the objectives and actions of monetary authorities through disclosure of policy statements, meeting minutes and economic projections assists investors. Accommodative stances warrants additional risk-taking as supportiveness lifts asset valuations, whereas tighter conditions present headwinds requiring defensive preparation.
Exposure decisions spanning duration, credit quality, industry subsets, and international diversification depend partly on the policy backdrop. Even gradual adjustments motivate timely shifts between rate-sensitive and inflation-linked holdings. Monitoring indicators like money supply growth, loan volumes and interest rates relative to policy targets provide cues on the potency and transmission of policy implementation. Signs of momentum exceeding or falling short of objectives justifies adjustments depending on the ensuing economic implications.
8. Industrial Production
Industrial production statistics shed light on the output and momentum of the manufacturing sector, a core driver of economies worldwide. The figures gauge monthly or quarterly volume changes in factory, mining and utility output compared to a baseline year.
The index measures the performance of various industrial sectors within an Indian economy. It is calculated and controlled by CSO (Central Statistical Organization). Respondents provide shipment volumes that are aggregated, seasonally adjusted and indexed against the reference period. Industrial production insights reveal how systemic demand and productivity are tracking versus expectations guiding corporate growth and earnings outlooks. Vigorous rise signals steady consumption needs are being satisfactorily met through supply expansion. Yet weakness foreshadows softening order books, pricing pressures and potentially reduced capex budgets in the months ahead.
Understanding production trends enables tactical shifts among industries set to outperform based on evolving consumption currents. Extended slumps also justify trimming allocations to goods producers or their suppliers until rebounding momentum emerges.
Industry subindexes also highlight leaders and laggards. While unavoidable some cyclicality exists, sustained divergences often imply fundamental changes are afoot benefiting certain industry groups over others from a strategic perspective.
9. Retail Sales
Retail sales statistics provide a monthly overview of consumer spending, a major growth driver globally accounting for around two-thirds of GDP in developed nations. The figures track the change in total receipts at brick-and-mortar, online and catalog retailers across segments like clothing, electronics and groceries.
Data is compiled by governmental agencies using surveys of thousands of retail businesses to gauge sales versus the same month in the prior year. Responses factoring trends, promotions and seasonal adjustments are aggregated and released as both nominal sales and volume measures excluding price impacts.
For investors, retail numbers are a bellwether of discretionary outlays underpinning corporate profits amid macroeconomic crosscurrents. Persistent nominal gains corroborate full employment and rising wages are empowering consumers as expected. Yet disappointments presage challenges ahead for retailers, manufacturers and related industries needing robust consumption to attain forecasts.
Sector breakdowns spotlight outperformers and laggards, aiding strategies attuned to shifting spending proclivities. For example, weakness beyond recessionary periods implies market share changes are unfolding benefiting some chains over others. Tactically, retail data guides decisions like tilting into durable goods ahead of large planned purchases, or protecting portfolios if momentum flags unexpectedly. Identifying specific categories fueling or weighing on the monthly consensus also enhances industry allocations.
10. Prime Rate
The prime rate refers to the interest rate large domestic banks charge their most creditworthy corporate customers. The prime rate serves as a base rate for pricing various consumer and commercial loans and is influential beyond direct borrowers. Usually set as a percentage over the target federal funds rate managed by the central bank, prime typically ranges from 3-5% and is aimed at healthy companies able to repay debt readily. Adjustments align loan terms with credit market conditions impacted by monetary policy settings. Prime rate movements signal shifts in financial conditions faced by businesses nationwide.
Declines unleash credit to fuel investment, hiring and expansion supporting stock market gains. Meanwhile, frequent hikes hints tighter financial restraints are developing that could eventually weaken growth. Duration selections within fixed income portfolios depend partly on prime influences. Lower rates tilt portfolios longer, taking advantage of cheaper bank funding driving lending. Yet steady climbs encourage shortening to mitigate extension risk if rates continue higher. Prime also guides industry exposure. Rate Sensitive sectors like housing face headwinds from elevated loan costs, warranting monitoring. But rate-neutral sectors tied to demand basics like staples fare better during tightening cycles.
Prime’s role interfacing monetary policy with corporate capital needs renders it a valuable benchmark steering investors’ willingness to deploy leverage within portfolios. Its close scrutiny enhances timely decisions appropriate to evolving financial conditions impacting company fundamentals and valuations.
What is the data source used for economic indicators?
The primary data source used for compiling most economic indicators in India is the Central Statistical Organisation (CSO). CSO is India’s nodal agency for official economic and social statistics under the Ministry of Statistics & Programme Implementation. As part of its mandate, CSO coordinates statistical activities across various government agencies in India and states.
CSO regularly publishes a wide range of reports and compendiums that disseminate time-series data on socio-economic parameters spanning over 50-60 years. Key publications include the annual ‘Statistical Abstract of India’ which provides a consolidated reference of statistics across nearly all sectors of the economy over long periods. Maintaining standardized collection methodologies and classifications allows for meaningful analysis of trends and anomalies beyond snapshots.
Reliable long-term datasets generated by CSO fulfill domestic needs of policymakers, researchers, private analysts while also powering cross-country analyses by international organizations like UN agencies. Specialized compendiums solely dedicated to compiling indicators over multi-decade windows strengthen statistical rigor indispensable for comparative studies.
Indices such as Index of Industrial Production, Consumer Price Index, Index of Agricultural Production that influence policy decisions are also primarily estimated by CSO on a monthly/quarterly basis. Financial sector databases like those pertaining to Banking, Insurance, Corporates etc. are maintained by dedicated regulatory bodies but periodically integrated into CSO publications.
CSO sources raw data from extensive surveys, census reports and administrative data collected by various line ministries/departments. To ensure quality and consistency, standardized survey methodologies are followed alongside periodic revisions of sampling frameworks capturing structural changes. International guidelines are adhered to ensure cross-country compatibility.
What is the most important economic indicator?
Gross Domestic Product or GDP is widely considered the single most important economic indicator for investors and policymakers alike. GDP paints a broad picture of a nation’s overall economic health and growth trajectory through a quantitative lens. GDP measures the total monetary value of all finished goods and services produced within a country’s borders in a specific time period, usually one quarter or one year. It provides investors with a simple yet comprehensive snapshot of overall production, income, spending and economic output, enabling effective cross-country comparisons of the size and growth pace of different economies.
GDP growth is a primary metric central banks target to support sustained job creation and rising living standards over time. By factoring expenditures from personal consumption, business investments, government spending, and net exports, GDP encapsulates activity levels across all industries and accounts for the interaction between different sectors of the economy. This comprehensive coverage affords a fuller understanding of underlying supply and demand dynamics influencing corporate revenues, wages and tax receipts behind asset price movements. High GDP readings signal broad-based momentum is persisting as expected.
How accurate are economic indicators?
Economic indicators provide invaluable signals of economic trends but are not always perfectly accurate given the complex interplay of dynamic market forces. Even experienced leaders like Herbert Hoover and Ronald Reagan have made erroneous predictions that prosperity or fiscal outcomes would differ from what ultimately transpired. Most indicators rely on surveys that take time to process, meaning the latest monthly/quarterly statistic reflects a past period and not necessarily current momentum.
The economic indicators reflect the impact on stocks with sustained periods of weeks or months. Short term traders take advantage of volatility crashes when these announcements are made during press conferences. When the volatility stabilizes after the numbers are released, the short term traders don’t really get benefited hence, the economic indicators are more important for long term traders.
Sudden shocks cannot be fully reflected for weeks or months. Forecasting models use past relationships as guides but cannot account for all supply and demand influences, which are subject to unpredictable behavioral changes, policy surprises, and external volatility like commodity prices or conflicts. Initial readings often undergo revisions as more comprehensive data emerges over time, changing the picture. However, revisions alone do not undermine indicators’ broad ability to signal directional shifts if monitored iteratively.
How are economic indicators classified based on timing?
There are three main categories that economic indicators are classified into based on the timing of the information and data they provide – leading, coincident and lagging indicators.
1. Leading Indicators
Leading economic indicators are measures that tend to shift before the overall economy and provide early signals on future economic trends. Leading indicators are metrics that often change direction before the overall economy and point to where the broader economy is heading in the coming months. They capture aspects of the economy that tend to accelerate or decelerate prior to changes in overall economic activity. Leading indicators provide forewarning on impending expansions or slowdowns.
It suggests the broader economy will likely follow suit in the near future, when they move in the same direction for a sustained period. Their changes signal potential turning points for businesses, consumers and policymakers to factor into decisions. Leading indicators provide early signals of future trends. Average weekly manufacturing hours and initial jobless claims predict hiring or layoffs versus monthly unemployment data.
New orders for consumer goods, materials and capital goods imply future production and revenues. Vendor delivery times note rising or falling demand. Building permits forecast construction and housing. Stock prices reflect expected growth and profits. Consumer surveys’ optimism/pessimism inspire spending. Interest rate spreads’ short vs long-term outlooks provide cues on overall activity. Together these signal where the broader economy heads in coming months.
2. Coincident Indicators
Coincident indicators provide insight into the current state of the economy by moving alongside overall economic activity levels. Coincident indicators are metrics that generally fluctuate concurrently with changes in broad economic conditions, validating whether expansion or contraction is underway. They do not predict cyclical swings but rather confirm the present trajectory. By integrating data that closely mirrors aggregate demand and production trends, coincident indicators corroborate if growth is tracking recent forecasts or projections made based on other indicators like leading ones. Their movements help identify the prevailing economic phase.
These indicators track current economic shifts. Nonfarm payrolls swiftly reflect labor market changes matching monthly GDP. Industrial production parallels manufacturing output coincident with overall activity. Retail sales mirror consumer spending alterations as incomes vary. Personal income less transfers coincides with wage/salary evolutions alongside GDP. Manufacturing/trade sales move with inventory investment and final sales GDP components. The unemployment rate generally synchronizes with performance levels. Together these confirm if an economy is presently growing or contracting through synchronizing movements.
3. Lagging Indicators
Lagging economic indicators are measures that tend to shift after changes have already occurred in overall economic activity levels. Lagging indicators validate that a particular phase in the business cycle has taken place by responding to changes in the broader economy with a delay. They confirm where the economy has already been.
As the economy expands or contracts, lagging indicators gradually follow suit over weeks or months. By the time they shift meaningfully, the underlying growth or weakness has often become apparent through other coincident or leading indicators. Lagging indicators confirm prior economic phases. Average unemployment duration bottoms out lagging recoveries. Commercial and industrial loan values rise belatedly as balance sheets expand during expansions.
Consumer price inflation accelerates after overheating and capacity constraints. Labour costs relative to output increase lagging full employment and wage pressures. Inventory-sales ratios follow production and demand trend changes. Consumer credit levels trail personal income rises. Average bank lending rates adjust laggingly to prior shifts after most businesses feel impacts. Together these confirm the phase the economy has already moved through.
Monitoring an array of lagging indicators provides confirmation of growth or weakness surfaced earlier through leading/coincident factors, while their delayed reactions offer early glimpses of pending directional changes before manifestation elsewhere.
How are economic indicators classified based on direction?
Economic indicators are classified based on direction intro three. They are procyclical, countercyclical and acyclical.
1. Procyclical indicators
Procyclical indicators are economic metrics that tend to move in the same direction as the broader economy over the course of the business cycle. Procyclical indicators typically increase during periods of economic expansion and decrease during downturns, amplifying the trajectory of overall activity levels. Their movements reinforce rather than counter the prevailing cyclical tide.
As aggregate demand rises and falls, procyclical indicators positively correlate by also strengthening or weakening in tandem. Their amplifying nature magnifies insights into growth drivers and recessionary pressures.
Major economic metrics fluctuate pro cyclically with the business cycle. Gross Domestic Product, as the broadest measure of total output and income, undulates in tandem with economic conditions. Employment levels typically rise alongside expansions as companies boost hiring, and fall during contractions when layoffs increase. Industrial production commonly swings up during growth phases as manufacturers ramp up to meet heightened demand, before rotations downward amid softer demand during downturns.
Consumer spending routinely rises procyclicality with growth as incomes and confidence improve, but pulls back in recessions. Capital investments also usually lift and ebb cyclically due to their discretionary nature and reliance on stable sales and profit outlooks. Together, these key procyclical indicators demonstrate how economic activity naturally ebbs and flows in synchronization with the broader phases of expansion and contraction over the business cycle.
2. Countercyclical indicators
Countercyclical indicators are economic metrics that tend to move in the opposite direction of fluctuations in the overall economy over the course of the business cycle. Countercyclical indicators typically increase when general economic activity is slowing and decrease when activity is expanding. Their divergent movements counterbalance the prevailing cyclical tide.As aggregate demand rises, countercyclical indicators will fall or rise more slowly. Conversely, during downturns they rise or decline less sharply. This inverse relationship provides valuable indications on non-confirmation of trend assumptions.
Important metrics tend to move countercyclically with the business cycle. Unemployment rates fall during economic booms as more jobs become available but rise when growth weakens and layoffs surge. Wage growth gets stagnant or increases slower in expansions yet accelerates amid tighter labor markets accompanying recessions. Inflation often remains stable or declines slightly as demand grows but jumps as slack is absorbed and competition lessens during downturns.
Interest rates are typically reduced by central banks to stimulate demand countercyclically when activity is declining, versus raised when economies overheat. Government spending is also deployed countercyclically through automatic stabilizers and discretionary fiscal policy to offset lacking private sector demand during contractions. Together, these countercyclical indicators demonstrate how certain economic variables typically follow an inverse pattern compared to the broader phasing of the business cycle.
3. Acyclical indicators
Acyclical indicators are economic metrics that generally exhibit little to no correlation with the ups and downs of the overall business cycle. Their movements tend to be independent of fluctuations in broad economic activity levels.Acyclical indicators rise or fall regardless of whether an economy is expanding or contracting. They do not consistently amplify or counter cyclical trends as procyclical and countercyclical gauges do. Compared to indicators moving jointly or inversely with GDP, acyclical ones change for reasons specific to their underlying dynamics rather than macroeconomic currents.
Common examples include some factors that vary little with the business cycle. Population steadily grows via births outnumbering deaths. Land values change more on zoning rules than GDP short-swings. Climate and weather autonomously impact outputs. Commodity prices rely on supply/demand beyond single economies. Geopolitics unpredictably impact sensitive goods. New tech disrupts industries irrespective of activity. Distortions like bubbles form from investment behavior, not the cycle. These indicators follow long-term trends outside typical boom-bust sequences.
How are economic indicators used in fundamental analysis?
The role of economic indicators in fundamental equity analysis involves leveraging data points like GDP, industrial production, retail sales, interest rates, money supply, government spending, employment, wages, hours worked, inflation, exchange rates, trade balances, foreign GDP, inventories, supplier delivery times, industry production, capacity utilization, and orders backlogs to gain insights into macroeconomic conditions influencing corporate profits, costs, and competition that assist in calibrating policy influence and incorporating macro trends into earnings forecasts and multiples while highlighting overseas sales vulnerabilities, new market opportunities, procurement stresses, pricing power within sectors over cycles, and ultimately enhancing the accuracy of analysts’ earnings and cash flow projections, multiples, price targets, and investment theses. 7 key ways analysts leverage various indicators includes the following. GDP, industrial production and retail sales figures are leading demand proxies that shape revenue potentials. Sustained growth signals solid consumerism supporting most industries, while weakness points to earning headwinds.
How does the stock market work as an economic indicator?
The stock market functions as a valuable leading economic indicator by reflecting investor expectations of future corporate profits and broader economic conditions through stock price movements that attempt to discount future cash flows, are influenced by interest rate policies, respond to fiscal measures, impact business spending through wealth effects, indirectly anticipate inflation risks depending on valuation expansion speeds relative to fundamentals, signal credit availability impacts through bull and bear cycles, provide early clues to aggregate demand drivers through certain sector performances relative to the overall market, and underscore changing trade and investment flows between nations through foreign market gains or losses.


 Previous Article


![15 Investing.com Alternatives [Free+Paid] You Should Use in 2026](https://www.strike.money/wp-content/uploads/2026/04/Investing.com-Alternatives.jpg "15 Investing.com Alternatives [Free+Paid] You Should Use in 2026 64")
![15 TradeStation Alternatives [Free+Paid] You Should Use in 2026](https://www.strike.money/wp-content/uploads/2026/04/TradeStation-Alternatives.jpg "15 TradeStation Alternatives [Free+Paid] You Should Use in 2026 65")
![15 Chartink Alternatives [Free+Paid] You Should Use in 2026](https://www.strike.money/wp-content/uploads/2026/04/Chartlink-Alternatives.jpg "15 Chartink Alternatives [Free+Paid] You Should Use in 2026 66")
: Overview, 10 Types of Indicators, Settings for Different Markets 67")


 : Definition, Formula, calculation, Uses, Advantages Vs limitations 70")


No Comments Yet.