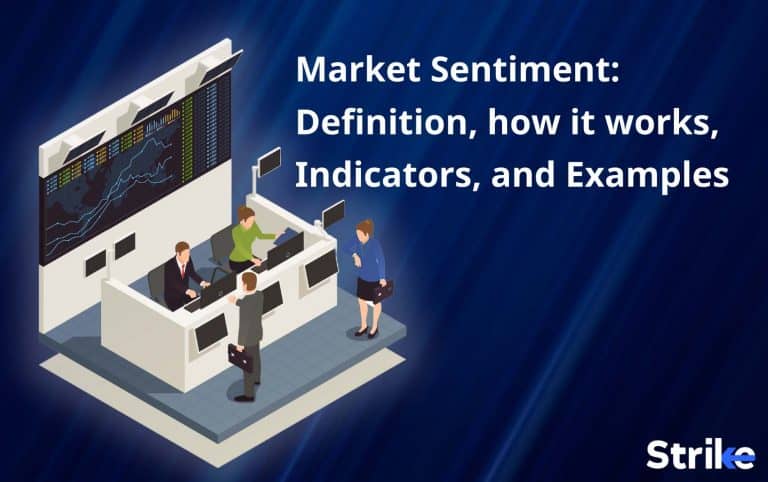
Market sentiment represents the mood of financial markets and the general feeling among traders and investors. Market sentiment is a phenomenon which throws light on the emotional aspect of the stock market. Usually, investors hear that emotions and feelings don’t play a part in stock market prices. But it is not valid in every case.
There are times when prices increase and decrease when a considerable mass of investors deems it. For instance, the prices of a company’s stocks can go down if that company is found in bad news. The Investors can decide to boycott the stock, and the stock prices can thus decrease.
Another instance is when the investors have more purchasing power. More bulls or buyers may be in the market during such a phase. And such a market is known to be bullish.
Market Sentiment is not inherently a good or a bad thing. Market Sentiments can cause the stock market to be volatile since they can change the predictions made by the technical indicators. Therefore, in times such as those, traders can make good use of it. Day traders can analyse the change and earn profits by taking advantage of the price fluctuations.
But there are still indexes that can indicate how much a stock’s price depends on market sentiments. In other words, there are indicators which predict the stock prices that change due to investor movements. A few indicators are CBOE Volatility Index, High – Low Index, Moving averages etc.
What is Market Sentiment?
Market Sentiment is when an investor’s feelings and attitude towards the stocks determine the market prices. Market sentiment is the overall tone and mood of the market. It can be bearish or bullish depending upon the number of buyers and sellers in the market. The prices increase when there is a majority of buyers in the market.
Then it is said that the market is bullish. Or that there are bulls in the market. On the other hand, the prices decrease, and it is said that the market is bearish if most people are sellers.. Or that there are bears in the market.
What is the other term for Market Sentiment?
Market Sentiment is also known as investor sentiment. As the name suggests, it refers to the emotions and feelings of the investor and how they can influence stock market prices. Market Sentiment can be seen from two perspectives, the market’s perspective and the investor’s perspective. From the former point of view, market sentiment can decide the market’s trajectory and price fluctuations.
The latter view determines how the investor can invest or when they can invest. For value investors, bear markets are the right time to invest, but for others, it is the right time to sell. Therefore, it depends on the investors and traders and the term investor sentiment. Market sentiments can also be called for investor attention as the investors’ attention changes the valuations of the stock, at least for a while before the potential price correction.
How does Market Sentiment work in the Stock Market?
The stock market is usually considered where fundamental and technical analysis is used to predict the stock market. But at times, market sentiments can overwhelm the market, and the trend and mood of the market can change. But this, too, can be predicted to a certain extent. Market sentiments vary, ranging from gossip to macroeconomic conditions and foreign economic policies.
This means that market sentiment isn’t such a rare event and can happen at any time and to any security in the stock market. When investors feel like they can buy more, it means that there are more bull investors in the market, which is called a bullish market. And when more sellers are in the market, it is called a bear market.
Bullish markets are usually driven by greed, and bearish markets are driven by fear. And since these are emotions that play a role in the prices of the stock market, we can call this phenomenon market sentiment.
What does Sentiment mean in Stocks?
Sentiments in stocks mean investor sentiment. Investor sentiments can cause changes in the attitude of the market. It can make the stock markets bearish or bullish and, at times, even neutral depending upon the type of investors prevalent during a period. Usually, traders are asked not to involve their feelings while investing or trading in the stock market.
But emotions and feelings are an inherent part of being human. And the majority of desires and emotions cannot be overlooked. Therefore, even though traders and investors shouldn’t use their feelings while investing, they should know that a more significant entity is at play based on the emotions of the entire investing and trading community.
How does Market Sentiment influence Technical Indicators?
Market Sentiment does not depend on the fundamentals of the stock market or financial systems. Market sentiments are purely based on the human psyche and emotions. But they do influence the technical indicators. Market sentiments are short-term fluctuations in the prices of securities in the stock market.
And therefore, they should be considered while predicting the stock trajectory. So investors and traders, while investing in the stock market while analysing the technical indicators, look out for the mood and sentiments of the stock market. The number representing the greed or fear factor can be found by calculating the trade volume and prices.
How do Investors use Market Sentiment?
Investors are those people who make long-term investments, and traders are those people who make short-term trading profits. Market sentiments cause changes in the prices of the stock market. This means that they change the trend of the stocks. Traders can make use of this change by day trading. But on the other hand, investors can use this by finding the right opportunity to invest in a stock that will have the potential to grow in the future.
For instance, It can be an opportunity if the stock has good value and is predicted to grow even if it has had bearish sentiments for a while. Value investors are usually contrarian investors who buy when others sell and sell when others buy.
How to use Market Sentiment in Trading?
Market Sentiment can be used to the advantage of day traders if they know how to use it correctly. The key is to predict the market sentiments of the future. Investors may know what the market sentiment is today. But they need to know what will be the market’s mood tomorrow. For that, investors and traders should have a sound awareness of the outside world and learn how to read charts and indicators that provide data regarding market sentiments. Market sentiments are a fickle thing, and they can be changed if new information is added to the equation. Therefore, traders should be vigilant enough when that further information arises.
Using market sentiment, one should have data regarding the trade volume to trade in the stock market successfully. This means traders can analyse the trading volume to determine when the market sentiments will change. For instance, the prices will decrease when a stock’s prices remain the same or are on the rise and if the volume is slowly decreasing. Similarly, when we see that demand is on the rise for a stock or a group of stocks, we can predict that the prices will increase. Or even that there will be even more bulls in the market.
What are the Indicators Used to Measure Market Sentiment?
Market sentiments can be measured using some indicators. Market sentiment indicators help investors and traders to know the market trajectory and how the prices may change accordingly. The following is a list of the market sentiment indicators extensively used by traders and investors.

1. CBOE Volatility Index (VIX)
COT or Commitment of Traders can be considered a market sentiment indicator that tracks the futures market. Futures are a type of financial instrument wherein stock traders and investors set a price to buy at a later date. Now, this indicator tracks the futures prices of all the companies that provide it.
Therefore, investors and traders can know when there is a demand. A demand will mean that the prices are higher. But there can also be a chance for it to go down the next moment if it is too high,
2. Commitment Of Traders (COT)
COT or Commitment of Traders can be considered a market sentiment indicator that tracks the futures market. Futures are a type of financial instrument wherein stock traders and investors set a price to buy at a later date. Now, this indicator tracks the futures prices of all the companies that provide it.
Therefore, investors and traders can know when there is a demand. A demand will mean that the prices are higher. But there can also be a chance for it to go down the next moment if it is too high,
3. Moving Averages
Moving Averages are an indicator of a security’s average stock prices over time. The usual period taken is 50 and 200. Moving Averages mean that averages of a stock price change day by day. Therefore, when a trader wants to know whether the market is bullish to bearish, they can plot the 50-day average and 200-day average and see whether the 50-day average comes above or below the 200-day average.
The market is said to be bullish if it comes above since a bullish market means rates are above the average. And vice versa, the market is said to be bearish if it comes below.
4. Bullish Percent Index
Similar to the previous indicators mentioned above, this indicator ultimately shows whether the market is bullish or bearish. The BPI indicator or the Bullish Percent Index Indicator gives a number to represent the market trend. The BPI indicator is calculated by dividing the stocks generated by the point and figure buy signals with the total securities in that cluster and multiplied by a hundred.
The percentage given can be used to determine the trend. The market is said to be bullish if the rate is more than 70%. And it is said to be bearish if the percentage is less than 30%.
5. High-low Index
The High – Low index is an indicator which compares the yearly highs and lows of a stock. This comparison gives the investors an idea of how the stock has prevailed over the year, and the chart shows it can provide an idea of when it has had bulls and bears trading the stocks. Contrarian investors extensively use this indicator.
How to read the Market Sentiment chart?
Market Sentiment stays outside the realm of the usual strategies used by investors and traders while buying and selling securities in the stock market. Market sentiment is a psychological phenomenon that takes place in the stock market. And investors and traders can only recognise it if not for the number of market sentiment indicators.
These indicators give figures, numbers and charts by comparing the prices of the stocks of a given period. And while comparing, sometimes it can be found that the market is currently in an upward trend and at other times in a downward direction. Along with this figure, the trading volume should also be found to accurately determine whether or not the trend is about to change.
But more than merely reading charts and analysing them is required. It will be best if you also were vigilant about the market news and new developments in the business world.
What are Examples of Market Sentiment?
Market Sentiments cause changes in the trajectory or the stock market’s trend. But there are times when market sentiment has caused significant upheaval in the stock market. One of the major events was the dot-com bubble. This happened in the late 1990s. Investors believed that companies based on technology and the internet will be the next big thing. The investors weren’t wrong, but the valuations were too much.
And then, in the 2000s, the market corrected itself. Many bears were in the market, and the dotcom bubble finally burst. This example shows how the investors themselves have raised the valuations of the stocks of blue-chip companies, and eventually, when they lost interest or after the hype had gone down, the market crashed.
But of course, it isn’t just the market sentiment that causes price changes. There can be factors like the value of the stock and the company. The root cause of the investor sentiments can include a new foreign policy, technological development or even a random rumour.
What are the Best Books about Market Sentiments?
There are plenty of trading books in the market, and books on the topic of market sentiments are also numerous. But here are our top 3 best books about Market Sentiment.

- Trading on Sentiment: the power of minds over the market – Richard L. Peterson writes this book. The book has garnered popularity among the stock market crowd, although this is his debut. But buying this book requires you to have a full pocket.
- Trading in the Zone: A book by Mark Douglas is an easy-to-understand book on the psychology of trading. The book discusses market sentiment and how one can manage one’s mind while trading.
- Sentiment Market Analysis: This book is written by Michael N. Kahn. This is an excerpt from a main book by Michael. The extract is found online and throws light on market sentiments, its theories, and the like.
The books mentioned above are just a few among the vast ocean of books on market sentiments. Those mentioned above are readily available and are rated above average as well.
Is Market Sentiment a good Indicator?
Yes, market Sentiment is a good indicator for traders to choose the right stocks to trade. Market Sentiment influences the technical indicators as the analyses include the overall market attitude as well in it. But it should not be considered the only strategy to trade in the stock market.
At any point in time, there can be a price correction when the prices of the stocks change to what they value. Therefore, investors and traders should only root for market sentiment sometimes.
Moreover, new information about stocks and companies floods the markets every day, and as traders, you should know about them and rise above them. Understand that emotions will be at play, but keep personal feelings and emotions out of your decision-making. It is a tricky thing to do, but it will be the wisest option.


 Previous Article


![15 Investing.com Alternatives [Free+Paid] You Should Use in 2026](https://www.strike.money/wp-content/uploads/2026/04/Investing.com-Alternatives.jpg "15 Investing.com Alternatives [Free+Paid] You Should Use in 2026 16")
![15 TradeStation Alternatives [Free+Paid] You Should Use in 2026](https://www.strike.money/wp-content/uploads/2026/04/TradeStation-Alternatives.jpg "15 TradeStation Alternatives [Free+Paid] You Should Use in 2026 17")
![15 Chartink Alternatives [Free+Paid] You Should Use in 2026](https://www.strike.money/wp-content/uploads/2026/04/Chartlink-Alternatives.jpg "15 Chartink Alternatives [Free+Paid] You Should Use in 2026 18")
: Overview, 10 Types of Indicators, Settings for Different Markets 19")


 : Definition, Formula, calculation, Uses, Advantages Vs limitations 22")


No Comments Yet.