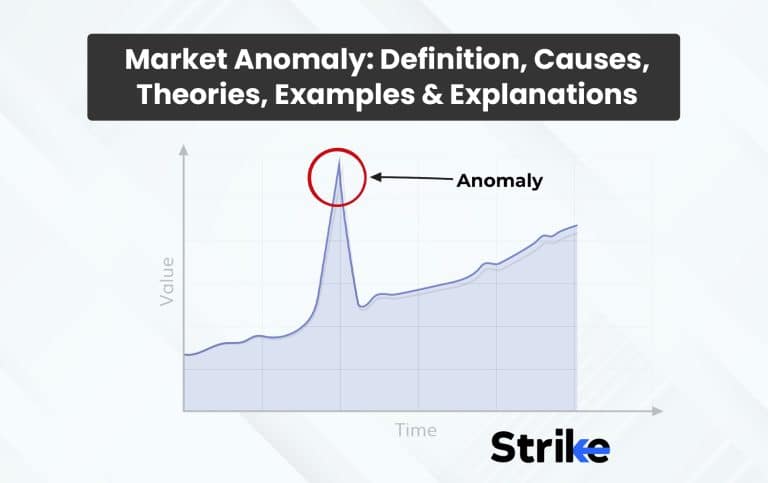
A market anomaly is any movement that seems to conflict with various theories of asset pricing. A market anomaly is a cross-sectional and time series pattern in securities returns that is not anticipated by a core paradigm or theory. A market anomaly may occur in either bull or bear markets. It was Kuhn who first popularized the word “anomaly” in 1970. The documentation of anomalies is often a precursor to the beginning of a transitional period leading to a new paradigm.
Typically, the findings of financial market anomalies are the result of empirical tests that are based on a joint null hypothesis. This joint null hypothesis states that security markets are informationally efficient and that returns behave in accordance with a prespecified equilibrium model (such as the capital asset pricing model, or CAPM. If the joint hypothesis is shown to be false, we will not be able to determine which of the two hypotheses contributed to the failure.
Therefore, despite the fact that anomalies are often construed as evidence of market inefficiency, one cannot legitimately draw such a conclusion since the rejection may be the result of an inaccurate equilibrium model. Once discovered by researchers, some people believe that the magnitude of financial anomalies will tend to decrease as investors seek to profitably exploit the return patterns or as a result of their discovery being nothing more than a sample-specific artifact. This is one of the arguments that has been put forward. Even if this has occurred for some of the discoveries that will be described further on (for example, the weekend impact), the majority of the anomalies that will be examined are still present. Given the length of time that many of these patterns have been observed, it is reasonable to conclude that they do not provide proof of inefficiencies in the market.
Instead, it’s possible that our benchmark models provide explanations of the creation of equilibrium prices that are incomplete.
What is Market Anomaly?
Market anomalies are market patterns that appear to lead to abnormal returns more often than not. Due to the fact that some of these patterns are based on information that can be found in financial reports, market anomalies pose a challenge to the quasi-form of the EMH. The efficient market hypothesis (EMH) states that all stocks are properly priced and that abnormal returns cannot be earned by searching for mispriced stocks. Furthermore, because future stock prices follow a random walk pattern, they cannot be predicted. However, there do seem to be some market patterns that can lead to abnormal returns, thus violating the efficient market hypothesis, particularly the semi-strong EMH, which predicates that abnormal returns cannot be earned by learning all the available public information on companies and their stocks, and any other variables that may affect stock prices, such as economic factors. Hence, the semi-strong EMH would seem to negate the value of fundamental analysis.
What Causes a Market Anomaly?
Mispricing, unmeasured risk, constraints to arbitrage, and selection bias are the four basic causes of market anomalies. Mispricing is the most common explanation.
Mispricing creates a gap between the value of a security on the market and the worth of the asset when measured in terms of its fundamentals. The market price of a security is said to be equivalent to the present discounted value of all cash flows provided by the security, according to the law of one price, which stipulates that this relationship exists. However, this is not always the case since the prices of assets may sometimes become uncorrelated with their underlying values. A financial crisis or a contemporary incident in the economy can be to blame for the discrepancy in results.
The values of stocks are very sensitive to a variety of market and economic conditions, both domestically and globally, and may be quite unpredictable as a result.
The term “market risk,” which is synonymous with “systematic risk,” often refers to the sort of risk that is linked with a particular market. It may be traced back to the market’s economic climate, geography, political climate, social climate, or any number of other elements.
The phrase limit to arbitrage is often used in the world of finance to describe the possibility that observed asset price differences would persist. Arbitrage occurs when a rational trader identifies a price gap in an asset across two separate marketplaces and then invests in a manner that takes advantage of that price difference. According to the efficient market theory, this intervention will assist in bringing the markets closer to a state of equilibrium. But, if these traders operate asset management businesses and invest other people’s money, their activities will be subject to a great deal of scrutiny since the money belongs to other people. If they participate in arbitrage and the prices continue to be uneven for a period of time, the clients may become dissatisfied, and the trader may be forced to unwind the position at a loss in order to appease the customers. Because of this, the trader is only able to participate in so much arbitrage at any one time.
A form of bias known as selection bias occurs when data for statistical analysis are chosen in a manner that is not random. A mistake in the method used to pick the sample pool is the root cause of the bias. This error results in a portion of the data being arbitrarily omitted as a direct result of one of its characteristics. The decision not to include the subset in the analysis may have an impact on the statistical significance of the analysis, and it may also introduce a degree of bias into the estimations of the parameters of the statistical model.
What are the Standard Theories that are used to explain Market Anomalies in asset pricing?
Two standard theories used to explain market anomalies in asset pricing are the capital asset pricing model and Fama french three-factor model.
1. Capital Asset Pricing Model
The Capital Asset Pricing Model (CAPM) is used to evaluate possible investments in terms of projected returns by taking into account the element of risk. It is commonly used by financial experts and asset managers as a tool to assist them in making choices about investments.

The Capital Asset Pricing Model (CAPM) was a significant development because it was the first model that measured the link between risk and return. This allowed investors to accurately establish their expectations.
The Capital Asset Pricing Model (CAPM) was first developed in the early 1960s as a method for calculating projected returns based on risk. The CAPM was one of the most significant developments in finance theory.
The Capital Asset Pricing Model (CAPM) is important because it is able to demonstrate to investors what reasonable return expectations should be given a certain amount of risk. The Securities Market Line symbolizes the Capital Asset Pricing Model in Graphs.
One of the drawbacks of CAPM is that the assumptions made by CAPM about the functioning of capital markets, the actions of investors, and the level of risk-free interest rates can be unrealistic. For instance, it presumes investors have diverse portfolios, that they have access to risk-free borrowing and lending, and that capital markets are efficient and faultless.
2. Fama-French Three-Factor Model
The Fama-French Three Factor Model is a powerful framework for assessing past returns, gauging the value of active management, planning for the future, and more. The Capital Asset Pricing Model (CAP-M) has been supplanted by the Three Factor Model as the standard hypothesis for explaining stock market fluctuations and investor returns.

Understanding portfolio performance, determining the influence of active management, constructing portfolios, and projecting future returns are all significantly aided by the Fama-French Three Factor Model’s provision of a very valuable tool. The Capital Asset Pricing Model (CAP-M), which was formerly the most frequently accepted explanation of stock prices and investor returns, has been supplanted by the Three Factor Model as the most widely accepted explanation.
The price on the market is explained using the Three Factor Model, which takes a distinct approach. According to the findings of Fama and French, investors are worried about three different risk variables as opposed to only one. In point of fact, they discovered that in the actual world, investors are concerned about a diverse range of dangers. Market, size, and value risks, however, are the ones that have systematic prices connected to them and, when combined, do the greatest job of explaining both performance and pricing. These risks also have systematic values associated with them.
Investor returns are a reflection of a company’s cost of capital in the opposite direction. Even in the secondary market, the price of a company’s securities provides the most accurate estimate of the cost of the firm’s capital. When small businesses borrow money or issue securities on the capital markets, they are expected to pay a higher interest rate for the capital. Firms that are considered to be in a state of distress, defined as having low prospects, poor financial performance, irregular earnings, and/or weak management, are required to pay a higher premium for capital. Small companies and companies in trouble often have stock prices that are lower to compensate investors for the risks they face. The ratio of the stock’s adjusted Book value to its Market price was determined to be the most relevant statistic, as well as the one with the highest explanatory power, according to the findings of the Fama-French study (BTM). Value stocks are those that have a high BTM ratio.
What are examples of Market Anomalies in the Stock Market?
Examples of market anomalies include –
1. The Days of the Week
2. January Effect
3. Reversals
4. Dog of the Dow
5. Low Book Value
Let us learn more about these in detail.
1. The Days of the Week
The theory of efficient capital markets is subject to a phenomenon known as the day-of-the-week effect. This effect is a kind of anomaly that may be found within the theory. According to this phenomenon, the current average return of the market does not remain constant over all trading days of the week, which is contrary to what we would anticipate on the basis of the theory of efficient markets.

One example of a calendar anomaly is the day-of-the-week effect, which describes a situation in which the daily mean return varies depending on the day of the week. According to the theory known as the Efficient Market Hypothesis, the daily mean return of each asset should be comparable to one another:

The “days of the week” phenomenon is reviled by proponents of efficient markets because, in addition to giving the impression that it is accurate, it also defies logic. According to studies, the stock market is more volatile on Fridays than it is on Mondays, and Fridays also have a tendency to have better overall performance than Mondays do. Although it is not a significant gap, it has been there consistently.
This should not be the case for any specific reason; it just so happens to be the case. There may be some psychological elements at play here. There may be an air of confidence in the market as traders and investors approach the conclusion of the week and look forward to the weekend. On the other hand, the weekend may provide investors with the opportunity to catch up on their reading, stew and worry about the market, and build a pessimistic outlook heading into Monday.
2. January Effect
The January Effect is a calendrical concept that proposes that month-to-month fluctuations in stock prices tend to be less in January compared to other months. Many people nowadays are skeptical of the validity of the January Effect, despite the fact that it seems to have had some reality in the past.

Sidney Wachtel, an investment banker, is credited with being the first person to observe the January Effect in 1942. In the course of his research into the performance of the market going all the way back to 1925, he observed that equities had a tendency to see higher increases in January than in other months.
In later years, other scholars provided support for this idea, which then moved to the investigation of various types of asset classes. As it progressed, several people argued that the January Effect was the consequence of smaller companies outperforming bigger stocks at the beginning of the year. This theory was supported by the fact that the January Effect began in January.
Analysts have, over the course of many years, proposed a number of theories for this phenomenon, each of which has a variable degree of credibility. However, it is quite probable that the January Effect is caused by a confluence of many causes.
The first is that the January Effect was the inevitable consequence of people reaping their tax losses at the end of the year. During the months of November and December, investors selling losing positions to take advantage of tax savings put downward pressure on market prices. The next month, in January, investors began to repurchase their stakes, which led to an increase in prices.
3. Reversals
Reversal anomaly refers to the fact that stocks that have had relatively low returns over the previous month or week tend to earn positive abnormal returns in the following month or week, while stocks that have had high returns tend to earn negative abnormal returns.

The researchers, on the other hand, postulate that reversal strategies need frequent trading and rebalancing in assets with disproportionately high costs. They predict that this will result in a circumstance in which trading costs will impede successful strategy implementation. It’s possible that the findings may be read in such a manner as to suggest that the anomalous returns of reversal investment strategies, which were recorded in studies, provide the impression that these strategies are lucrative investment methods. However, because of the transaction costs, the strategies cannot be used. Therefore, there is no such thing as a strategy that is profitable.
Evidence shows that equities at either extreme of the performance range, over periods of time (usually a year), do tend to reverse course in the next period. This means that stocks that were last week’s best performers turn into tomorrow’s underperformers and vice versa.
This is supported not just by data from statistical studies but also by the fact that the anomaly makes sense in light of the basics of investing. If a company has been doing very well in the market, there is a good chance that its success has caused its price to rise; similarly, the opposite is true for stocks that have been underperforming in the market. Therefore, it would seem reasonable to anticipate that the companies that are overvalued would perform poorly (bringing their valuation back into line), while the ones that are underpriced will do very well.
It’s also possible that people anticipate reversals to succeed, which contributes to their success. That will assist move the stocks in precisely the predicted directions, making it something of a self-fulfilling anomaly if enough investors consistently sell the companies that were winners from the previous year and purchase the stocks that were losers from the previous year.
4. Dog of the Dow
Investors using the Dogs of the Dow approach invest in the ten Dow Jones Industrial Average (DJIA) companies with the highest dividend yields.

The American money manager and author Michael B. O’Higgins popularized the Dogs of the Dow method in 1991. The methods works according to the formula
Despite its central role in many indexing schemes, the Dow may also help investors zero in on attractive single equities. Indeed, if a company is considered worthy of inclusion in the Dow, it may be an excellent choice for a dividend portfolio.
Investing in the Dow 30 companies may be done in a number of different ways. The famous money manager Michael O’Higgins introduced the so-called “Dogs of the Dow” method back in 1991, and it has since become one of the most fascinating.
The Dogs of the Dow investment strategy recommends purchasing shares of the ten Dow components with the greatest dividend yield as a percentage of their price on an annual basis. You would then rebalance your holdings every year such that you always had 10% in the top ten dividend achievers.
This method is as easy as it seems, since it just necessitates reevaluating the Dow 30 each year based on their dividend performance.
This tactic is predicated on the idea that even the Dow’s stragglers are still solid businesses. Even if they fall out of favor with investors for a while, they usually recover when the market places a more accurate value on them again. As a result, investors may regularly restock their holdings with strong businesses that were previously written off as unreliable owing to fluctuations in the market or other such causes.
One of the many benefits of the Dow is that it represents some of the most renowned and well-known companies on Wall Street. Finding parts that can be purchased cheaply and then resold for a profit is an excellent investment opportunity for those looking for a steady income stream.
In principle, a company with a high dividend yield indicates that it is undervalued, and Dow components that are trading at discounts are often poised for a major comeback. In spite of the stock’s lackluster performance, investors will still enjoy a generous dividend.
The committee responsible for choosing which stocks make up the Dow focuses only on selecting the most financially stable and well-known corporations. If a firm really starts to lose its appeal, it will be supplanted by one that offers better long-term value. For well over a hundred years, this kind of rotation has been standard procedure for picking the stocks that make up the Dow. Because of this, the Dogs of the Dow strategy has been profitable for 30 years running.
5. Low Book Value
Academic studies have shown that equities trading at a price that is below their book value outperform the market on average. In many simulations, investing in a basket of firms with low price/book ratios outperformed the market. The book value of a company is the sum that would be distributed to its shareholders if all of its assets were liquidated, and all of its obligations were paid. Because preferred shares have a higher status in a company’s liquidation procedure than regular shares, they are not included in this tally. The book value of a bank may be higher than that of a competitor if it has a bigger volume of financial products. Capital is packaged into financial instruments, which may be bought and sold.
In general, businesses with more tangible assets like property, inventory, and machinery and equipment tend to have a higher book value than service-based businesses like management consultants, stockbrokers, and video game creators. Human capital, the monetary worth of a worker’s abilities, is crucial to the success of these businesses.
What are the Explanations for Market Anomalies?
Market anomalies can be explained through four main causes. They are mispricing, unmeasured risk, constraints to arbitrage, and selection bias. Let us learn more about each of them.
- Selection bias
The inability to secure the correct randomization of a sample from a population leads to a bias known as selection bias. Some subsets of the population may be under-represented in the sample due to problems with the selection procedure causing selection bias. Selection bias could create a distortion when it comes to stock markets.
One of the most common types of selection bias is self-selection. Self-selection happens when the participants of the study exercise control over the decision to participate in the study to a certain extent. Since the participants may decide whether to participate in the research or not, the selected sample does not represent the entire population.
Selection bias is important as it can create a situation where all the information is taken into account in the market. This conflicts with most theories of asset pricing, including EMH.
A common example of selection bias happens in hedge funds. Since failing hedge funds discontinue sending their performance data to index providers, such products have an inherent bias toward successful hedge funds and investment techniques. Oftentimes, this is a problem with well-known mutual fund reporting providers as well.
- Mispricing
Mispricing in stock market is an anomaly where a stock’s price doesn’t match its qualities. The stock can be overpriced or underpriced when mispriced. The liquidity of the market is a key factor that determines whether or not asset prices reflect underlying values. Due to a shortage of capital, assets no longer act in accordance with their underlying value, and the investor is unable to profit from the resulting mispricing. The inability to sell stocks or shares quickly and at a reasonable price is known as illiquidity. investors typically have to pay significant transaction fees when trading stocks, . This results in a disparity between the cash flow of the investment and the money the investor actually gets. The discrepancy has the potential to influence stock market values.
- Limits to arbitrage
Limits to arbitrage refers to situation where prices may stay in a non-equilibrium condition for extended periods of time because rational traders are unable to employ the money that would normally be used by them to arbitrage away pricing inefficiencies. Because of restrictions on arbitrage in the financial markets, companies can only hedge to a certain extent in the real economy. As a result, the parameters that capture time-variation in such bounds have predictive value for asset prices and impact spot prices in the underlying product markets.
The abnormal announcement return on a stock after its addition to the S&P 500 index is a typical example of limits to arbitrage. The inclusion in the index broadens the base of potential buyers of the stock since certain investors (e.g., index funds) are mandated to hold only S&P 500 company stocks. There is no change in the firm’s risk profile, but there is a rise in demand for the shares due to this, which drives up the stock price in the absence of adequate arbitrage capital. Therefore, the index inclusion both lowers the business’s cost of capital and makes it easier for the firm to raise fresh investment capital at a given level of risk.
- Unmeasured risk
Unquantified market risk is the possibility of incurring losses due to unforeseen occurrences. This may include unanticipated changes in the economy, geopolitical events, and other variables that could affect the performance of assets. Since unmeasured risk is not based on past performance, but rather on prospective future events, it can be challenging to evaluate.
When making trading decisions, swing traders must be cognizant of the potential for unmeasured risk in the market. To decrease their risk exposure, they may employ measures such as diversifying their investments, implementing stop-loss orders, and employing risk management tools. By recognizing and controlling unquantified risk, swing traders can safeguard their capital from unanticipated losses.
Why is it important for investors to know about Market Anomaly?
Market anomaly is important for investors to understand because they are patterns that helps investors make decisions in the market. Remember that the stock market and other types of markets exhibit repeated patterns but can’t be predicted with any certainty from day to day. Anomalies in the market tend to happen rather often, which is why they have been picked up on, although they don’t always. Don’t put more money at danger than you can afford to in an attempt to make a profit from them.
How does Market Anomaly affect the Investment Strategy of Investors?
Market anomaly affects investment strategies because the same has to be accounted for when forming investment strategies.
Do these Market Anomalies have a positive impact on the stock market?
No, market anomalies don’t have any positive impact on the stock market. It is because it distorts stock market pricing and goes against known theories investors may use as their base for strategies.
Do these Market Anomalies have a negative impact on the stock market?
Yes, market anomalies distort market pricing. It goes against known theories investors may use as their base for strategies.


 Previous Article


![15 Investing.com Alternatives [Free+Paid] You Should Use in 2026](https://www.strike.money/wp-content/uploads/2026/04/Investing.com-Alternatives.jpg "15 Investing.com Alternatives [Free+Paid] You Should Use in 2026 20")
![15 TradeStation Alternatives [Free+Paid] You Should Use in 2026](https://www.strike.money/wp-content/uploads/2026/04/TradeStation-Alternatives.jpg "15 TradeStation Alternatives [Free+Paid] You Should Use in 2026 21")
![15 Chartink Alternatives [Free+Paid] You Should Use in 2026](https://www.strike.money/wp-content/uploads/2026/04/Chartlink-Alternatives.jpg "15 Chartink Alternatives [Free+Paid] You Should Use in 2026 22")
: Overview, 10 Types of Indicators, Settings for Different Markets 24")

 : Definition, Formula, calculation, Uses, Advantages Vs limitations 26")


: How We Used This 70/30 Indicator in 6 High Win-rate Strategies 30")


No Comments Yet.