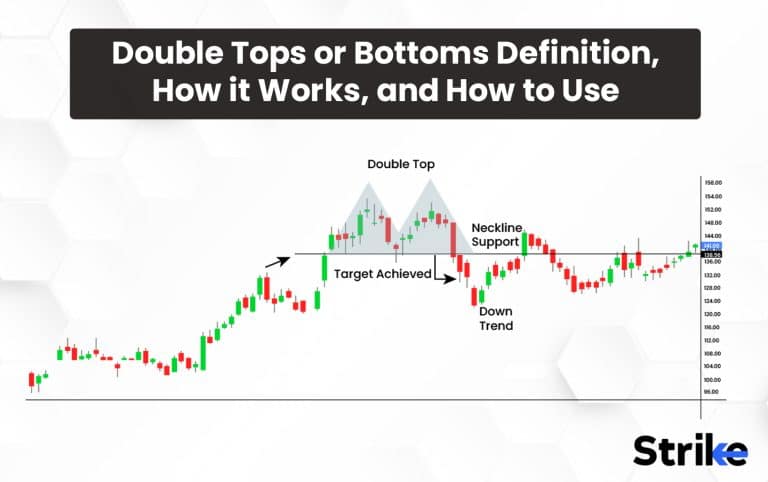
Double Tops or Bottoms are technical analysis tools widely used by traders to identify potential trend reversals. The Double Top pattern has an ‘M’ shaped pattern and it indicates a bearish reversal. A Double Tops pattern occurs when an asset’s price rises to a certain level, then falls back, then rises almost to the same level again before falling once more. This pattern is frequently interpreted as a bearish signal, indicating that the price of the commodity has encountered resistance and is most likely to decline further.
The Double Bottoms pattern is having a ‘W’ shaped pattern and it indicates a bullish reversal. The Double Bottom pattern is opposite of the Double Tops pattern. It occurs when an asset’s price falls to a certain level, then rises, then falls to that same level again before rising once more. This pattern is interpreted as a bullish signal indicating that the price of the asset has reached a support level and is likely to increase.
A trader who notices a Double Top pattern developing decides to clear their investment in the asset, anticipating a further decline in price. A trader on the other hand who notices a double bottom pattern developing decides to purchase the commodity, anticipating a further increase in price.
Double Tops and Bottoms patterns are used by traders with the help of confirmations with the other technical analysis tools since rounding patterns cause false signals. Not all the Double Tops and Bottoms would indicate trend reversals and therefore traders should always use this in combination with fundamental analysis to avoid the risk of losses.
What are Double Tops or Bottoms Patterns?
The Double Top pattern develops following a long-term asset bullish rise. The Double Top aids traders in identifying trade exit marks and signals a bearish reversal. It develops when the bulls lose interest in pushing up the price of the asset, resulting in a bearish reversal. Trading professionals who properly recognise the Double Top Pattern gain insight into the approaching downtrend.
Two side-by-side rounding tops combine to create the double top design. The pattern develops when a security’s price, following a bullish rally, hits a high point, then declines to the support level and rises once more to a higher point, slightly below the previous one. The Double Top pattern signals a trend reversal to the negative and shows that the security is unable to move past a resistance level.
The Double Bottom pattern on the other hand is formed after a prolonged bearish rally of a particular security. The Double Bottom indicates a bullish reversal and helps traders to find entry points in the trade. The Double Bottom is formed when the bears are no longer dominating the market and they are not interested in decreasing the price of the security and thus creating a bullish reversal. The Double Bottom pattern is an indication that an uptrend is going to be observed.
This pattern is completely opposite in terms of its shape when compared with the double-top pattern formed by two side-by-side rounding tops. The pattern is formed when the price of a security after a bearish rally reaches a low point, then rises again to the resistance level and then returns to the previous low point again but fails to break through it. The Double Bottom pattern directly indicates that the asset is struggling to break through a support level and may indicate a trend reversal to the upside.
How does Double Tops or Bottoms work?
Double tops and bottoms are popularly known chart patterns that are used to identify bearish and bullish trend reversals in financial markets. Double tops and bottoms are formed when the price of an asset creates two different peaks or valleys, with a significant price drop or rise in between them.

A double top is a chart pattern that results when the price of a particular security reaches a high point, declines, and then rises again to a similar high point but a little lower this time, and then falls once more. The two high points are typically separated by a price drop of at least 10-20%.
A double bottom on the other hand is a chart pattern that results when the price of a particular security dips to a low point, then rises, dips again to a similar low point but a little higher than the previous low, and then rises once more. The two low points are typically separated by a price rise of at least 10-20%.
The following are four specific characteristics to identify a double top or bottom.
- Peaks or Valleys: The pattern should consist of two peaks in case of a double top or two valleys in case of double bottom that are roughly equal in height or depth.
- Neckline: A neckline is a horizontal line that connects the lows of the two peaks or the highs of the two valleys. Neckline is an important element for determining the entry and exit points in the trade. Neckline acts as a support or resistance level and is an important indicator for the Double Top and Bottom pattern.
- Price Drop or Rise: The two peaks or valleys should be separated by a significant price drop or rise in the price. The change in price should be at least 10-20% so that the upcoming trend reversal can be identified.
- Volume: Volume helps in determining the interest of traders. The volume of trading during the formation of the pattern should always be higher than the normal trades, as it would indicate that there is significant interest from traders.
There are majorly three trading strategies that traders can go through while trading double tops and bottoms. These include:
- Shorting the Asset: Once the price breaks below the neckline after a double top pattern is recognized, traders seek to short the asset. This tactic operates under the presumption that the pattern is changing and that the price will probably keep falling.
- Going Long on the Asset: Once the price breaks above the neckline after a double bottom pattern is found, traders can look to go long on the asset. This tactic operates under the presumption that the trend is changing and that the price will probably increase further.
- Using Stop Losses: Traders can use stop losses to reduce their losses if a trade goes against them in order to control risk. Setting a stop loss order at a predetermined price will cause the asset to be sold immediately if the price drops below that mark.
Double tops and bottoms patterns appear when an asset’s price experiences two distinct peaks or troughs, separated by a sizable price increase or decrease. Double tops and bottoms can be recognised by traders using particular aspects of the design, such as the neckline and volume.
They can then employ a variety of trading techniques, such as shorting or buying an asset or waiting for confirmation, when making trading choices. Stop losses can be used to control risk. Having a solid grasp of double tops and bottoms can help traders spot potential reversals and make wise trading choices.
How to determine the Double Top Pattern?
The double top pattern is formed in a bullish market where the price of a particular security reaches a higher point in the market, then the value declines back to a support level before making a second attempt to reach the same high level but ultimately fails to do so, creating two peaks at roughly the same price level.
- Initial Uptrend: The most basic step required for identifying a double top pattern in the market is to look for a clear uptrend in the price of a particular security. This is performed by analyzing and identifying higher highs and higher lows in the price chart. A distinct uptrend should be created over a considerable amount of time, such as several weeks or months.
- Forming the First Peak: The price of the particular security will reach a high point after the uptrend is identified. which will be the first peak in the double top pattern. The first peak will be followed by another peak but after forming a trough.
- Retracement and Support Level: The retracement in the price will be followed by a period of consolidation, during which the price will trade within a defined range. The support level, which is the level at which the price stops falling and starts to rise again, is the level at which traders should look for a potential second peak.
- Forming the Second Peak: The price will begin to rise once it reaches the support level, and traders should keep an eye out for a possible second peak. The second peak will form, when the price reaches approximately the same level as the first peak showing that buyers are still in charge of the market. It can also indicate that bears are seizing control of the market if the price fails to rise to the level of the first high and begins to fall.
- Trading Strategies: Traders should look for a double bottom pattern, in case of long positions. It is opposite of the double top pattern and occurs when the price reaches a support level twice before rising again, indicating a potential reversal of the downtrend. Traders can use the double top pattern for both long and short positions. Traders can use the double top pattern to find possible entry points for short positions. Investors should watch for a breakout below the support level because this will indicate a possible drop in the asset’s price. Once the breakout happens, traders can take a short position in an effort to profit from the asset’s price decline.
The double top pattern is a widely used and popularly known technical analysis pattern that can help traders identify potential reversal signals in a market trend. Traders can use this pattern to determine possible entry and exit points. Traders can enhance their trading strategies and possibly boost their market profitability by learning how to recognise and trade the double top pattern.
How to determine a Double Bottom Pattern?
The overall appearance of the double bottom pattern is completely opposite of the double top pattern. The double bottom pattern is a reversal pattern that signals a change in the market sentiment from bearish to bullish. The pattern is formed by two consecutive troughs with a moderate price increase between them.
The second trough formed is a little higher than the previous trough. This directly indicates that the bears have lost control of the market and now the bulls are controlling the price and thus an uptrend is observed. The following are three major steps involved for identifying and implementing the principles of Double Bottom Pattern in trading:
- Identifying the Initial Downtrend: The most basic step is to first identify a double bottom pattern to look for a clear downtrend in the price of the particular security. The identification process can be done by analyzing the price action and identifying lower lows and lower highs in the price chart of a particular security. The downtrend should be clearly defined and established over a significant period of time, such as several weeks or months.
- Forming the First Trough: Once the downtrend is identified, the price of the asset will reach a low point, which will be the first trough in the double-bottom pattern. The first trough will be followed by a price increase, which will test a resistance level.
- Price Increase and Resistance Level: The price increase in the asset will be followed by a period of consolidation, during which the price will trade within a defined range. The resistance level, which is the level at which the price stops rising and starts to fall again, is the level at which traders should look for a potential second trough.
- Forming the Second Trough: Once the price reaches the resistance level, it will start to decline again, and traders should watch for a potential second trough. The second trough will be formed when the price reaches roughly the same level as the first trough, indicating that the sellers are still in control of the market. However, it could be a sign that the buyers are taking control of the market if the price fails to reach the level of the first trough and starts to rise,
- Trading Strategies: Traders can use the double bottom pattern for both long and short positions. For long positions, traders should look for a double bottom pattern, which is the opposite of the double top pattern. In this pattern, the price will reach a resistance level twice before starting to decline again, indicating a potential reversal of the uptrend.
For short positions, traders can use the double-top pattern to identify potential entry points. Traders should look for a breakout below the support level, which will signal a potential decline in the price of the asset. Traders can enter a short position once the breakout occurs, looking to profit from the decline in the price of the asset.
In conclusion, the double bottom pattern is a commonly used technical analysis pattern that can help traders identify potential reversal signals in a market trend. Traders can use this pattern to identify potential entry and exit points, depending on the direction of the trend. By understanding how to identify and trade the double bottom pattern, traders can improve their trading strategies and potentially increase their profitability in the market.
How to use Double Tops or Bottoms in Technical Analysis?
Double tops and double bottoms are patterns that occur when the price of an asset reaches a high or low level, then retraces back to a support or resistance level before making a second attempt to reach the same level.
A double-top pattern is formed when the price reaches a resistance level twice before starting to decline again, indicating a potential reversal of an uptrend. A double bottom pattern is formed when the price reaches a support level twice before starting to rise again, indicating a potential reversal of a downtrend.
To identify a double top or double bottom pattern, traders should look for two key characteristics:
- Price Level: The first characteristic of a double top or double bottom pattern is the price level. Traders should look for a significant price level that has acted as either support or resistance in the past. This level will act as a key reference point for the pattern.
- Price Action: The second characteristic of a double top or double bottom pattern is price action. Traders should look for two peaks or two troughs that occur at roughly the same price level, indicating that the price is struggling to break through the support or resistance level
There are several trading strategies that traders can use when they identify double tops and double bottom patterns. Here are a few of them:
- Breakout Trading: One of the most common trading strategies for double tops and double bottoms is to wait for a breakout to occur. Traders can set a buy order above the resistance level in a double-bottom pattern or a sell order below the support level in a double-top pattern. When the breakout occurs, the trader can enter a long or short position, respectively.
- Trading the Retracement: Another trading strategy for double tops and double bottoms is to trade the retracement. Traders can wait for the price to retrace back to the support or resistance level before entering a long or short position, respectively. This strategy can be riskier than breakout trading, as it requires the trader to accurately predict the retracement level.
- Using Indicators: Traders can also use technical indicators to confirm double-top and double-bottom patterns. For example, traders can use the Relative Strength Index (RSI) to confirm a double-top pattern. When the RSI is in overbought territory and starts to decline, it can signal a potential reversal of the uptrend. Similarly, traders can use the Moving Average Convergence Divergence (MACD) to confirm a double-bottom pattern. When the MACD crosses above the signal line, it can signal a potential reversal of the downtrend.
- Volume Analysis: Volume analysis can also provide valuable insights into double-top and double-bottom patterns. When the price reaches a resistance or support level, traders should look for a decrease in volume, indicating that the market is losing momentum. Conversely, when the price breaks out above the resistance level or below the support level, traders should look for an increase in volume, indicating that the market is gaining momentum.
By understanding how to identify and trade these patterns, traders can improve their trading strategies and potentially increase their profitability in the market. It is important to note that these patterns are not foolproof and should be used in conjunction with other technical and fundamental analysis tools to make more informed trading decisions.
How to use Double Tops or Bottoms in Stock Market Trading?
These patterns can be useful for traders to anticipate price movements and make informed trading decisions. In this answer, we will explain how to use Double Tops or Bottoms in stock market trading.
- Identify the Pattern: The first step is to identify a Double Top or Bottom pattern on a price chart. A Double Top pattern occurs when the price hits a resistance level twice and fails to break it, while a Double Bottom pattern occurs when the price hits a support level twice and fails to break it. It is important to look for two peaks or two troughs separated by a trough or peak respectively, with approximately the same height.
- Confirm the Pattern: After identifying the pattern, it is important to confirm it. Traders can use technical indicators such as moving averages, RSI (Relative Strength Index), or MACD (Moving Average Convergence Divergence) to confirm the pattern. The indicators should show signs of divergence, indicating a potential trend reversal.
- Entry Point: Once the pattern is confirmed, traders can look for an entry point. In the case of a Double Top, traders can enter a short position once the price breaks below the support level of the pattern. In the case of a Double Bottom, traders can enter a long position once the price breaks above the resistance level of the pattern.
- Stop Loss: It is important to use a stop loss to limit potential losses. Traders can set a stop loss just above the resistance level for a long position and just below the support level for a short position.
- Take Profit: Traders should also set a target for taking profit. One common method is to set a target based on the height of the pattern. For example, for a Double Top pattern, traders can take profit once the price reaches the distance between the support level and the highest peak of the pattern.
- Risk Management: Traders should also consider risk management strategies to manage their portfolios. One common method is to use a risk-reward ratio of 1:2, meaning the potential profit is twice the potential loss.
In conclusion, Double Tops or Bottoms can be useful in stock market trading to identify potential trend reversals. Traders should identify and confirm the pattern, set entry and exit points, and use risk management strategies to limit potential losses. It is important to consider other factors such as market trends, fundamental analysis, and news events before making trading decisions.
What are the Best Trading Strategies you can use for Double Tops or Bottoms?
These patterns occur when an asset reaches a resistance or support level twice, with two peaks or troughs separated by a trough or peak, respectively. We will discuss some of the best trading strategies that traders can use when trading Double Tops or Bottoms.
Breakout Strategy: One of the most common strategies used by traders is the breakout strategy. In this strategy, traders wait for the price to break below the support level of a Double Top or above the resistance level of a Double Bottom.
This indicates a potential trend reversal and provides an entry signal. Traders can place a stop loss just above the resistance level for a long position and just below the support level for a short position. They can also use technical indicators to confirm the breakout.
Reversal Strategy: Another popular strategy is the reversal strategy. In this strategy, traders wait for the price to complete the pattern and reverse its direction. Once the pattern is confirmed, traders can enter a position in the opposite direction of the previous trend.
For example, traders can enter a short position after the Double Top pattern is confirmed if the previous trend was bullish. Traders can place a stop loss just above the resistance level for a long position and just below the support level for a short position.
Divergence Strategy: Traders can also use the divergence strategy to trade Double Tops or Bottoms. This strategy involves looking for divergences between the price and technical indicators such as the RSI or MACD. If the price is making higher highs or lower lows, but the indicator is making lower highs or higher lows, it indicates a potential trend reversal. Traders can enter a position based on this divergence and place a stop loss just above the resistance level for a long position and just below the support level for a short position.
Fibonacci Retracement Strategy: Traders can also use Fibonacci retracement levels to trade Double Tops or Bottoms. In this strategy, traders look for the retracement levels of the previous trend and enter a position when the price reaches one of these levels. For example, traders can look for a retracement level and enter a long position when the price reaches this level if the previous trend was bullish. Traders can place a stop loss just below the retracement level for a long position and just above the retracement level for a short position.
Volume Strategy: Traders can use volume to confirm a Double Top or Bottom pattern. High volume during the formation of the pattern indicates that traders are actively participating in the market and the pattern is more likely to be valid. Traders can also use volume to confirm a breakout or reversal signal. If the volume increases when the price breaks out of the pattern or reverses its direction, it provides a strong confirmation signal.
Price Target Strategy: Traders can use the height of the pattern to determine a price target. The price target is calculated by measuring the distance between the support level and the highest peak of the Double Top or the resistance level and the lowest trough of the Double Bottom, and then adding it to the breakout level for a bullish pattern or subtracting it from the breakout level for a bearish pattern. For example, the price target for a bullish pattern is $60 and for a bearish pattern is $40 if the height of the pattern is $10 and the breakout level is $50.
Moving Averages Strategy: Traders can use moving averages to confirm a Double Top or Bottom pattern. It indicates a bearish trend If the price is below a long-term moving average, such as the 200-day moving average, and traders can look for Double Tops as a potential entry signal for a short position. If the price is above a long-term moving average, it indicates a bullish trend, and traders can look for Double Bottoms as a potential entry signal for a long position.
Multiple Time Frame Strategy: Traders can also use multiple time frames to trade Double Tops or Bottoms. In this strategy, traders analyze the pattern on different time frames, such as a daily, weekly, and monthly chart, to identify the trend and confirm the pattern.
It provides a stronger confirmation signal If the pattern is valid on all time frames, traders can use different strategies when trading Double Tops or Bottoms, such as the volume strategy, price target strategy, moving averages strategy, time frame strategy, and multiple time frame strategy. It is important to confirm the pattern and use risk management strategies, such as setting stop losses and take profits, to limit potential losses
What are the advantages of using Double Tops or Bottoms in Trading?
There are five main advantages of using double tops and bottoms in trading. Read on to find more.
Provides clear entry and exit signals: Double Tops and Bottoms provide clear entry and exit signals for traders. Traders can enter a trade when the price breaks below the support level for a Double Top or above the resistance level for a Double Bottom. They can exit the trade when the price reaches the price target or when the pattern is invalidated.
Provides risk management opportunities: Traders can use Double Tops and Bottoms to set stop-loss orders and limit potential losses. Stop-loss orders can be placed below the support level for a Double Top or above the resistance level for a Double Bottom.
Provides price targets: Double Tops and Bottoms provide price targets that traders can use to take profit or exit the trade. The price target is calculated by measuring the height of the pattern and adding it to the breakout level for a bullish pattern or subtracting it from the breakout level for a bearish pattern.
Provides confirmation signals: Traders can use different technical indicators, such as moving averages and volume, to confirm the validity of the Double Top or Bottom pattern. Confirmation signals increase the probability of success and reduce the risk of false signals.
Provides trend reversal signals: Double Tops and Bottoms can indicate a trend reversal in the market. Traders can use these patterns to identify potential trend reversals and profit from them
Double Tops and Bottoms provide several advantages to traders, such as clear entry and exit signals, risk management opportunities, price targets, confirmation signals, and trend reversal signals. However, it is important to consider other factors, such as market trends, fundamental analysis, and news events, before making trading decisions.
What are the disadvantages of using Double Tops or Bottoms in Trading?
While Double Tops and Bottoms have many advantages, there are also some disadvantages to using them in trading. Here are some potential drawbacks:
False Signals: One of the main disadvantages of Double Tops or Bottoms is that they can produce false signals. Sometimes the price can break below or above the support or resistance level, but then reverse back quickly, resulting in a false signal. This can lead to losses for traders who enter trades based on these false signals.
Subjectivity: The identification of Double Tops and Bottoms is subjective, and different traders may see different patterns. This can lead to different interpretations of the pattern and different trading decisions, which can result in losses.
Time-consuming: Identifying Double Tops and Bottoms can be time-consuming, and traders may miss other trading opportunities while waiting for these patterns to form.
Dependence on Technical Analysis: Double Tops and Bottoms rely heavily on technical analysis, which may not always provide a complete picture of the market. Market trends, news events, and other factors can also affect the price, and traders need to consider these factors before making trading decisions.
Limited to Certain Markets: Double Tops and Bottoms may work better in some markets, such as stocks or forex, than in others, such as cryptocurrencies or commodities. This can limit their effectiveness in certain trading environments.
While Double Tops and Bottoms have many advantages, traders should also be aware of their potential disadvantages, such as false signals, subjectivity, time-consuming nature, dependence on technical analysis, and limited effectiveness in certain markets.
What is an example of Double Tops or Bottoms in Trading?
An example of Double Tops in trading can be seen in the chart of Apple Inc. (AAPL) stock in the first quarter of 2021.
In early January 2021, AAPL reached a peak of $145.09 and then retraced to a support level at around $128.77. The stock then rallied back up to $145.09, forming the first top of the Double Top pattern. However, the price failed to break above the first top, indicating a potential reversal. The stock then retracted back to the support level of $128.77 before rallying again to test the first top. This second peak formed the second top of the Double Top pattern.
The pattern was confirmed when the price broke below the support level at $128.77, which acted as the neckline of the pattern. This breakout signaled a bearish trend reversal, and traders who had entered short positions at the breakout level could have made a profit as the stock continued to decline.
An example of Double Bottoms can be seen in the chart of Bank of America Corporation (BAC) stock in late 2020.
In November 2020, BAC reached a low of $23.95 and then bounced to a resistance level at around $28.50. The stock then retracted back down to $23.95, forming the first bottom of the Double Bottom pattern. However, the price did not break below the first bottom, indicating a potential reversal. The stock then rallied back up to the resistance level of $28.50 before retracing again to test the first bottom. This second dip formed the second bottom of the Double Bottom pattern.
The pattern was confirmed when the price broke above the resistance level at $28.50, which acted as the neckline of the pattern. This breakout signaled a bullish trend reversal, and traders who had entered long positions at the breakout level could have made a profit as the stock continued to rise.
Double Tops and Bottoms are common patterns in trading that can provide traders with valuable signals for entry, exit, and risk management. By identifying these patterns and confirming them with other technical indicators, traders can increase their probability of success and reduce their risk of losses.
What does the W stock pattern mean?
The W pattern, also known as the “Double Bottom,” is a technical chart pattern that indicates a potential bullish trend reversal in trading. The pattern is formed when the price of an asset falls to a low, then bounces back up, falls again to the same or similar low, and then bounces up again to break through the resistance level created by the two lows. The resulting chart pattern resembles the letter “W,” hence its name.

The first bottom of the W pattern usually represents the price low of the downtrend. The price then bounces back up, but fails to break through the resistance level created by the previous high. The price then falls again, creating the second bottom of the pattern, which is often slightly higher than the first bottom. Finally, the price rallies again and breaks through the resistance level, signaling a potential trend reversal and the start of a new uptrend.
The W pattern is typically confirmed by an increase in trading volume during the second bottom and a decrease in volume during the subsequent rally. Traders often use other technical indicators, such as moving averages or oscillators, to confirm the pattern and identify potential entry and exit points.
One of the advantages of using the W pattern in trading is that it provides traders with a clear signal of a potential bullish trend reversal. Traders can use this pattern to enter long positions at the breakout level, with a stop-loss order placed below the second bottom. This can help traders manage risk and maximize profits.
What does the M stock pattern mean?
The M pattern, also known as the “Double Top,” is a technical chart pattern that indicates a potential bearish trend reversal in trading. The pattern is formed when the price of an asset rises to a high, then retraces, rises again to the same or similar high, and then retraces again to break through the support level created by the two highs. The resulting chart pattern resembles the letter “M,” hence its name.

The first top of the M pattern usually represents the price high of the uptrend. The price then retraces, but fails to break through the support level created by the previous low. The price then rises again, creating the second top of the pattern, which is often slightly lower than the first top. Finally, the price retraces again and breaks through the support level, signaling a potential trend reversal and the start of a new downtrend.
The M pattern is typically confirmed by an increase in trading volume during the second top and a decrease in volume during the subsequent decline. Traders often use other technical indicators, such as moving averages or oscillators, to confirm the pattern and identify potential entry and exit points.
One of the advantages of using the M pattern in trading is that it provides traders with a clear signal of a potential bearish trend reversal. Traders can use this pattern to enter short positions at the breakout level, with a stop-loss order placed above the second top. This can help traders manage risk and maximize profits.
The M pattern, also known as the Double Top, is a technical chart pattern that indicates a potential bearish trend reversal in trading. By identifying this pattern and confirming it with other technical indicators, traders can increase their probability of success and reduce their risk of losses.
Are Double Top bearish or bullish?
Yes, double Top is a technical chart pattern commonly found in financial markets, such as stocks, forex, and commodities. It is considered a bearish reversal pattern, which means it indicates that the price of an asset is likely to decline after a period of bullishness.
A Double Top pattern occurs when an asset’s price rises to a certain level, then pulls back, rises again to the same level, and then drops again. The two peaks should be approximately the same height and separated by a trough. This pattern forms when the buyers are unable to push the price higher beyond the resistance level, and the sellers take control, resulting in a reversal of the trend.
To understand the bearishness of a Double Top pattern, consider the psychology of the market participants. During the first peak, buyers push the price higher, creating a bullish trend. As the price approaches the resistance level, some traders take profits, and some wait to see if the price will break above the resistance level. Traders who were waiting to buy may sell their positions, fearing a reversal If the price fails to break above the resistance level, tr This selling pressure causes the price to drop and form a trough.
As the price begins to rise again, buyers who missed the first peak may enter the market, hoping to make a profit. However, the sellers who took control in the previous peak are still present, and when the price reaches the same resistance level, they start selling again, causing the price to drop once more. This selling pressure creates a second peak, forming the Double Top pattern.
The Double Top pattern indicates that the buyers are losing momentum, and the sellers are taking control. The failure to break above the resistance level twice is a sign of weakness, and the price is likely to continue to fall. Traders who recognize this pattern sell their positions or enter short trades, anticipating a bearish trend.
Double Top is a bearish reversal pattern that indicates a possible trend reversal from bullish to bearish. It signals weakness in the buying momentum and the emergence of selling pressure, indicating a likely drop in the asset’s price. However, like all technical patterns, it is not a guaranteed prediction of market direction, and traders should consider other factors before making trading decisions.
Are Double Bottom bearish or bullish?
A Double Bottom is a chart pattern that indicates a potential bullish reversal in a downtrend. The pattern is formed when the price of an asset reaches a low point, bounces back up, and then returns to the same low point or a slightly higher low point before bouncing again; this indicates that the market bears are losing control of the market. This forms two troughs at approximately the same level, creating a “W” shape.
A Double Bottom suggests that there is strong support at that level, when the price of an asset reaches the same low point twice. Buyers can observe that the asset is undervalued with the help of the Double Bottom chart pattern and begin to enter the market, driving the price up. The Double Bottom pattern helps traders to find the entry point in the trade. The pattern will indicate a bullish reversal if the price is able to break through the resistance level formed by the peak between the two troughs.
It’s worth noting that the Double Bottom pattern is not a guaranteed indication of a bullish reversal, just like any other chart pattern it also can give false signals. It is also possible for the price to fall below the second low point, which would invalidate the pattern. The market price is governed by multiple factors like market conditions, news events, economic indicators etc, all these events can influence the price of an asset.


 Previous Article


![15 Investing.com Alternatives [Free+Paid] You Should Use in 2026](https://www.strike.money/wp-content/uploads/2026/04/Investing.com-Alternatives.jpg "15 Investing.com Alternatives [Free+Paid] You Should Use in 2026 40")
![15 TradeStation Alternatives [Free+Paid] You Should Use in 2026](https://www.strike.money/wp-content/uploads/2026/04/TradeStation-Alternatives.jpg "15 TradeStation Alternatives [Free+Paid] You Should Use in 2026 41")
![15 Chartink Alternatives [Free+Paid] You Should Use in 2026](https://www.strike.money/wp-content/uploads/2026/04/Chartlink-Alternatives.jpg "15 Chartink Alternatives [Free+Paid] You Should Use in 2026 42")
: Overview, 10 Types of Indicators, Settings for Different Markets 44")

 : Definition, Formula, calculation, Uses, Advantages Vs limitations 46")


No Comments Yet.