Divergence in Trading: Definition, Types, Importance, Trading Example, Limitations
By  Arjun Remesh |
Reviewed by
Arjun Remesh |
Reviewed by  Shivam Gaba |
Updated on March 26, 2024
Shivam Gaba |
Updated on March 26, 2024
Table of content show
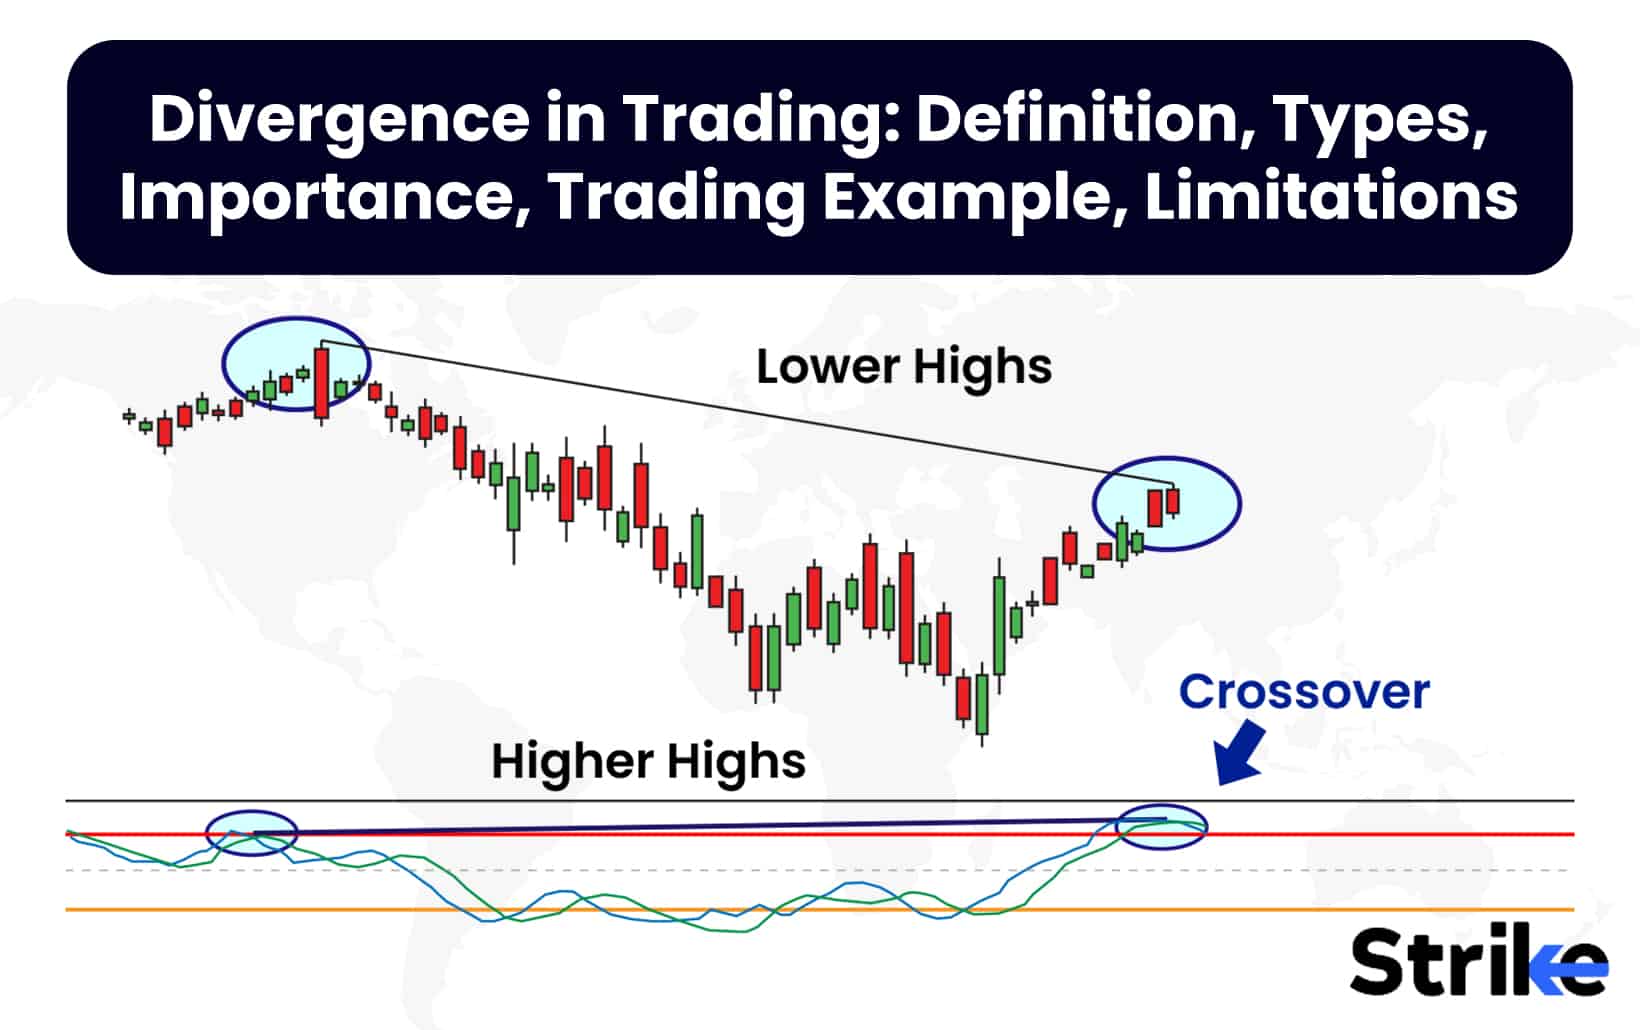
Divergence in trading is a break between the price action of a security and an oscillator. Divergence in trading refers to scenarios where the price of an asset and its momentum as measured by an indicator such as RSI or MACD do not confirm each other’s direction. There are two main types of divergences seen in trading – hidden and reverse divergences. Understanding divergence is important for traders as it helps identify periods where the existing trend could potentially reverse.
One of the main advantages of divergence is that it can signal trend reversals before they occur on the price chart. However, one limitation is that divergence signals are not always effective and at times price action may not confirm the signal, leading to false signals. The three common types of divergences seen in trading are hidden divergence, reverse divergence and bearish divergence.
Divergences are observed on all sorts of time frames but they are more effective if they are spotted on higher time frames. Higher time frame divergences if found has potential to provide high quality trades with greater win ratios than divergences noticed on lower time frames.
Hidden divergence occurs when the indicator makes a new high but the price chart fails to surpass the earlier high.
Reverse divergence happens when the indicator prints a new low along with rising prices.
Bearish divergence is formed when the price makes a higher high but the indicator prints a lower high, signaling weakness. It is important for traders to understand these divergences well to better time their entry and exit from trades.
What is divergence in technical analysis?
Divergence refers to a situation where the price of an asset is moving in the opposite direction of a technical indicator, such as an oscillator. Divergence occurs when the price of a stock makes new highs or lows that are not confirmed by the indicator. Divergence warns that the current price trend is weakening, and in some cases leads to the price changing direction. Traditional divergence occurs when prices are making new highs while an oscillator is failing to exceed its previous highs.
This divergence between price and oscillator often foreshadows a turning point. Identifying divergence on a chart helps technical analysts spot potential reversals and trading opportunities. An example of divergence is showcased in the image below. An appropriate bullish divergence is observed on Daily Time Frame. It gave short trade and a proper bullish trade after some significant time period.

What does divergence indicate?
Divergence indicates a discrepancy between price action and an oscillator or other indicator. Divergence shows that momentum is slowing and that a trend is nearing exhaustion. The divergence suggests that demand and supply are shifting, which could lead to a trend reversal. Identifying divergences help traders spot turning points and potential opportunities to enter counter-trend trades. Divergence in technical analysis signals a major positive or negative price move. A positive divergence occurs when the price of an asset makes a new low while an indicator, such as money flow, starts to climb. Conversely, a negative divergence is when the price makes a new high but the indicator being analyzed makes a lower high.
Divergences are extremely useful for conservative traders who search for additional confirmations and confluences that solidify a trading setup. Divergences produce high quality trades if they are spotted on higher time frames. By finding proper entries on lower time frames, high risk to reward setups can be achieved on lower time frames respectively.
How many types of divergence are there?
There are mainly 4 types of divergences Bullish divergence, Bearish divergence, Hidden divergence & False divergence.
Bullish divergence happens when price makes lower lows but momentum indicators make higher lows, signaling an uptrend is ahead.
Bearish divergence is the opposite, with price making higher highs but momentum making lower highs, signaling a potential downtrend.
Hidden divergence is similar but uses intra-period instead of closing prices.
Hidden divergences are further of two subtypes – Bullish Hidden Divergence & Bearish Hidden Divergence.
False divergence appears to be bullish or bearish but then quickly reverses.
1. Bullish Divergence
A bullish divergence is when share prices create lower lows on the chart but indicator (Momentum indicators) form higher lows. This scenario, if occurs, suggests the bear’s power is weakening and the bulls are gaining strength. This scenario occurs because the low quality sellers enter markets and high quality or top traders/institutes start buying heavily producing the divergence on indicator forming higher lows. Eventually, the strength of bulls takes control and that concludes the bearishness.

The chart uploaded above shows a bullish divergence pattern forming between the price and the MACD indicator. The divergence observed indicates how the demand in the price of a script is not justifying the momentum indicator not following up. Such a bullish divergence suggests that the prevailing downward movement in price may be temporary and the asset could be poised to change direction to the upside
This disparity eventually settles, fulfilling the demand driving prices further. The pattern fails as well but on higher time frames, the probability of it working is higher.
2. Bearish Divergence
A bearish divergence is observed when the price of the script forms successive higher highs indicating weak players buying the price and the momentum indicator fails to follow up with the price and eventually creates lower highs. This disparity is eventually taken over by supply and the trend reverses on the sell side.

In the chart uploaded above, one can observe how the price continued to create higher highs. These higher highs are created by weak buyers leaving their stop losses below the higher lows on the chart. The big players are going contradictory to the weak buyers creating short positions that are reflected on the indicator forming lower highs. This disparity is eventually fulfilled by the greater supply force triggering a trend reversal towards downside. Observe how a quality trade is spotted by noticing a classic double top, bearish divergence, appropriate bearish candlestick pattern and RSI level sliding below 50 suggesting an increased strength of bears.
3. Hidden Divergence
Hidden divergences are created when the price of asset shows contradictory behavior against the momentum indicator (in this case MACD’s Histograms). These hidden divergences expose silent momentum shifts that are taking an advancing step towards a proper trend reversal.
The chart uploaded below shows how the ordinary behavior between price and MACD histogram looks like. One can observe how the higher high’s on price is reflecting similar occurrence on histograms. The divergence in this example occurred between price and MACD lines.


This chart uploaded above uncovers how the hidden divergence is spotted between price of an asset and the MACD histogram. The price formed a double top or a minor higher high’s while the MACD histogram slipped below the 0 level from positive to negative territory suggesting impeding possibilities of trend reversal towards downside. The divergence signals that upward movement may be losing strength despite the asset hitting fresh highs. The declining highs on the indicator compared to advancing highs on price implies underlying bearish pressure could be incrementally increasing.
Traders observe such scenarios and plan trades carefully taking into consideration appropriate risk management.
Hidden Bullish Divergence
Hidden bullish divergence occurs during the corrective phase of an established uptrend. An established uptrend is defined as a movement of price with relevant and clean two Higher Highs and Higher Lows. During the correction, if price forms a higher low but the indicator on the contrary forms lower lows, this gives rise to hidden divergence which is eventually considered a bullish signal. Chart uploaded below is an example of how a hidden bullish divergence looks like.

In the chart uploaded above, it is advised to observe how multiple confluences are gathered to postulate a suitable trading plan. It started with noticing an established bullish trend, secondly, a proper hidden bullish divergence during the exhaustion phase is observed. With time, a proper bullish candlestick pattern is noticed. RSI also suggested a bounce from the oversold region suggesting a potential shift of momentum from downtrend to uptrend. This is how multiple confluences solidify a trade, as in this case, a bullish trade is identified. Later on, the hidden bullish divergence was noticed yet again, this time, RSI crossing 50 level from -ve territory to +ve is taken as a strong bullish signal.
Hidden Bearish Divergence
Hidden bearish divergence occurs during the corrective phase of an established bearish trend. An established bearish trend is defined as a movement of price with relevant at least two lower lows and lower highs. During the correction, if price forms a lower high but the indicator on the contrary forms higher highs, this gives rise to hidden divergence that is eventually considered as a bearish signal. Chart uploaded below uncovers an example of hidden bearish divergence.

How a bearish trade can be taken by observing hidden bearish divergence is showcased in the trade example uploaded above. A trading plan first starts by identification of an established bearish trend with clean LL’s and LH’s as shown in the chart above. Secondly, a clean hidden divergence is observed, MACD indicator managed to produce higher highs whereas the price of the stock failed to produce HH and instead created Lower high suggesting potential trend reversal to downside. A proper bearish candlestick pattern is observed around the top. This acts as a confirmatory signal.
4. False Divergence
A false divergence is formed when the price of the security and indicators seem to diverge but it fails to the divergence and does not reverse as expected and anticipated. The trend does not really shift as suggested by the divergence and instead, sharply the trend is continued trapping the traders who shorted or went long based on indications put forward by the divergences.
So the false divergence mimics the classic divergence but does not dictate what it is supposed to and instead fails entirely.
How to spot divergence?
Technical indicators like the Relative Strength Index, Moving Average Convergence Divergence, Stochastic Oscillator, and Awesome Oscillator identify divergence by showing the price moving in an opposite direction from the indicator, signaling potential trend changes and reversal points.
1. Spot divergence using RSI
Positive divergence forms when price makes a lower low while RSI forms a higher low. This indicates rising bullish momentum and signals that the downtrend is weakening. Negative divergence occurs when price makes a higher high while RSI forms a lower high. This shows waning upside momentum and suggests the uptrend could be losing strength.
Divergence signals a potential trend reversal, so traders watch for separation between price and RSI to anticipate turning points. RSI divergence does not guarantee a turnaround but provides an early warning sign when used along with other indicators. Detecting divergence with RSI helps traders prepare for a possible shift in the existing trend in a stock. An example is attached below.
2. Spot divergence using MACD
Positive MACD divergence happens when the price of a stock makes a lower low while MACD forms a higher low. This divergence between price and indicator suggests downside momentum is weakening and foreshadows a bullish reversal. Negative divergence occurs when the price registers a higher high but MACD prints a lower high. This bearish divergence signals that upside momentum is faltering and indicates a potential peak in the uptrend.
MACD divergence clues traders into a possible trend change ahead of the price reversal. The divergence occurred between the price and MACD histogram as well. Popularly, hidden divergences are spotted between price and Histogram of the MACD. However, divergence alone is not an outright signal, rather an early warning of trend exhaustion to watch for. Analyzing the relationship between price and MACD tip off traders to an impending shift in the stock’s trend. An example is attached below.
3. Spot divergence using Stochastic Oscillator
Positive divergence forms when the price of a stock makes a lower low while Stochastic produces a higher low. This suggests downside momentum is waning and could foreshadow a bullish reversal. Negative divergence transpires when the price registers a higher high but Stochastic prints a lower high. This indicates fading upside momentum and hints that an uptrend nearing exhaustion. Divergence between Stochastic and price action tips off traders to a potential trend change ahead. However, divergence alone is not an outright signal, rather an early alert of trend weakness to watch for. Comparing price action to the Stochastic Oscillator provides an early warning of an impending trend shift in a stock.

4. Spot divergence using Awesome Oscillator
Positive divergence occurs when the price of a stock makes a lower low while the Awesome Oscillator forms a higher low. This suggests downside momentum is waning and could signal an upcoming bullish reversal. Negative divergence materializes when the price prints a higher high but the Awesome Oscillator produces a lower high.
This indicates fading upside momentum and hints that an uptrend is approaching exhaustion. Divergence between the Awesome Oscillator and price action alerts traders to a potential trend change in the making. However, divergence alone is not an outright signal, rather an early warning of trend weakness to watch for. Comparing price action to the Awesome Oscillator provides advance notice of an impending trend shift in a stock. An example of bullish divergence between price and awesome osciallator is attached below.

Accordingly, savvy traders utilise oscillators to ascertain divergence, presaging impending trend shifts through momentum analysis.
Why is understanding divergence important?
Understanding divergence is important as it provides critical insights for trade entries, exits. Divergences are infrequent to occur and if they are spotted, they can provide opportunity to identify a high probability trade setup. Different confluences are further collected to strengthen a trading plan. It serves as confirmation, identifies reversals, and helps avoid false signals. Mastering divergence analysis strengthens overall trading skills.
- Early warning signals
Divergence provides early warning signals of potential changes in stock trends. Divergence reveals when price and indicator momentum are moving in opposite directions. This divergence signals an upcoming shift in market sentiment before a new trend emerges. By spotting divergence early, traders anticipate and prepare for trend reversions in stocks. Analyzing divergence gives traders an edge by detecting subtle changes in market momentum before major price trend shifts occur.
- Confirmation of Trends
Divergence also validates emerging trends in stock prices. It gives traders added confidence in the direction of the market, when divergence confirms the current price trend. Divergence reinforces the momentum behind a trend, signaling that it is likely to continue. By confirming trends, divergence helps traders avoid premature exits and stick with winning positions longer. Analyzing divergence provides objective evidence that the prevailing trend has underlying strength and validity.
- Identifying Reversal Points
Divergence pinpoints potential reversal points in stock trends. Divergence at key support and resistance levels alerts traders to an impending shift in price direction. By identifying when divergence occurs near turning points, traders prepare to exit existing trades. Analyzing divergence reveals when bullish or bearish momentum is losing steam despite price continuing to trend. Spotting divergence allows traders to anticipate and capitalize on trend reversals at critical junctures in the market.
- Avoiding false signals
Divergence also helps traders avoid acting on false signals. Properly interpreting divergence reduces whipsaws by filtering out misleading indicator readings. Knowing how to validate divergence with other technical analysis tools decreases bad trades. Learning the principles behind divergence assists traders in distinguishing real signals from fake ones. Analyzing divergence properly minimizes unnecessary market noise and false positives.
By analyzing divergence between price and indicator momentum, traders detect subtle shifts in market sentiment before new trends emerge. Spotting divergence gives traders an edge to prepare for trend reversions, stick with valid trends longer, and capitalize on upcoming turning points.
How to trade divergence?
Take a look at the below chart to understand how to trade divergence.

The chart uploaded above displays how a bearish divergence is spotted between price and MACD indicator. A trader is supposed to identify such divergences and look for extra confirmations for validating a trade setup. As in this case, a short trade is initiated by observing a proper bearish engulfing candlestick pattern and a bearish crossover on MACD lines indicating a trend reversal towards downside. This way, multiple confirmations are gathered to take a solid trade setup.
Additional technical tools may provide increased confidence when corroborating signals. Backtesting divergence strategies is recommended to assess real-world performance over time.
What are the common mistakes to avoid while trading divergence?
The common mistakes to avoid while trading in divergence are ignoring confirmations, overlooking the larger trend, isolating divergence, and not waiting for validation. Mistakes using divergence leads to failed trades.
- Ignoring Confirmation Signals
It’s important not to act on a divergence signal alone, without confirming it through other technical analysis methods. Look for confirming signals like breakouts, moving average crosses, or chart patterns to validate the divergence before entering a trade. Acting on divergence in isolation leads to premature entries and stop outs. Use complementary methods like multi-time frame analysis, price action and indicators like RSI, MACD, or stochastics to confirm the momentum shift suggested by the divergence. Entering a trade on divergence alone leaves you prone to false signals, so wait for confirmation from additional indicators before pulling the trigger.
- Overlooking the Overall Trend
It’s critical to consider the prevailing trend on larger time frames, when trading divergences . A bullish divergence forms in a strong downtrend, signaling only a corrective bounce rather than a trend reversal. Similarly, a bearish divergence during an uptrend marks only a pullback before prices resume climbing. Always zoom out to higher time frames and assess the overall trend context before trading a divergence on smaller time frames. Going against the dominant trend is risky even with a divergence signal.
- Using Divergence in Isolation
Divergence by itself is not a complete trading system – it should be combined with other technical analysis tools. Using divergence signals in isolation leads to whipsaws and false signals. However, divergence turns into a potent confirmation tool when combined with momentum oscillators, trend lines, chart patterns, and moving averages. Consider the whole technical picture, watch for indications of confirmation, and combine divergence with additional indicators. Divergence alone is not enough for high-probability setups.
- Not Waiting for Confirmation
One of the biggest mistakes is acting prematurely on a divergence signal before waiting for confirmation. This often leads to premature entries, false signals, and being stopped out of trades. Before trading a bullish or bearish divergence, wait for confirmation from a break of trend lines, moving average crosses, or classic chart patterns. Do not enter on divergence alone – be patient and wait for secondary indicators to confirm the signal before pulling the trigger. Acting too quickly leads to trading errors.
Avoiding mistakes like acting on unconfirmed signals, ignoring the trend, and isolating divergence is key. Apply divergence cautiously, wait for validation, and combine it with other indicators for high-probability setups.
How do you confirm divergence?
Divergence is confirmed by looking for confirmation signals that support the initial divergence pattern observed on the chart. Confirmation signals include in depth price action and multi-time frame analysis, candlestick reversal patterns in the direction of the divergence, like a doji or hammer candle indicating a reversal after bearish divergence. Trendlines and support/resistance levels that align with the divergence signal also help confirm divergence, like a break of support reflecting bearish divergence.
Volume levels decreasing as the price continues higher supports bearish divergence, confirming that buying power is waning. Technical analysis can help identify reversal patterns that support the divergence signal (e.g., double tops or double bottoms). MACD histogram bars decreasing while the price is making higher highs also confirms bearish divergence. Use trendlines, support/resistance levels, or candlestick patterns in the direction of the prevailing trend to confirm the hidden divergence. Multiple technical indicators reflecting divergence in their oscillations, like RSI and MACD, provide stronger confirmation signals through technical analysis.
What is the success rate of divergence?
Calculating success rate is practically difficult but theoretically, it is observed that Divergence trading has a 74% success rate when using the MACD indicator over a six-month period, as the longer time frame allows divergences to fully play out.
To improve the odds, traders should combine MACD with other indicators like RSI to look for confirmation, and focus on daily or weekly charts rather than very short time frames under 30 minutes. The type of divergence also impacts success rate, with regular divergence tending to perform better than hidden divergence with a gap between 65-75%.
Divergence trading takes patience and combining indicators to achieve consistent success, with ideal holding periods between 1-6 months and aim for at least 60% success rate. Traders should backtest strategies, use proper risk management and avoid overtrading divergences to benefit from this pattern.
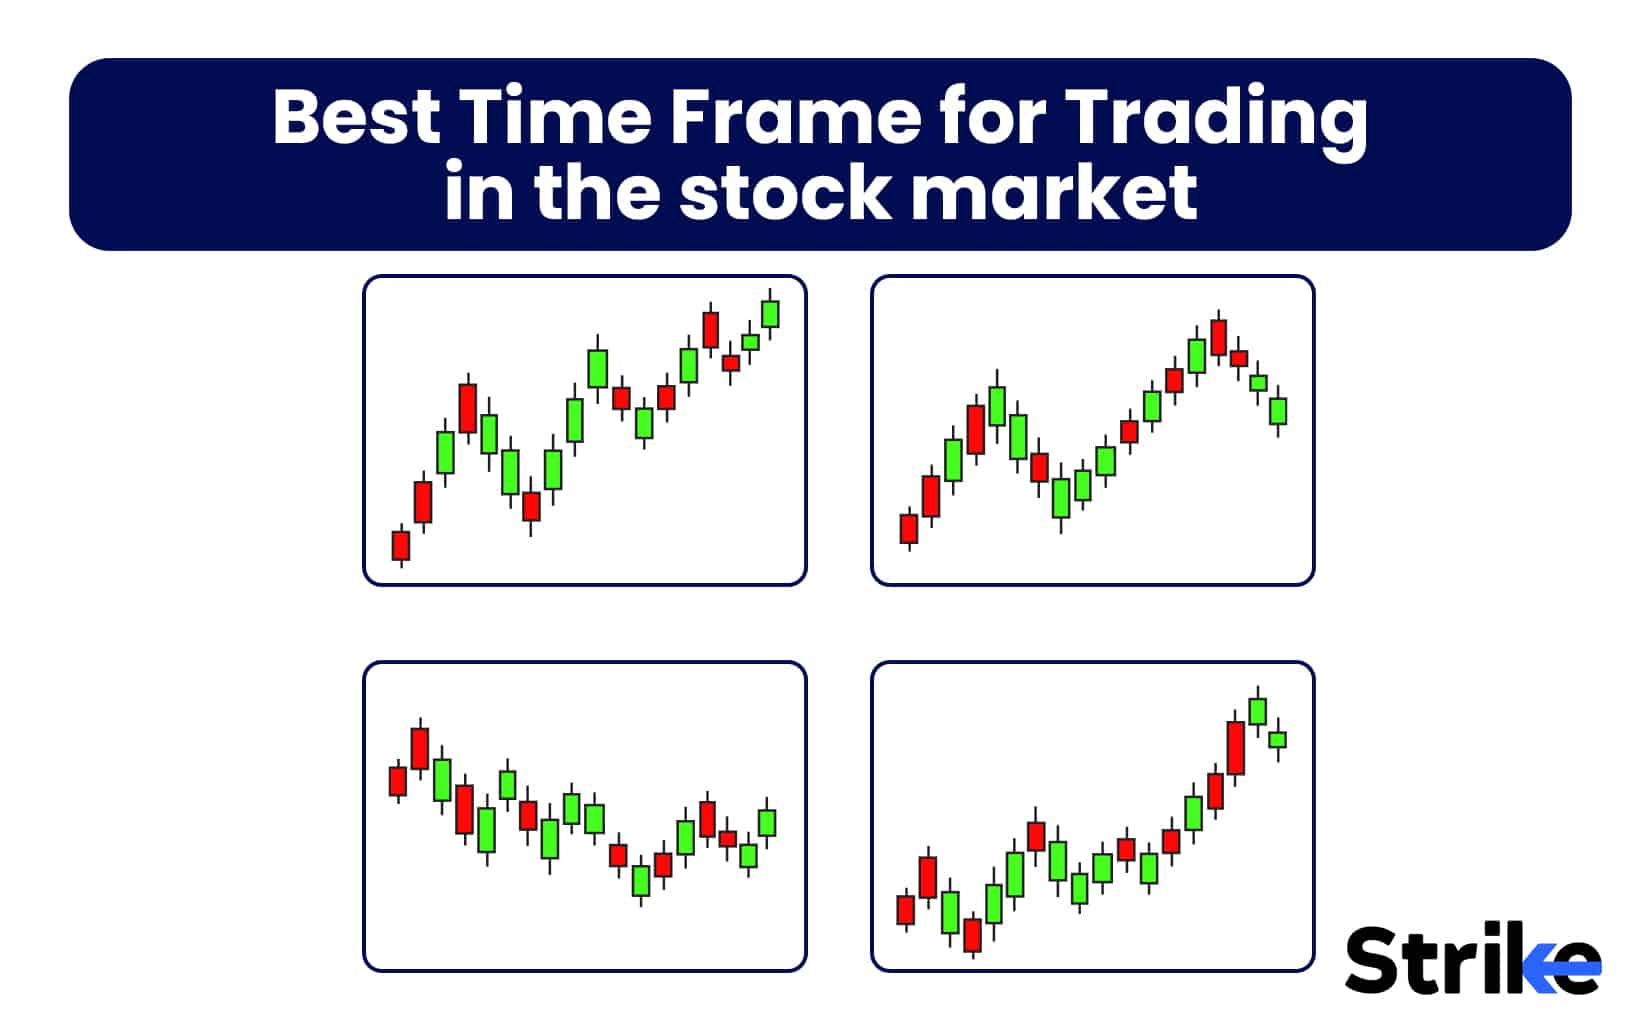
What timeframe is best for divergence?
The best timeframe for trading divergences depends on your trading style, but the most reliable signals form on daily and weekly charts. Divergences on shorter time frames like 15-minutes or 1-hour will occur more frequently but have lower accuracy and success rate. Traders using fast strategies look for divergences on 15-minute charts, but most will find 1-hour charts provide the best mix of actionable signals versus noise. For swing trades or investments, daily and weekly charts are ideal for spotting high-probability divergence setups.
The longer the time frame, the more powerful the divergence tends to be, as it takes time for momentum to shift noticeably. Experienced traders only look for divergence on daily and weekly charts and find proper entries and confirmations on lower time frames, as shorter timeframes have too much noise and whipsaws. In general, focus on timeframes of Daily or longer when scanning for divergence setups, and always use other indicators to confirm signals.
What are the limitations of divergence?
The limitations of divergence are that it produces false signals, especially in volatile markets when the divergence is just temporary.
If divergences are observed on lower time frames, they are prone to producing misleading signals.
Divergence also does not precede every price reversal, as it reflects a discrepancy between price and momentum but not all reversals are momentum-driven.
Additionally, divergence is not foolproof, so it should not be used as the sole indicator for trades but rather to complement other signals. Interpreting divergence requires subjective pattern recognition, so traders draw different conclusions from the same chart data.
Divergence works best for confirming trend reversals, not predicting new trend starts or calling tops and bottoms precisely. Since divergence signals take a long time to develop and play out, it lacks effectiveness for very short-term trading.
Divergence trading strategies should be backtested and optimized, as success rate varies greatly based on parameters like timeframes and indicator settings.
Is divergence bullish or bearish?
Divergences observed between price and indicator can produce bullish and bearish signals.
Bullish divergence is observed when the price of the scripts form Lower Lows while the indicator creates Higher Lows.
Bearish divergence is observed when the price of the scripts form Higher Highs while the indicator creates Lower Highs.
Bullish hidden divergence is observed when the price creates higher lows and during the exhaustion phase of the uptrend, the indicator forms lower lows. This suggests a bullish continuation setup.
Bearish hidden divergence is observed when the price creates Lower High’s and during the exhaustion phase of the downtrend, the indicator creates Higher Highs. This suggests a bearish continuation setup.
The indications are collected from divergences and other indicators to postulate a suitable trading plan with appropriate risk management under hood.
Is divergence strategy good?
Yes, divergence strategy is quite effective for stock trading when used properly. Divergence signals on longer time frames like daily or weekly charts tend to be more accurate with fewer false signals. This results in fewer trades, but the profit potential on each trade is substantial if you manage risk and structure the trade correctly.
On shorter time frames like hourly charts, divergences occur more often but tend to be less reliable. Divergence is a powerful tool but should be combined with other confluence factors for highest probability setups. Using it selectively on higher time frames allows you to capitalize on major trend reversals while avoiding whipsaws from false signals. With the right application, divergence boosts profits for swing and position traders.
Is divergence trading profitable?
Yes. Divergence trading has the potential to be profitable when applied judiciously. Research shows divergence signals between price and indicators often precede major trend changes in stocks. Traders use divergence to spot turns when price diverges from momentum oscillators like RSI. The key is selectivity – divergences on daily or weekly charts tend to be more accurate, generating fewer false signals.
However, divergences on shorter time frames occur more frequently but with less reliability. False divergence signals lead to premature entries or exits, especially in volatile markets. To maximize profits, traders should focus on high probability setups, confirm signals with other factors, and manage risk on each trade. With the proper strategy, divergence trading boost results, but no indicator is perfect on its own. Discipline is required.
What is the best technical indicator for divergence?
The best technical indicators for divergence are oscillators like the Relative Strength Index (RSI) and Moving Average Convergence Divergence (MACD). These momentum indicators are ideal for spotting divergence as their ebb and flow visualizes positive and negative momentum. It signals bearish divergence and a potential trend reversal, when price is making new highs but RSI or MACD starts declining.
It indicates bullish divergence, if the price is making new lows but RSI or MACD starts rising. Traders look for separation between the indicator and price to confirm divergence. RSI and MACD are easy to use, customizable, and widely available on charts and trading platforms. Their accessibility makes divergence analysis achievable for traders at all experience levels. Combining these classic momentum oscillators with the potent chart pattern of divergence creates a straightforward yet powerful trading strategy.
Divergence cheat sheet
Below is a divergence cheat sheet.

Bullish divergence is observed when the price of the scripts form Lower Lows while the indicator creates Higher Lows.
Bearish divergence is observed when the price of the scripts form Higher Highs while the indicator creates Lower Highs.
Bullish hidden divergence is observed when the price creates higher lows and during the exhaustion phase of the uptrend, the indicator forms lower lows. This suggests a bullish continuation setup.
Bearish hidden divergence is observed when the price creates Lower High’s and during the exhaustion phase of the downtrend, the indicator creates Higher Highs. This suggests a bearish continuation setup.
Bullish divergence occurs when the asset makes lower price lows while the oscillator forms higher lows, indicating downward momentum could be easing.
Bearish, or top, divergence is the opposite – as the asset hits higher highs, the oscillator forms lower highs, a potential sign upside momentum is waning.
Hidden divergence appears when new price highs are unaccompanied by confirming highs in the oscillator, suggesting the current uptrend may reverse.
Reverse divergence shows the asset rising while the oscillator falls to fresh lows, a signal the trend could change course going forward.
Arjun is a seasoned stock market content expert with over 7 years of experience in stock market, technical & fundamental analysis. Since 2020, he has been a key contributor to Strike platform. Arjun is an active stock market investor with his in-depth stock market analysis knowledge. Arjun is also an certified stock market researcher from Indiacharts, mentored by Rohit Srivastava.
Shivam is a stock market content expert with CFTe certification. He is been trading from last 8 years in indian stock market. He has a vast knowledge in technical analysis, financial market education, product management, risk assessment, derivatives trading & market Research. He won Zerodha 60-Day Challenge thrice in a row. He is being mentored by Rohit Srivastava, Indiacharts.
Leave a Reply


Recently Published


More in this topic

Join the stock market revolution.
Get ahead of the learning curve, with knowledge delivered straight to your inbox. No spam, we keep it simple.
Comments